
Principal's Message
Growth That Matters: Outstanding NAPLAN and VCE Performance

Principal's Message
Growth That Matters: Outstanding NAPLAN and VCE Performance
There are moments in a school improvement journey when the data gives us genuine reason to celebrate. Our 2026 Year 9 NAPLAN results, together with a new Department measure of Relative VCE Performance, provide one of those moments. So, whilst this is by far my lengthiest Highlights article, it is also a significant milestone worth celebrating.
At the beginning of 2025, I spoke to our students about two non-negotiables for Brighton Secondary College: safety and growth. Since then, we have continued to strengthen classroom practice, lift expectations, use data more effectively and build greater consistency across the College. No single data set can tell the full story of a school, but when multiple measures begin to point in the same direction, it is important that we acknowledge and celebrate that progress.
The most pleasing feature of our 2026 Year 9 NAPLAN data is growth. Achievement tells us where a student is at a point in time; growth tells us how far they have travelled from their own starting point. That is why we place such importance on it. Growth recognises the work of every student, including our highest achievers when they continue to progress at a faster rate than students who began from a similar level.
Across all five Year 9 NAPLAN growth domains, Brighton Secondary College is above the State result and at or above Similar Schools. In Numeracy and Spelling, our growth results also exceed our Network, a particularly strong comparison given that our network data includes two selective-entry settings. This is an exceptional aggregate result and an important sign that our students are continuing to move forward in their learning.
*The select-entry schools in our network (Melb. High and Mac.Rob.) skew our network dataset as their enrolment begins at Year 9. When a student moves to a select entry school the select entry school is attributed to their data despite the learning occurring predominately across the Year 7 and Year 8 years.
Reading: strong growth in our highest-priority domain
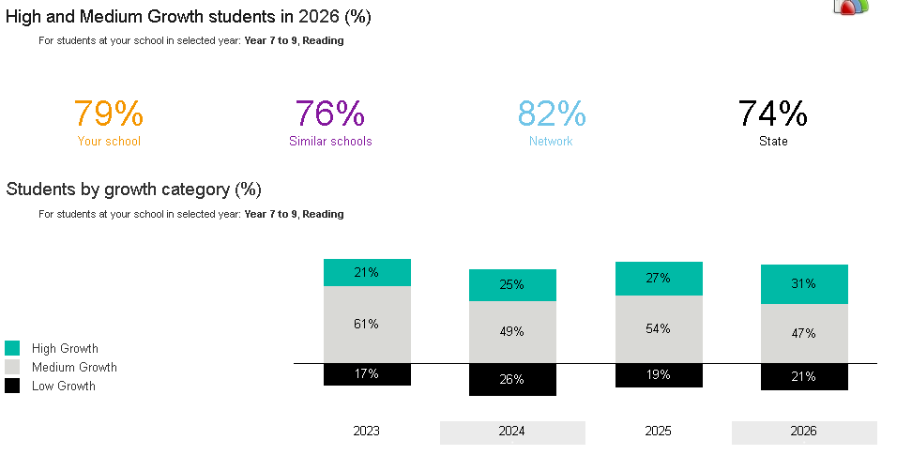
Reading is our highest-priority NAPLAN domain, and the growth data is particularly heartening. In 2026, 79% of our Year 9 students achieved High or Medium growth in Reading, compared with 76% at Similar Schools and 74% across the State.
Even more importantly, 31% of our students achieved High growth. That is the highest proportion across the four years shown in the data and continues a clear upward pattern: 21% in 2023, 25% in 2024, 27% in 2025 and now 31% in 2026. Nearly one in three students in this cohort therefore made High growth between Year 7 and Year 9 Reading.
Our Reading proficiency result is more mixed. Seventy-three per cent of students are in the Strong or Exceeding proficiency levels, compared with 77% at Similar Schools, and this is lower than our 2025 result. We will continue to focus closely on Reading achievement. However, the growth data provides strong evidence that students are progressing from their individual starting points, which is exactly the direction we want to see.
Numeracy: a standout result
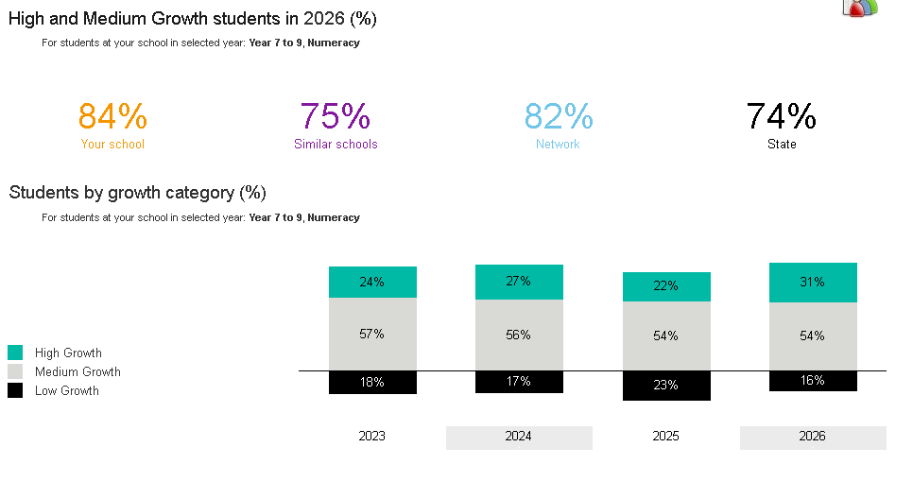
Our Numeracy results are outstanding. Eighty-four per cent of students achieved High or Medium growth, compared with 75% at Similar Schools, 74% across the State and 82% across the Network. This is one of the clearest examples in the data of our students outperforming the expected comparison groups.
The movement within the growth bands is equally impressive. The proportion of students achieving High growth increased from 22% in 2025 to 31% in 2026, while Low growth reduced from 23% to 16%. At the same time, 82% of students are Strong or Exceeding in Numeracy, above Similar Schools at 79%, and the proportion of students in Exceeding increased from 19% in 2025 to 28% in 2026.
The 2026 Numeracy mean scale score of 627.2 is also the highest of the four years shown, rising from 614.7 in 2025 and 600.4 in 2024. Taken together, these measures show both strong achievement and very strong learning growth.
Writing: strong achievement and a clear next step
Writing remains another strong area of achievement. Seventy-six per cent of our Year 9 students are Strong or Exceeding in Writing, above Similar Schools at 74%. This is also above our 2023 and 2024 results, although below the particularly strong 2025 cohort.
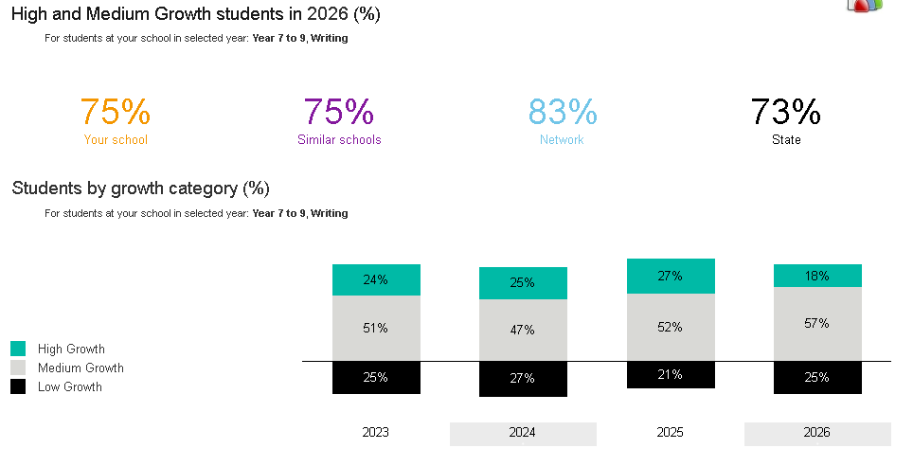
In growth, 75% of students achieved High or Medium growth. That is in line with Similar Schools and above the State result of 73%. The proportion achieving High growth is an area we want to lift further, and this will remain part of our ongoing work. The important point is that Writing continues to compare well on achievement while growth remains above the State benchmark.
The growth story extends across the curriculum
The broader literacy measures reinforce the same picture. In Spelling, 82% of students achieved High or Medium growth, compared with 76% at Similar Schools, 74% across the State and 81% across the Network. In Grammar and Punctuation, the figure is 79%, compared with 76% at Similar Schools and 73% across the State.
The High growth proportion in Grammar and Punctuation has also risen steadily from 24% in 2023, to 27% in 2024, 29% in 2025 and 33% in 2026. These results matter because they show that the positive growth picture is not confined to one test or one area of learning.
A new lens on VCE: Relative VCE Performance
This year the Department of Education also introduced a new Relative VCE Performance data set, currently showing the 2024 and 2025 Year 12 cohorts. It is an important measure because it does not simply ask whether students achieved high VCE study scores. Instead, it compares each student’s VCE study score with the scores of Victorian students who achieved a similar Year 9 NAPLAN scale score.
The measure classifies VCE study scores as High, Medium or Low relative performance. High relative performance represents the top 25% of study scores among students with a similar Year 9 NAPLAN starting point, Medium represents the middle 50%, and Low represents the bottom 25%. For English subjects, the comparison uses Year 9 Reading and Writing; for Mathematics subjects, it uses Year 9 Numeracy. Year 11 and Year 12 VCE study scores are analysed together and reported in the year the student completes Year 12.
This makes the 2025 results particularly powerful.
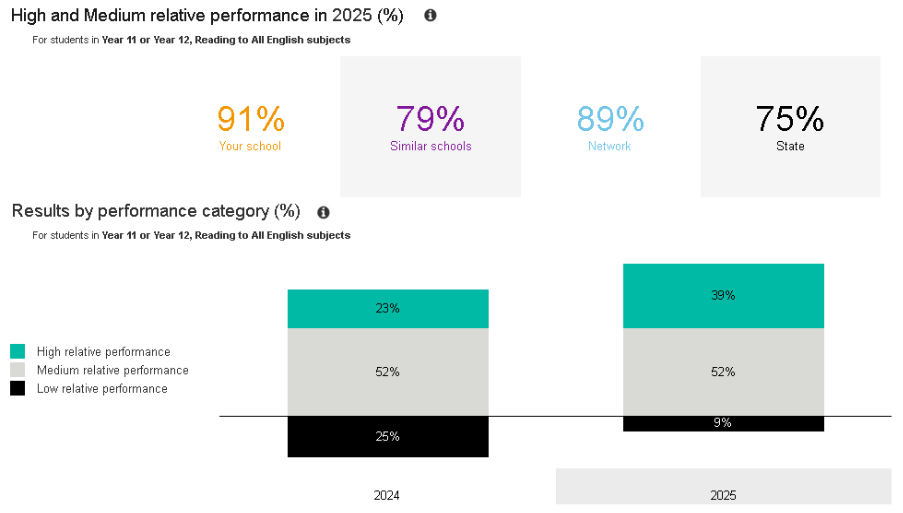
For English subjects referenced against Year 9 Reading, 91% of our VCE study scores were High or Medium relative performance. That compares with 79% at Similar Schools, 89% across the Network and 75% across the State.
The improvement from 2024 is extraordinary. High or Medium relative performance rose from 75% to 91%, the High category increased from 23% to 39%, and Low relative performance reduced from 25% to just 9%.
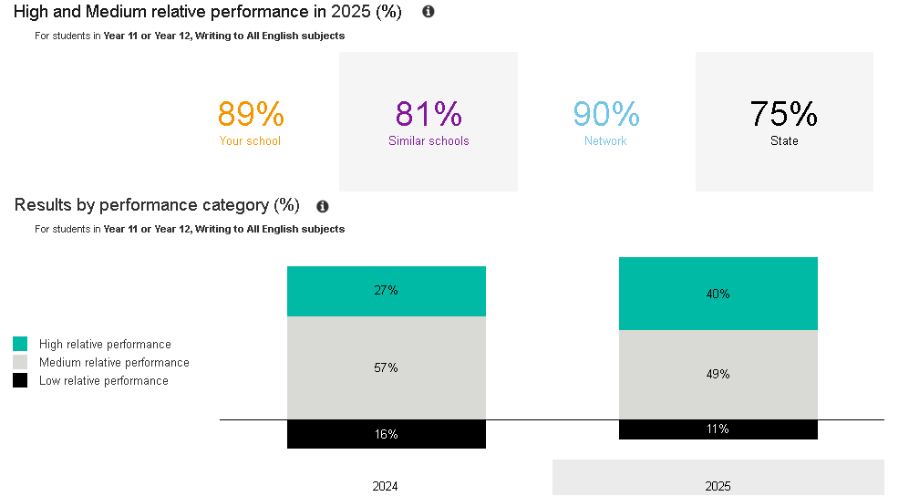
The Writing-to-English result is similarly impressive. Eighty-nine per cent of VCE study scores were High or Medium relative performance, compared with 81% at Similar Schools and 75% across the State. Forty per cent were in the High relative performance category, up from 27% in 2024, while Low relative performance reduced to just 11%.
Mathematics is also very strong. Eighty-three per cent of VCE Mathematics study scores were High or Medium relative performance, ahead of Similar Schools at 80%, the Network at 81% and the State at 75%.
These figures give us a valuable new way of looking at senior outcomes. They show that our 2025 VCE students did not simply achieve strong results; in aggregate, they achieved study scores that compared exceptionally well with students who had similar Year 9 NAPLAN starting points. That is exactly the kind of progress we want to see across a student’s time at Brighton Secondary College.
Students remain at the centre of the data
It is easy for a school data discussion to become a conversation about percentages, bands and comparison groups. We must never lose sight of the students represented by those numbers. Every percentage point is made up of young people who have persisted with difficult work, responded to feedback, built knowledge and confidence, and continued to grow.
Our emerging School Strategic Plan places consistent classroom practice, curriculum, assessment and the effective use of data at the centre of our learning work. These results give us confidence that this direction is right. They also remind us that improvement is never finished. We will continue to be honest about the areas where we can do better, while taking the time to celebrate the progress that is evident.
Most importantly, I want to congratulate and thank our students. These results reflect your hard work, your persistence and the way you continue to respond to the high expectations we hold for you.
I also want to thank our parents and carers for your ongoing support. Learning growth is strengthened when school and home work in partnership, and your encouragement makes an important difference.
Further, I want to acknowledge the work of our teachers and education support staff. Our staff understand the importance of ongoing practice improvement and are collectively striving to deliver the highest quality learning experiences for our students.
There is more work ahead, but there is also much to be proud of. Our students are growing, our senior students are outperforming comparable peers, and the evidence continues to build that Brighton Secondary College is moving in the right direction.
The future is bright.