
Leadership

2026 NAPLAN
NAPLAN results were released earlier this term with all students undertaking this year’s assessments receiving an individual report on their achievement.
Achievement outcomes for the school generally showed consistent improvement across all measures. Student achievement in NAPLAN is reported using proficiency standards for each assessment area at each year level. The standards are set at a challenging but reasonable expectation of what students know and can do at the time of testing. There are 4 proficiency levels:
- Exceeding: the student’s result exceeds expectations at the time of testing.
- Strong: the student’s result meets challenging but reasonable expectations at the time of testing.
- Developing: the student’s result indicates that they are working towards expectations at the time of testing.
Needs additional support: the student’s result indicates that they are not achieving the learning outcomes that are expected at the time of testing. They are likely to need additional support to progress satisfactorily.
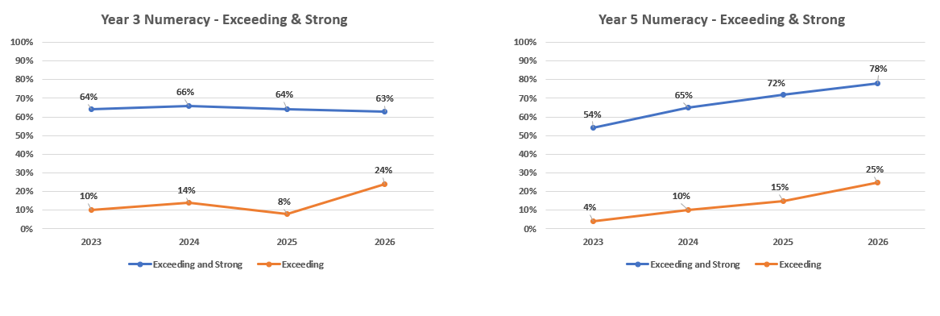
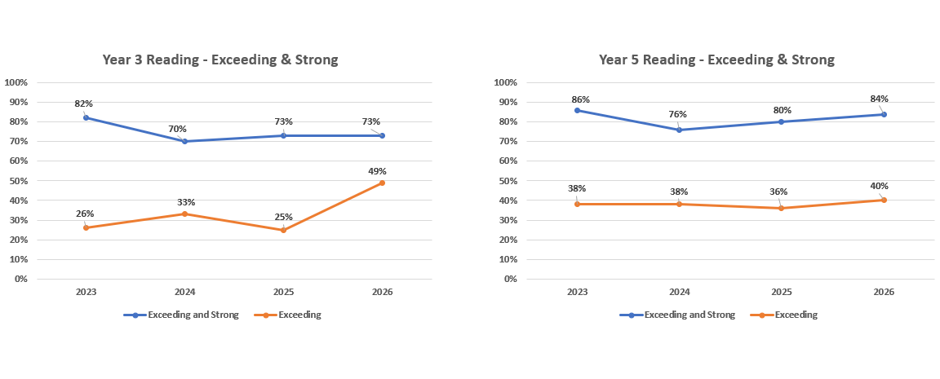
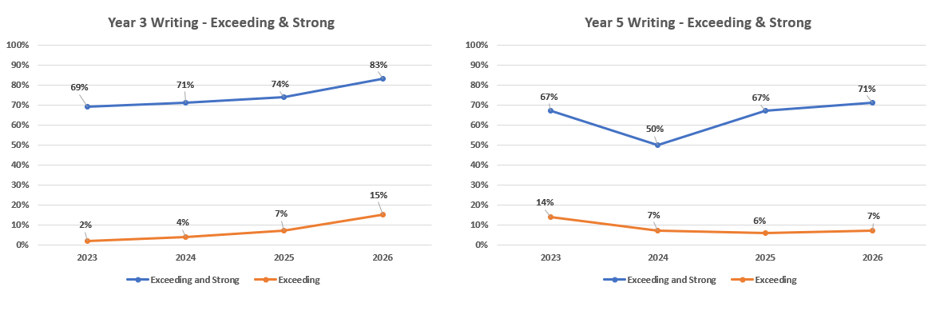
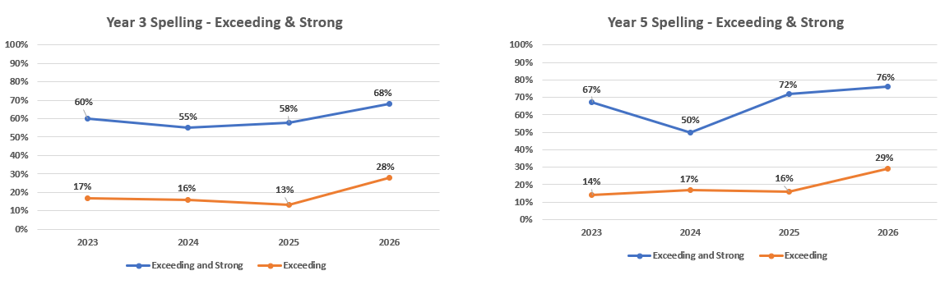
The following line graphs represent the school’s results in each of the domains across the four years that the proficiency standards have been used. The blue line indicates the percentage of students achieving in the Exceeding and Strong proficiencies combined, and the orange line shows the percentage of students achieving at the Exceeding proficiency alone.
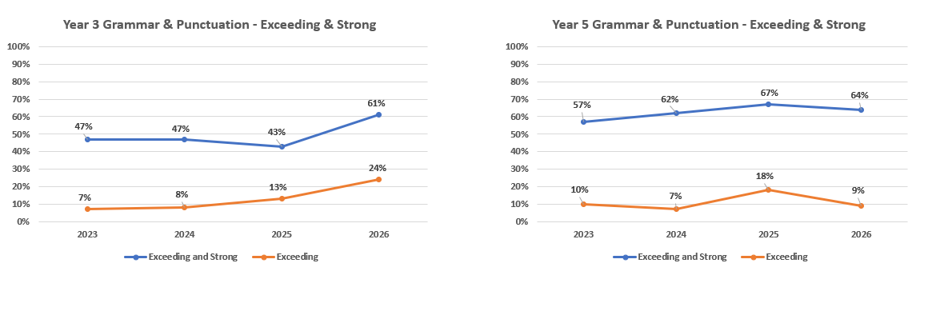
The relative growth results indicate the school performing well above schools with similar enrolment characteristics in most areas. Relative growth measures the growth of each student between Year 3 and Year 5 and between Year 5 and Year 7, comparing their results to the results of Victorian students that achieved the same NAPLAN score in Year 3 and Year 5. The relative growth of each student is sorted into three categories - low, medium and high. Relative growth is a measure of how well a school is able to meet the needs of students regardless of their starting point. All classes have students with a range of proficiency and diverse needs. All teachers have to contend with the challenge of making sure all students are making progress. The percentage of students in high and medium growth is a measure of how well a school is differentiating instruction. The more effectively you differentiate instruction, the higher the percentage of students with high and medium relative growth.
The tables below compare our results to schools with similar student demographics, the Yarra/Darebin network schools and the state average.
Relative growth – High and medium growth
Year 3 to Year 5 | TPS | Similar schools | Yarra/ Darebin network |
Reading | 85% | 77% | 80% |
Numeracy | 78% | 72% | 76% |
Writing | 69% | 72% | 76% |
Year 5 to Year 7 | TPS | Similar schools | Yarra/ Darebin network |
Reading | 94% | 78% | 79% |
Numeracy | 71% | 75% | 78% |
Writing | 91% | 77% | 78% |