Grade 5/6
Steven Meagher (5/6A) Support: Jeremy Cass, Susan Hull
Michelle Agar & Rebecca Bruce (5/6B)
Jamie McDonald (5/6C)
Amy Armstrong (5/6D)

Grade 5/6
Steven Meagher (5/6A) Support: Jeremy Cass, Susan Hull
Michelle Agar & Rebecca Bruce (5/6B)
Jamie McDonald (5/6C)
Amy Armstrong (5/6D)
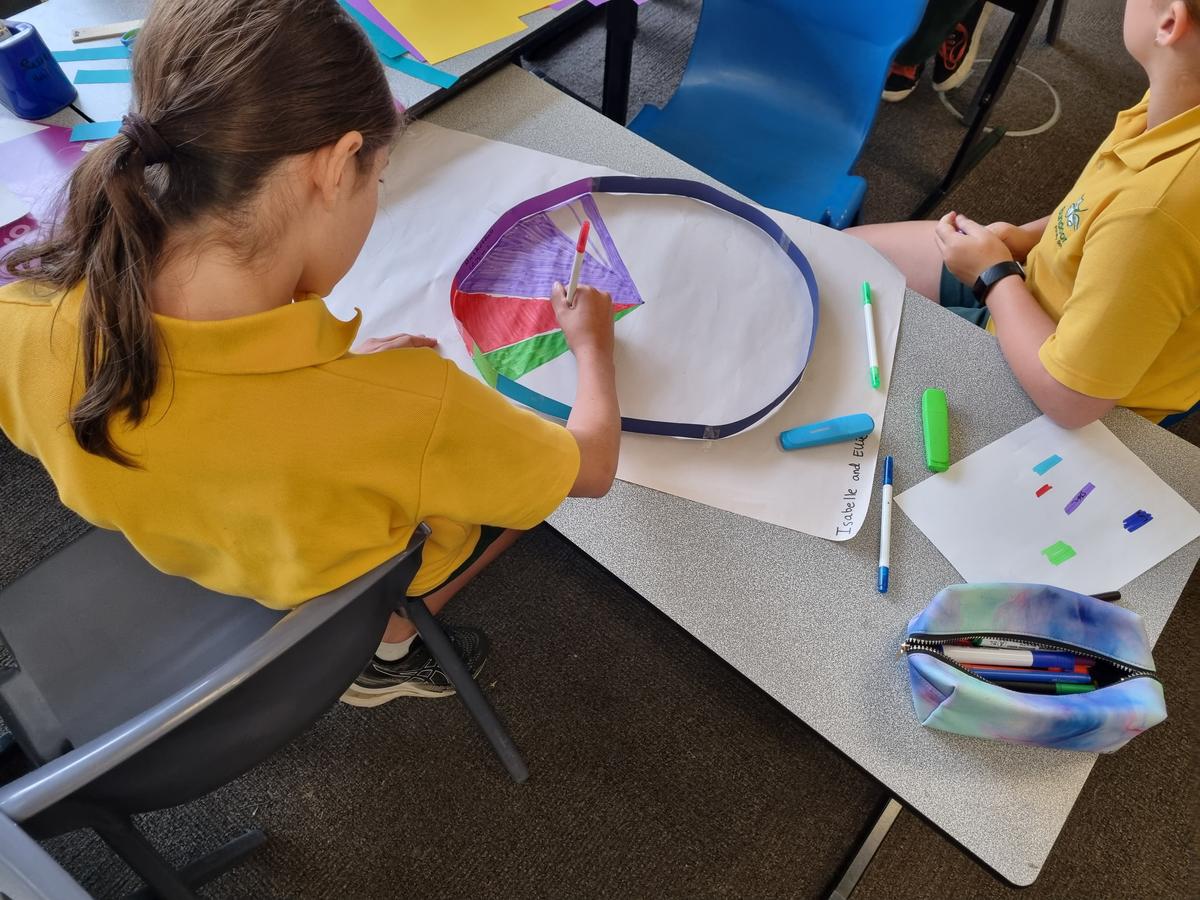
The Grade 6 students have been working hard to complete a pie graph, while the Grade 5s have been completing NAPLAN. We have been having a great time creating them. They were based on our favourite sports and I think we did amazing!
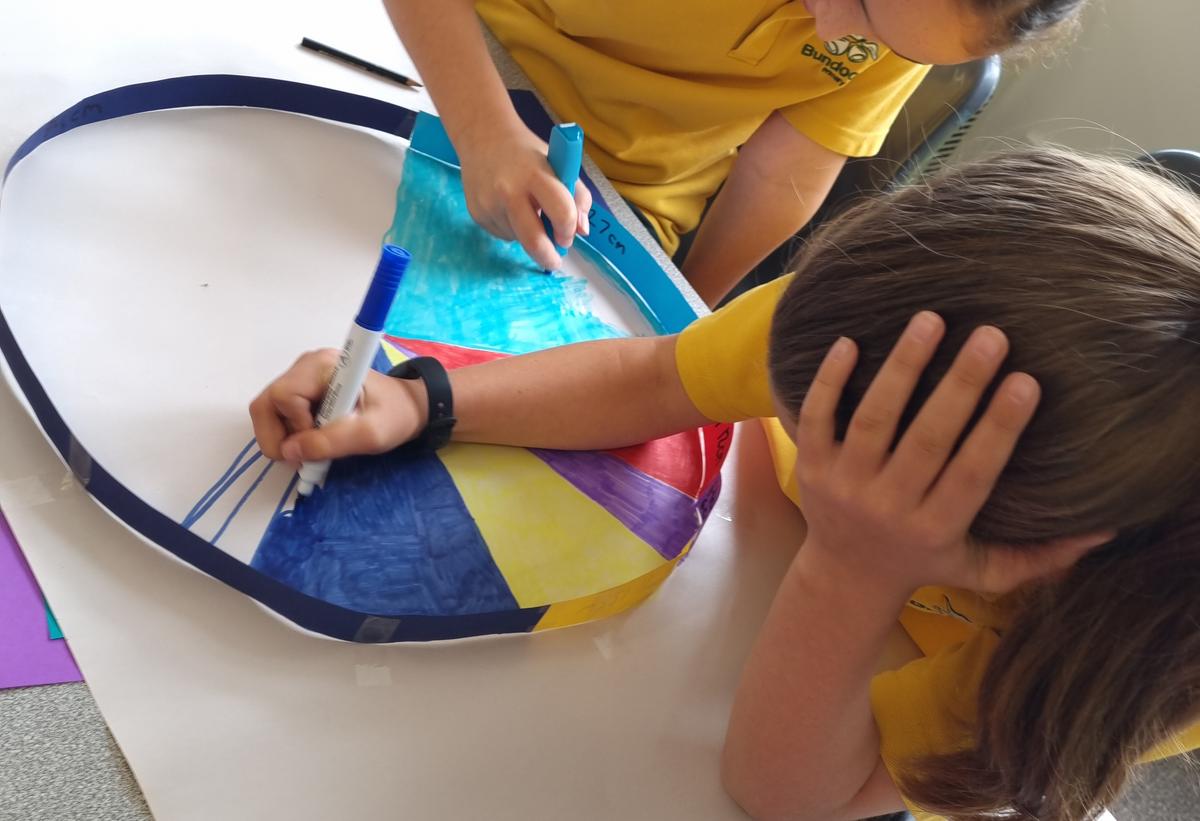
First, we surveyed the students to determine the data. Next, we created the charts. For our chart 3cm represents one person. We spent two sessions working on our pie charts and they were lots of fun to make.
Our pie charts were created using the information from a survey. We created them and have put them up for display in the Palace.
Jacinta and I gathered all of the results from our surveys about sport. The category ‘other’ included sports such as tennis, soccer, volleyball and more.
We used coloured paper and sticky tape. We coloured the chart, gave it a heading and taped it to the butcher paper.