News from the Learning Community
Year 10-12 Learning Community
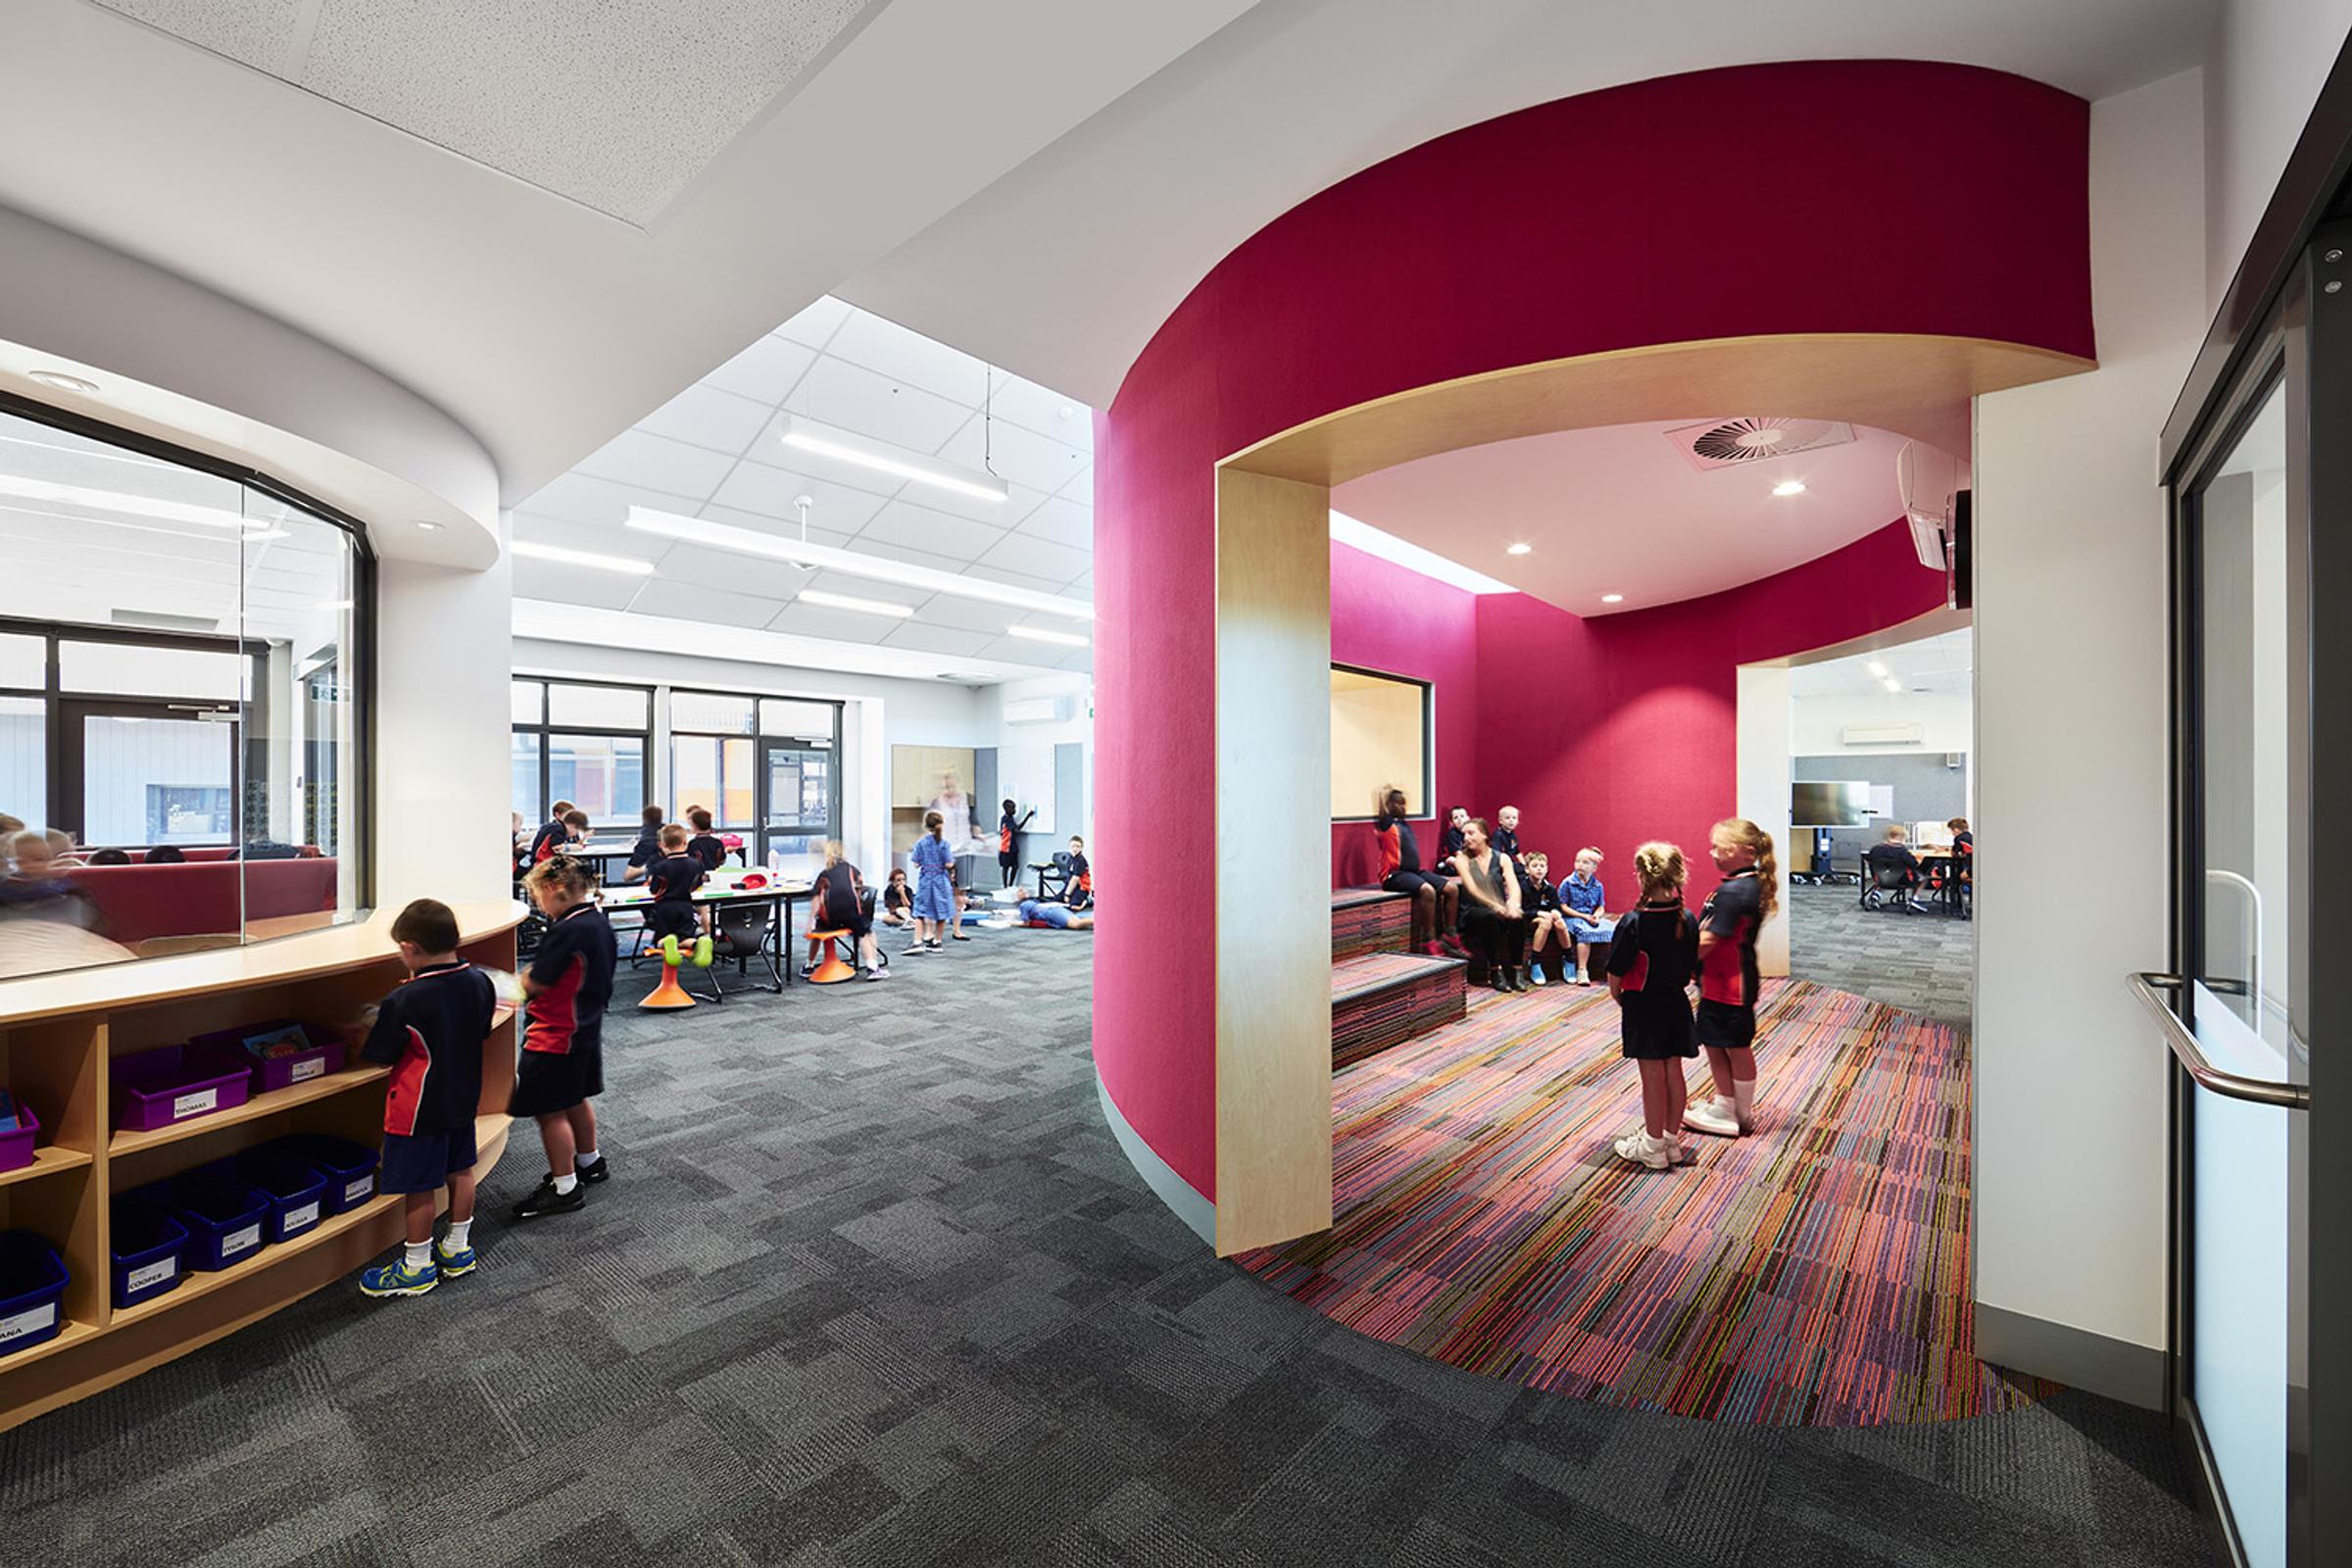
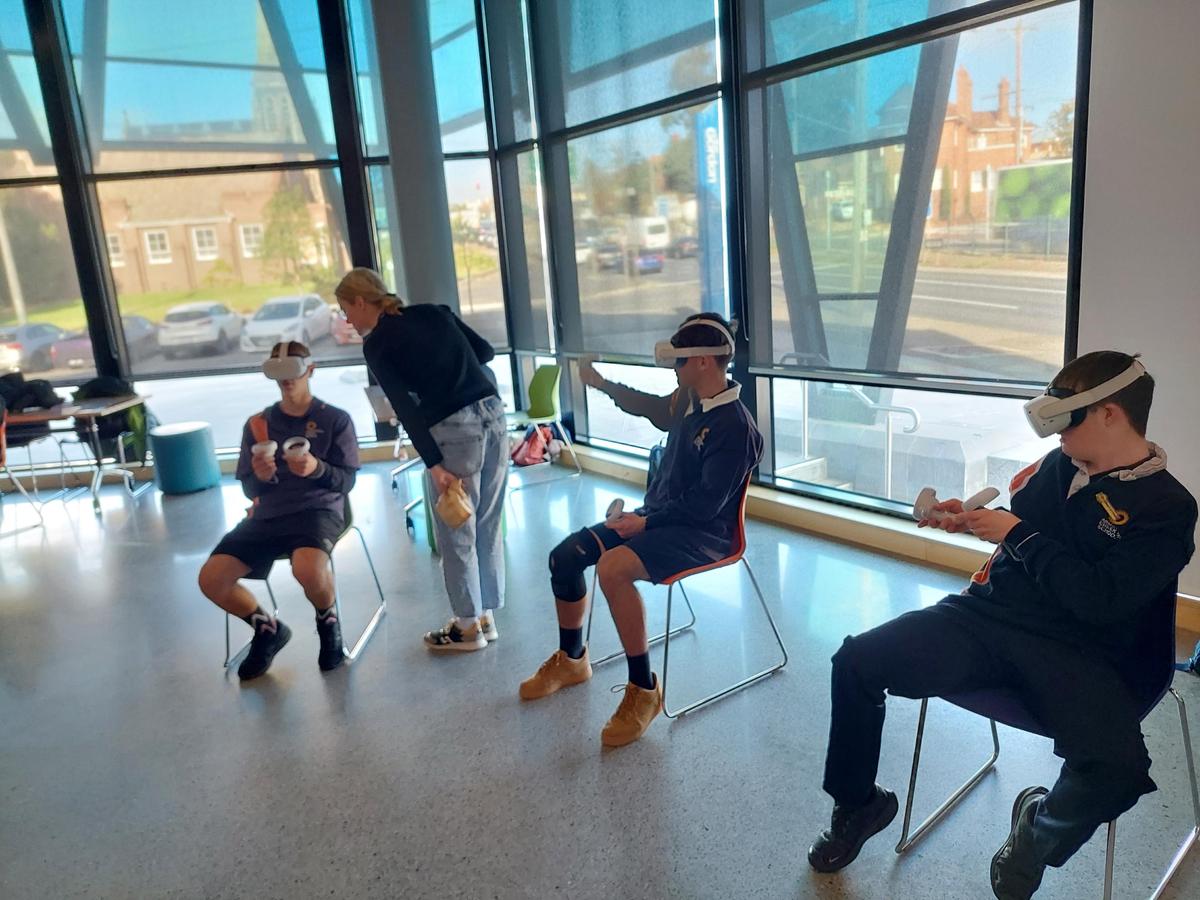
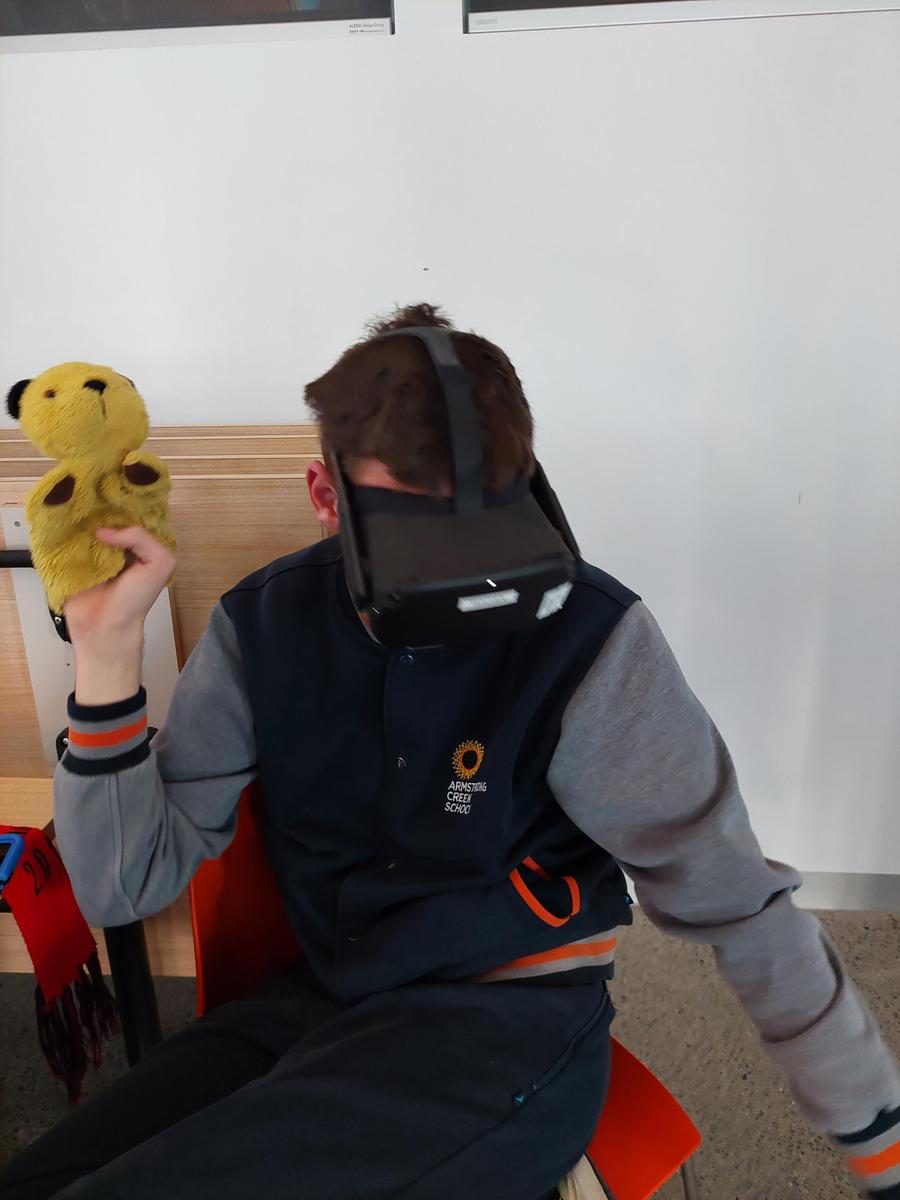
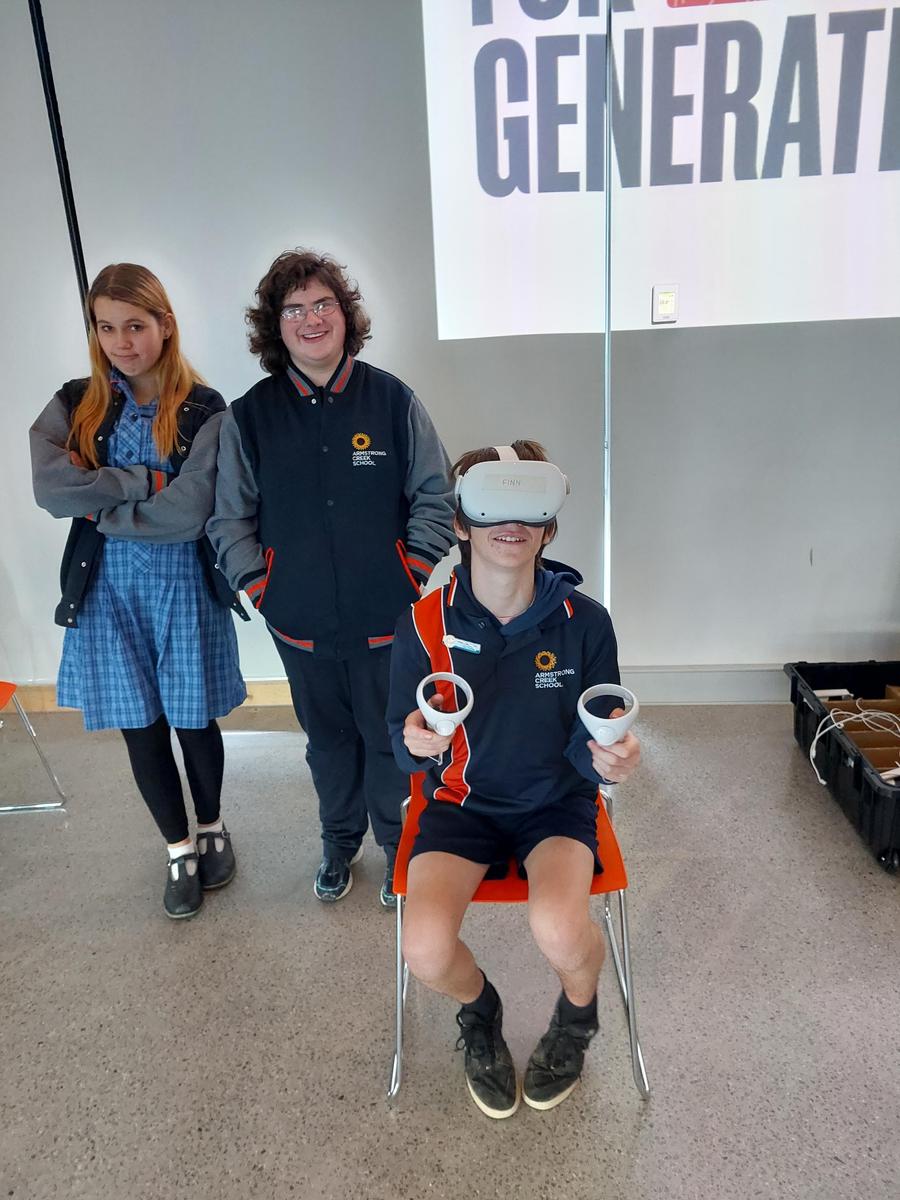
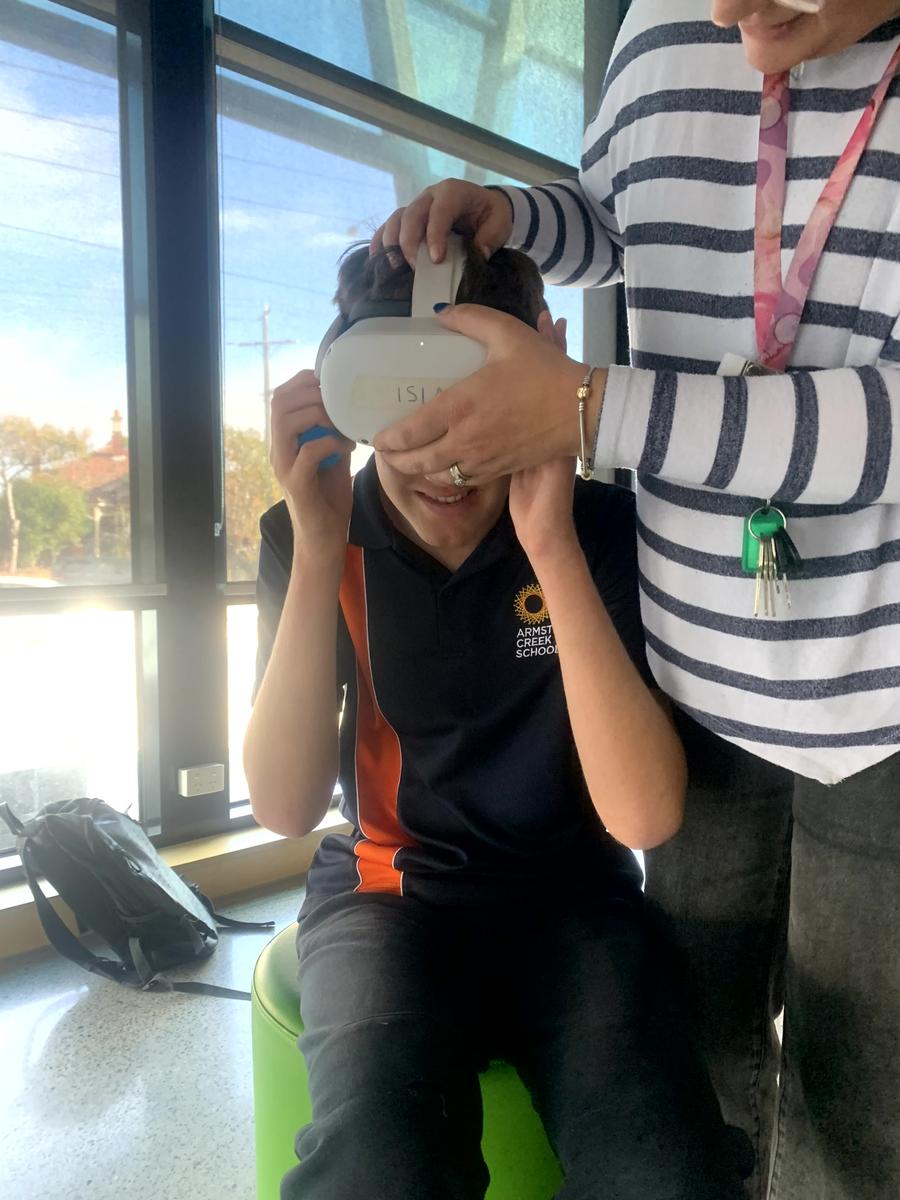
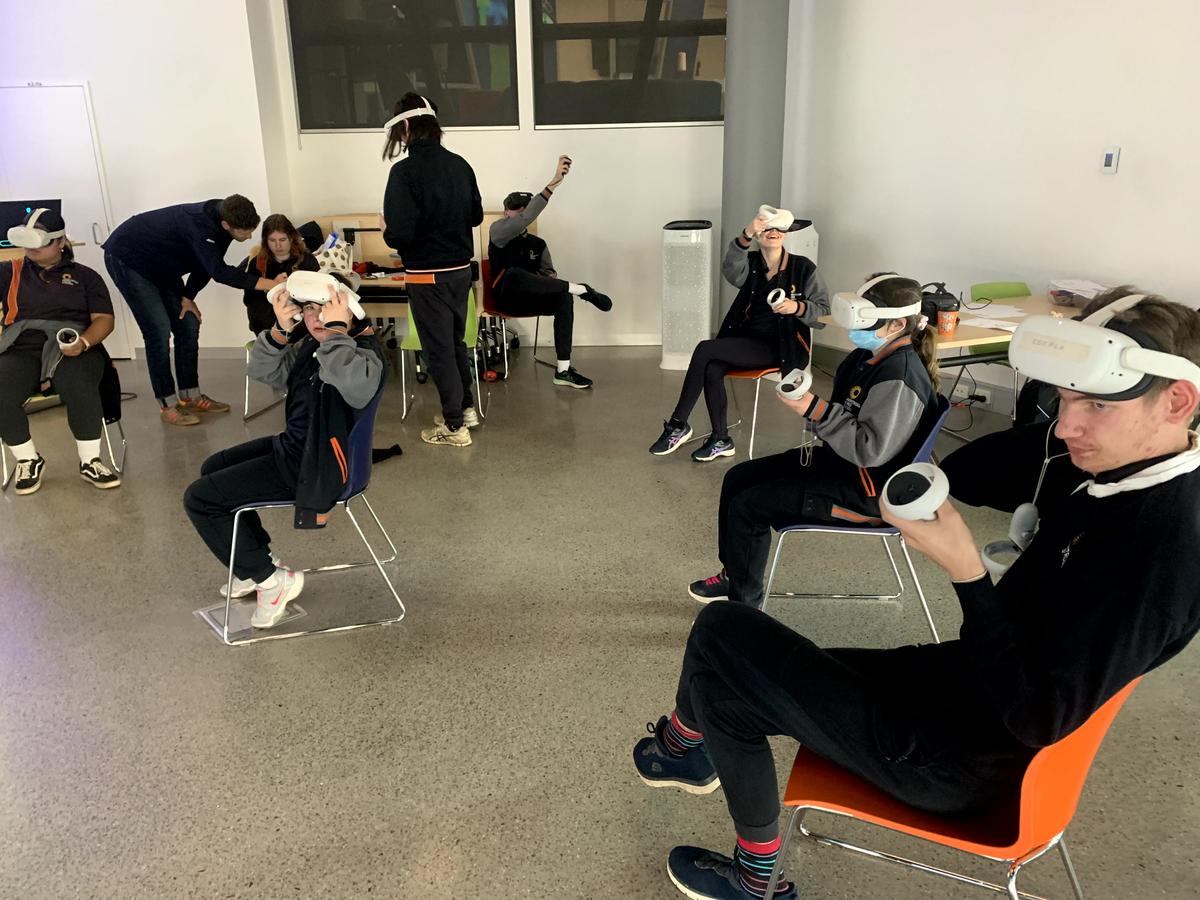
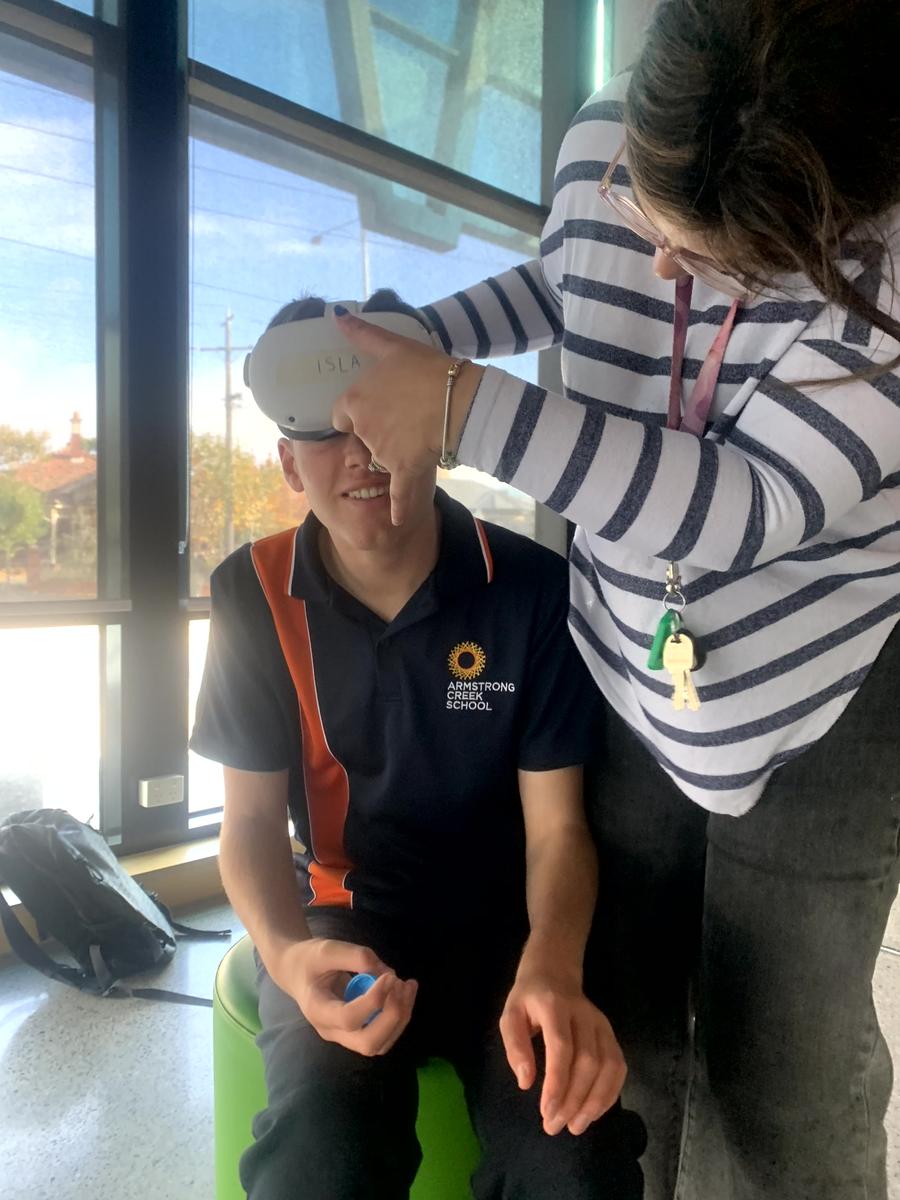
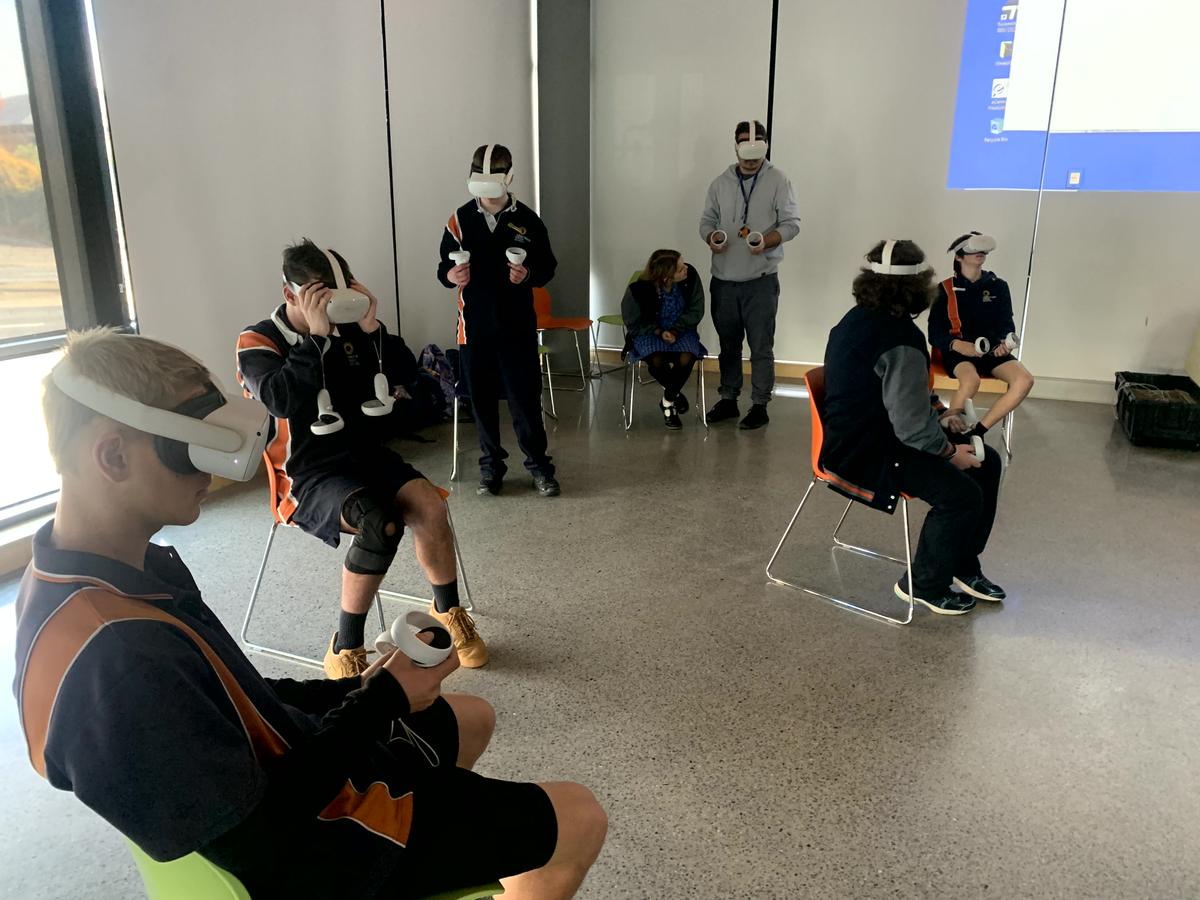
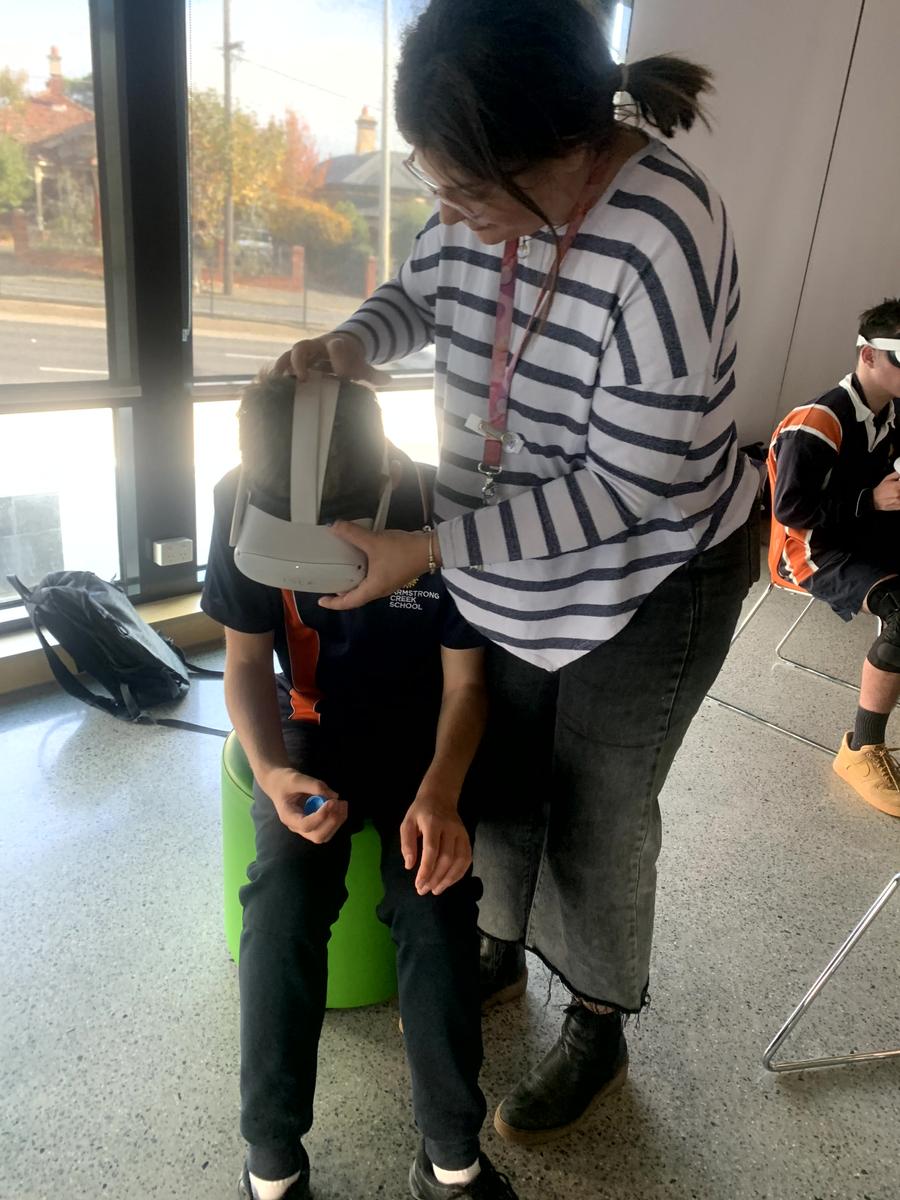
Senior Secondary went to the Geelong Tech School on Monday 29th of May. We saw lots of things there. Some of the things we saw included 3D printers, laser cutters, the advanced computers, and lots of other latest tech. There are lots of programs at Geelong Tech. One school was making marble mazes. Our program was to try Virtual Reality (VR) out. For some of us it was our first time. We played games which helped us learn how to use it. The games were called Beat Saber, Epic Roller Coaster, Gorilla Tag, Tilt Brush and more. We learnt to find our way around Gordon, communicate with our group and travel there on the bus. It was a great day and we would like to go back one day.
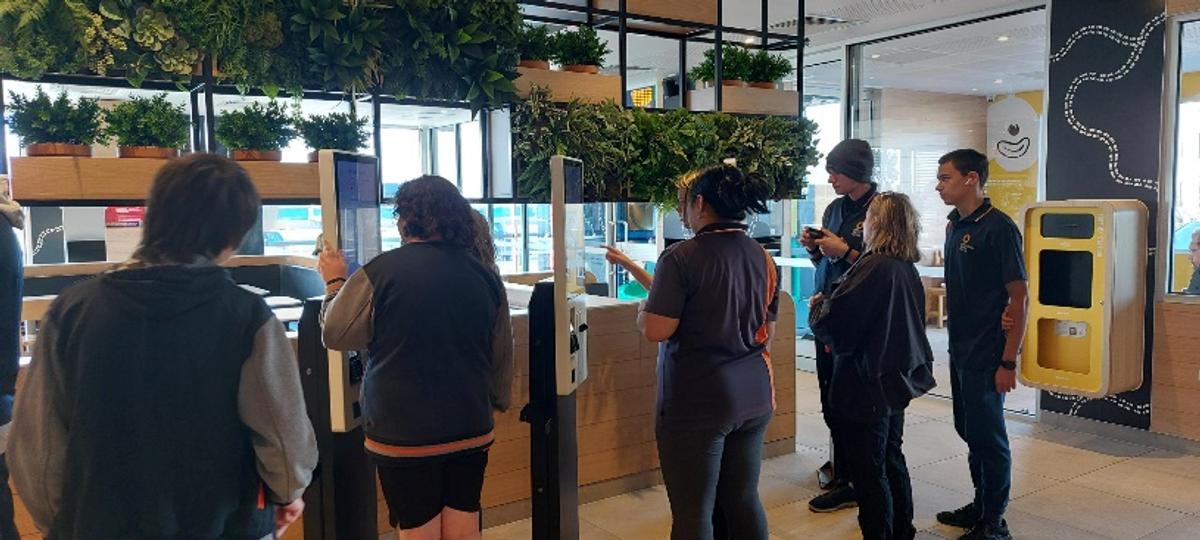
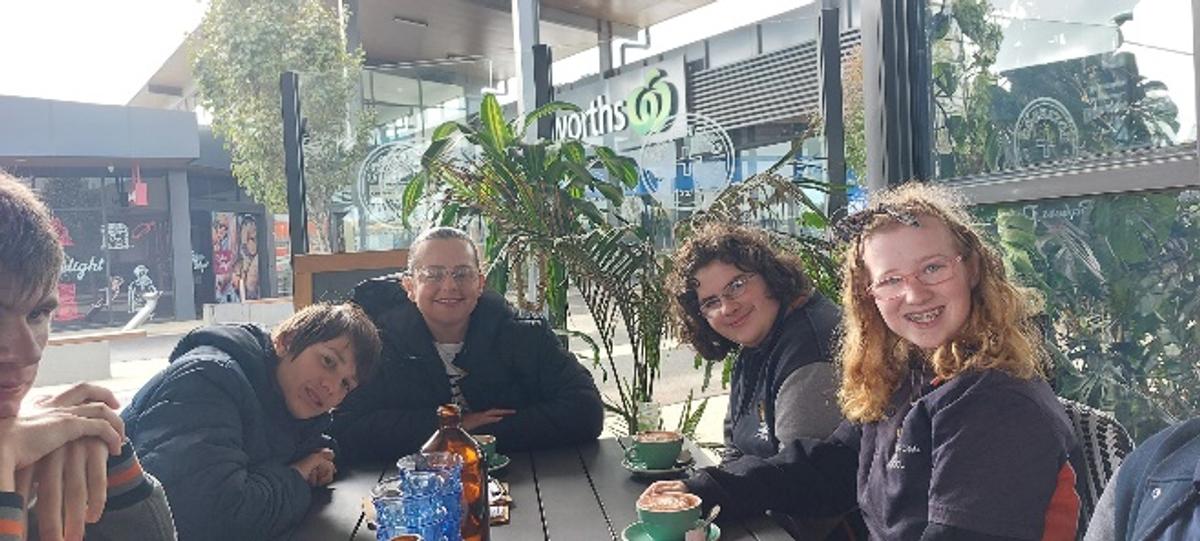
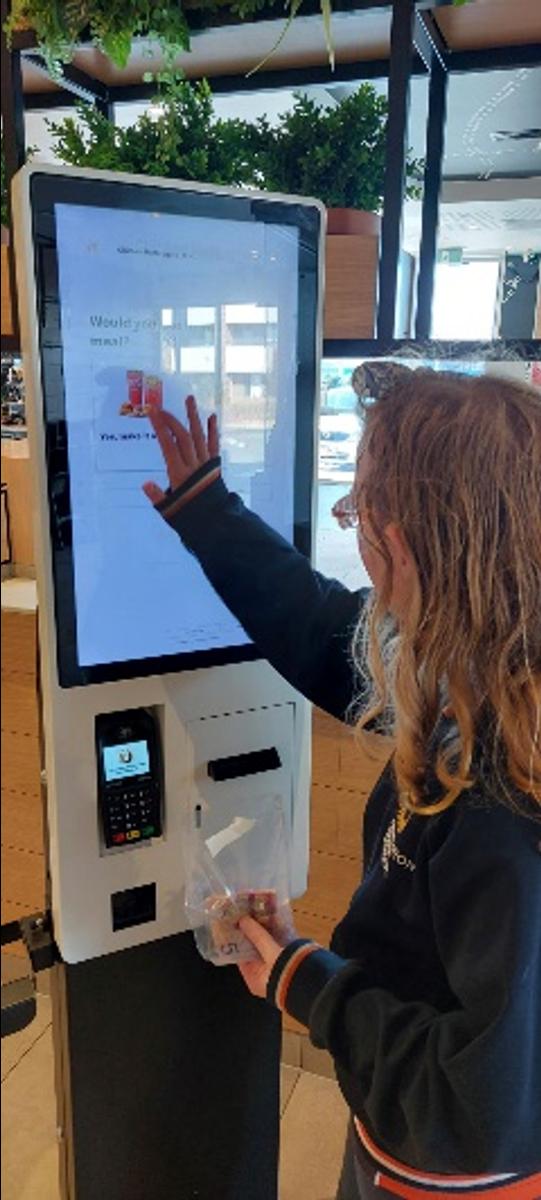
VPC students are currently studying Location within Numeracy and how to run / work in a Cafe for Work Related Skills. Over the weeks we have combined the two to explore how to get to and observe how cafés / food enterprises are run, so far this term we have visited Cockatoo Café and McDonalds. In the coming weeks we will be extending our knowledge in location and travel training and will find our way to Bounce for an end of Semester celebration.
Year 2
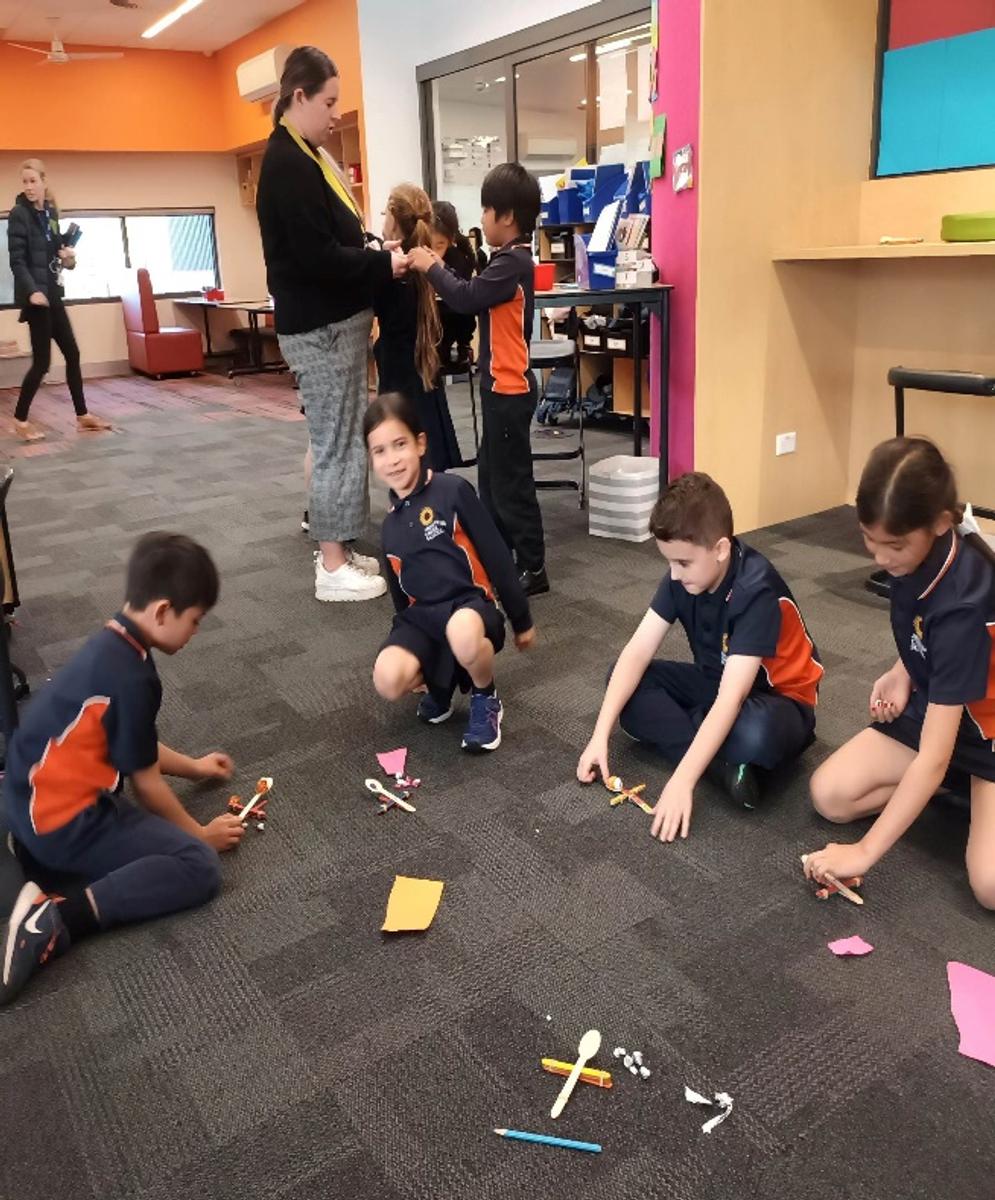
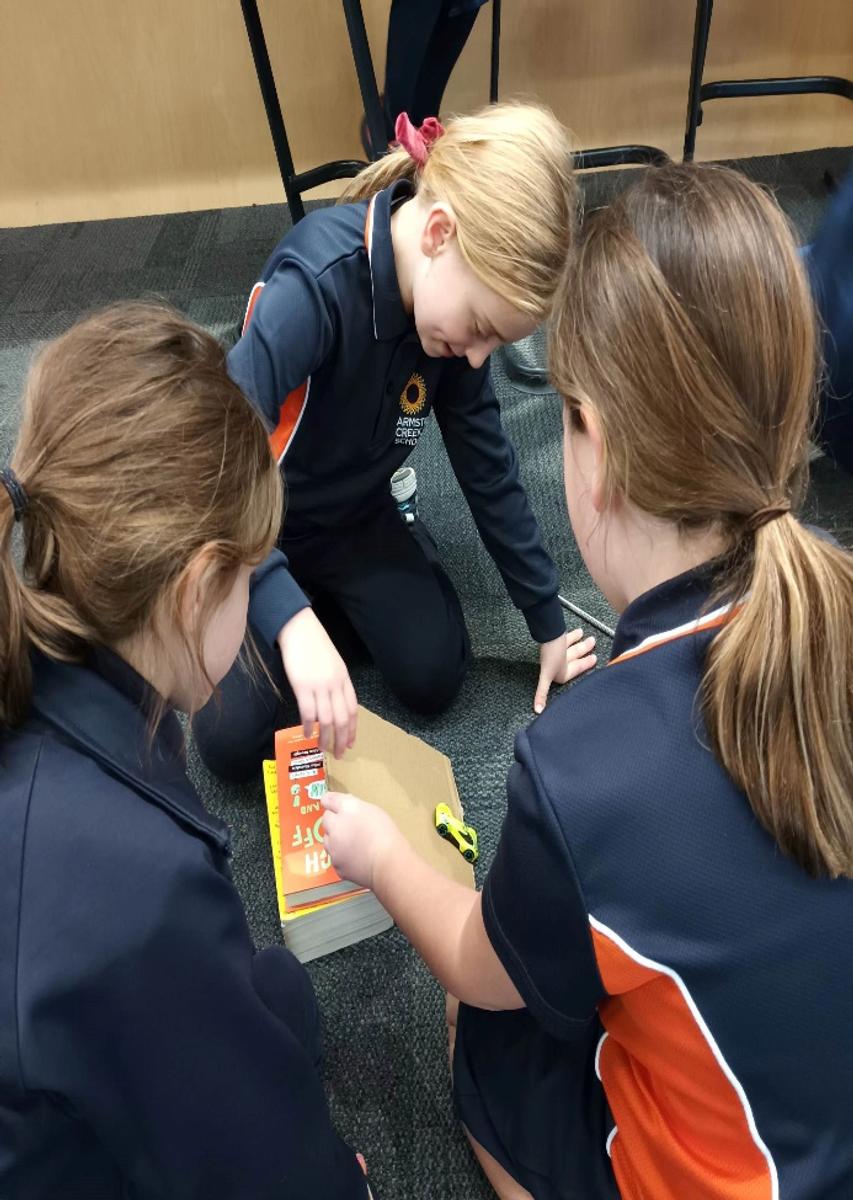
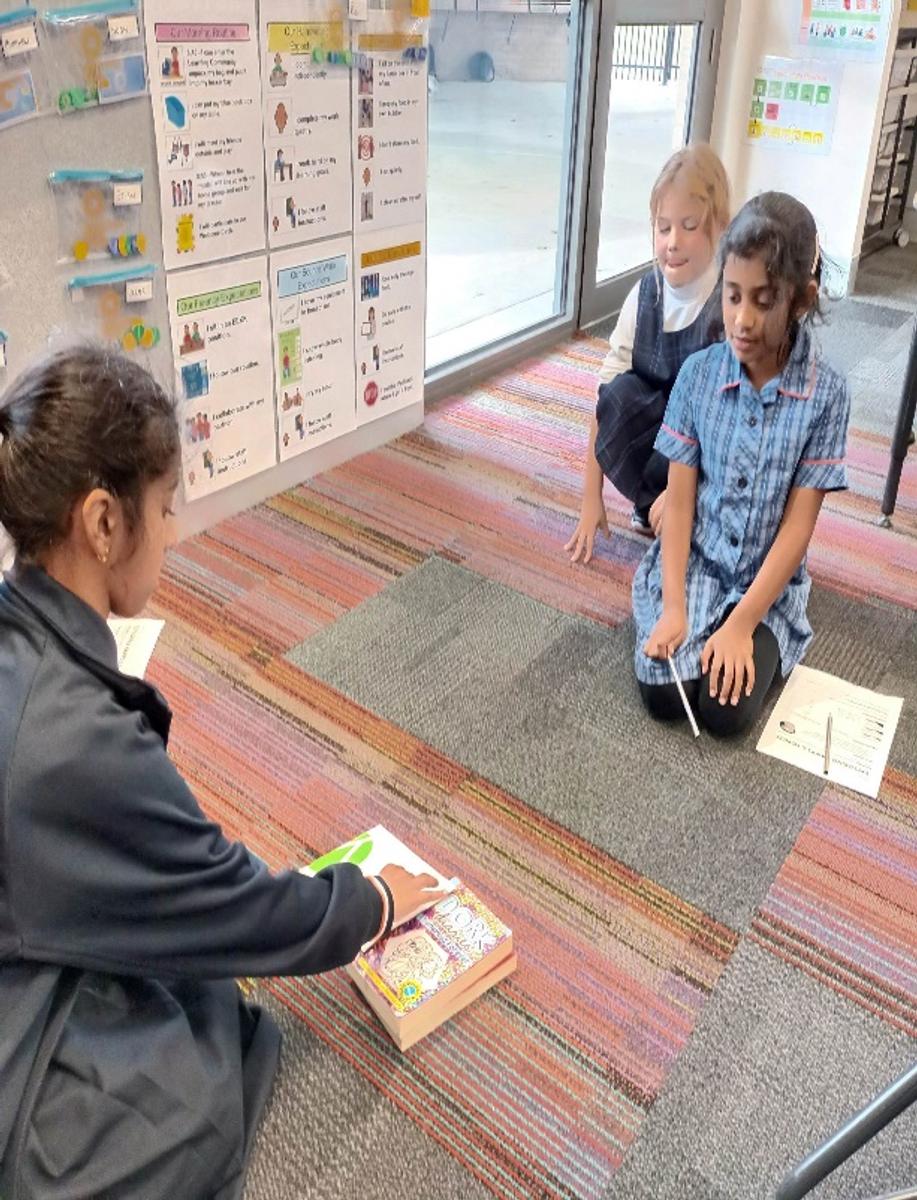
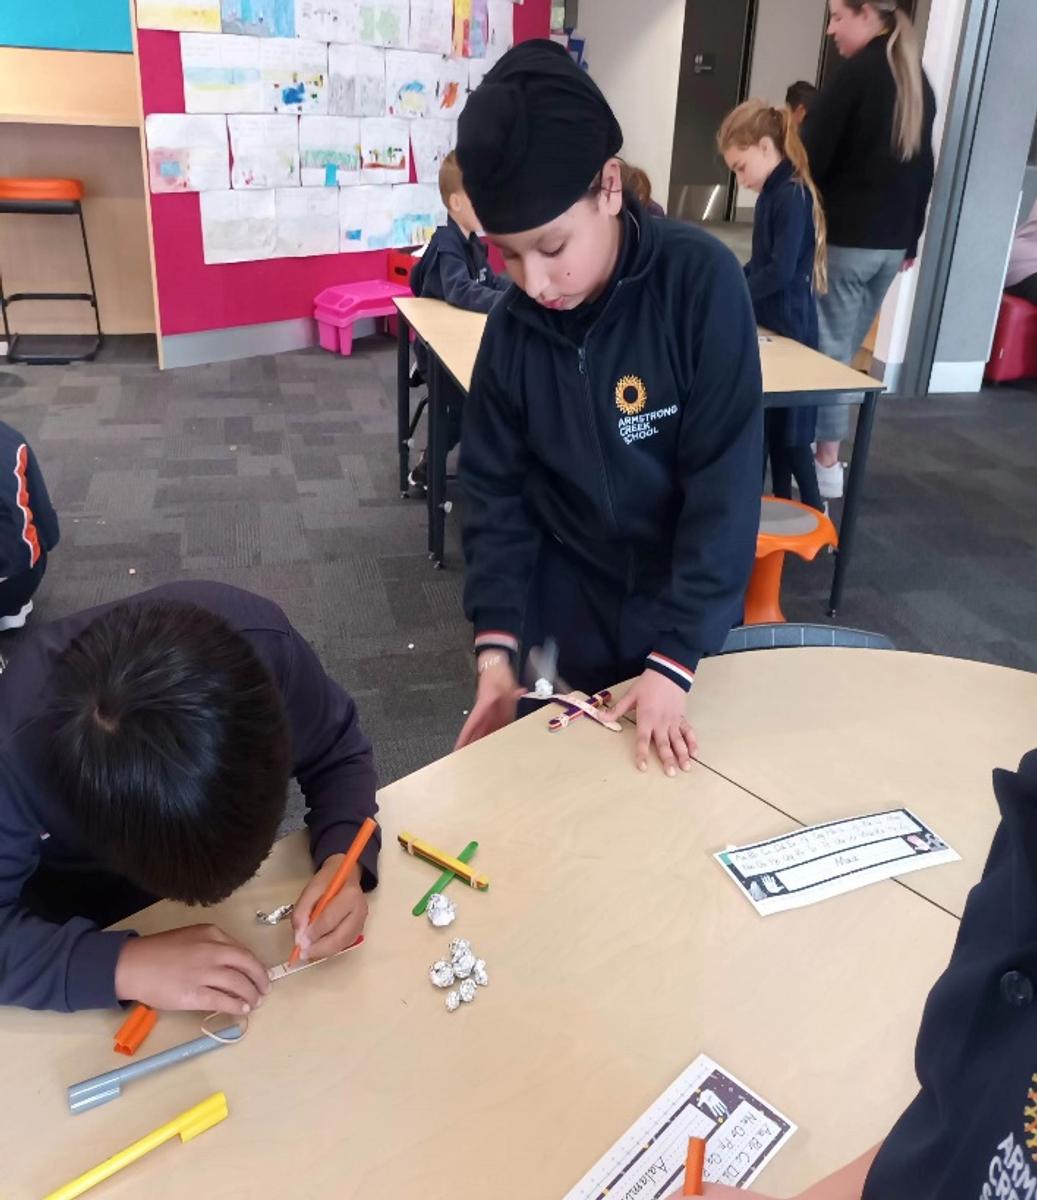
We have been investigating ‘forces’ as part of Physical Science in General Studies. Forces change the way things move. We have learnt how forces make stationary objects move and moving objects speed up, slow down or stop. Forces can change the direction an object is moving in and can even change its shape!
It is not possible to ‘see’ a force—it is only possible to feel or observe its effects. To experience this, students have engaged in a variety of hands-on opportunities to design and test different forces. This included creating catapults and ramps out of recyclable materials and measuring the force of which these designs can move simple objects.
Take a look at our Year 2 scientists in action!
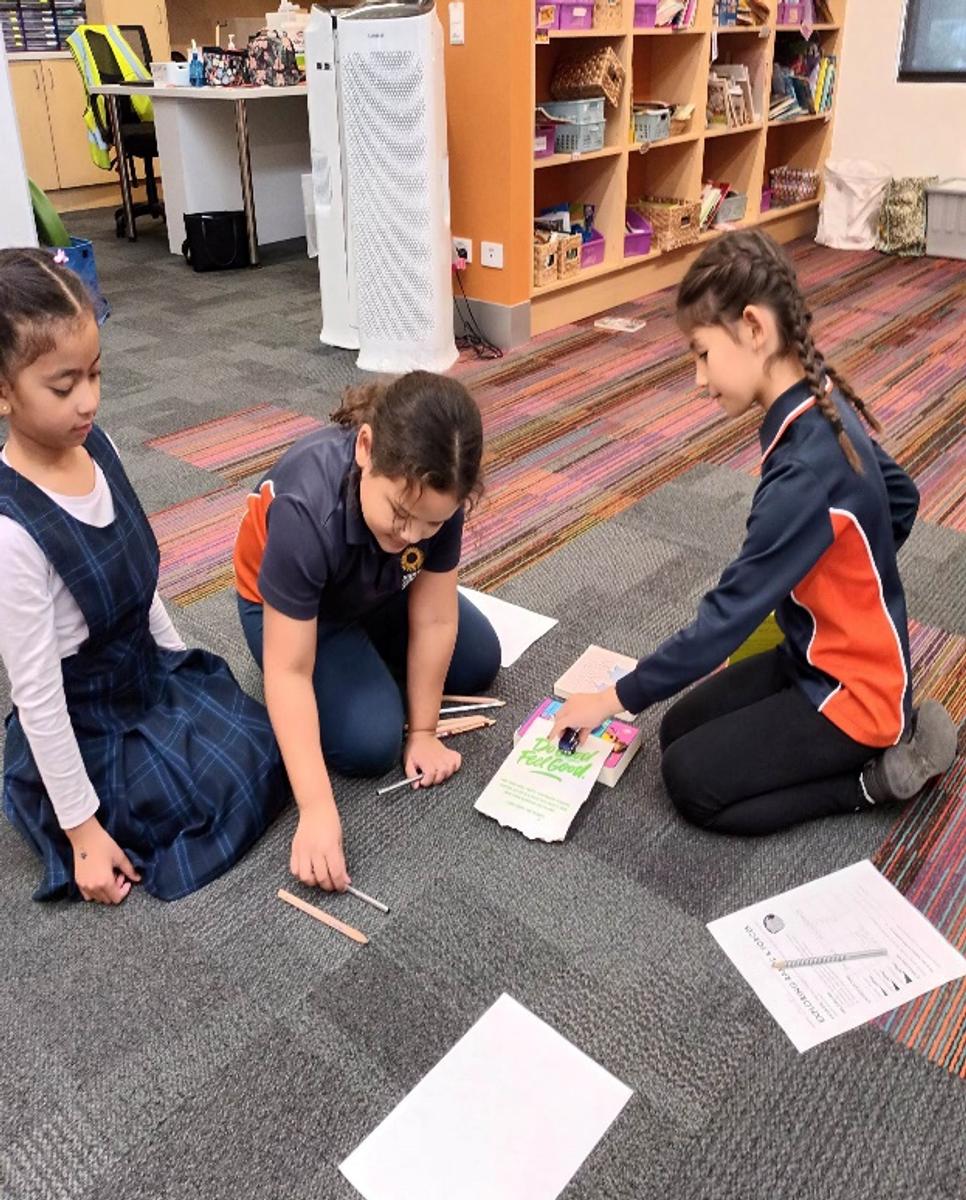

Year 6
In Year 6, we have been learning all about data and graphing. Students have displayed collaboration by working together answering each others survey questions. Students then interpreted this data and displayed the results in a range of different graphs. They showed commitment to their learning by analysing and discussing their graphs extensively.