5/6 MG Digital Tech
Ms Maryanne
5/6 MG Digital Tech
Ms Maryanne
Year 5/6 students have been learning about collecting information (or data) and then recording this information in different ways.
We gather information in surveys, (sometimes called a census) or just by tallying.
Different data needs to be represented in diagrams or graphs for easy reading.
We learnt about different data displays which included….
bar charts, pie charts, line graphs, pictograms, dot plots, a frequency diagram, a table of information, stem and leaf plot and many more.
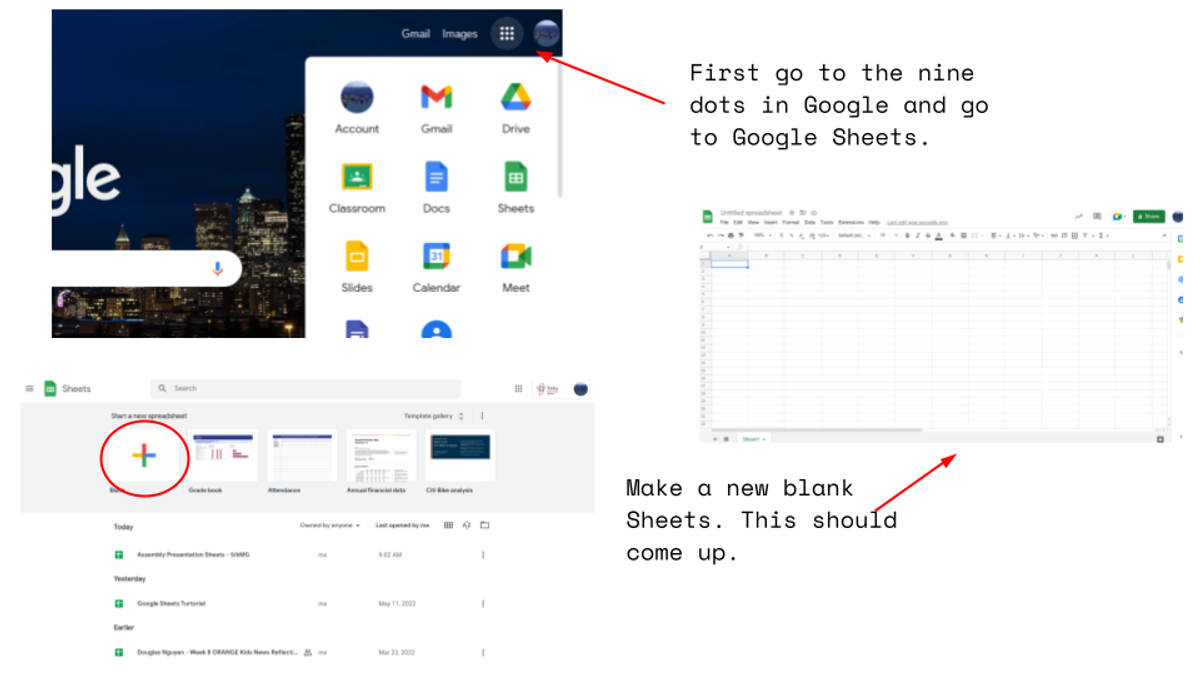
Instead of drawing our own graphs - We learnt how to navigate ‘Google Sheets,’ in an online tutorial program.
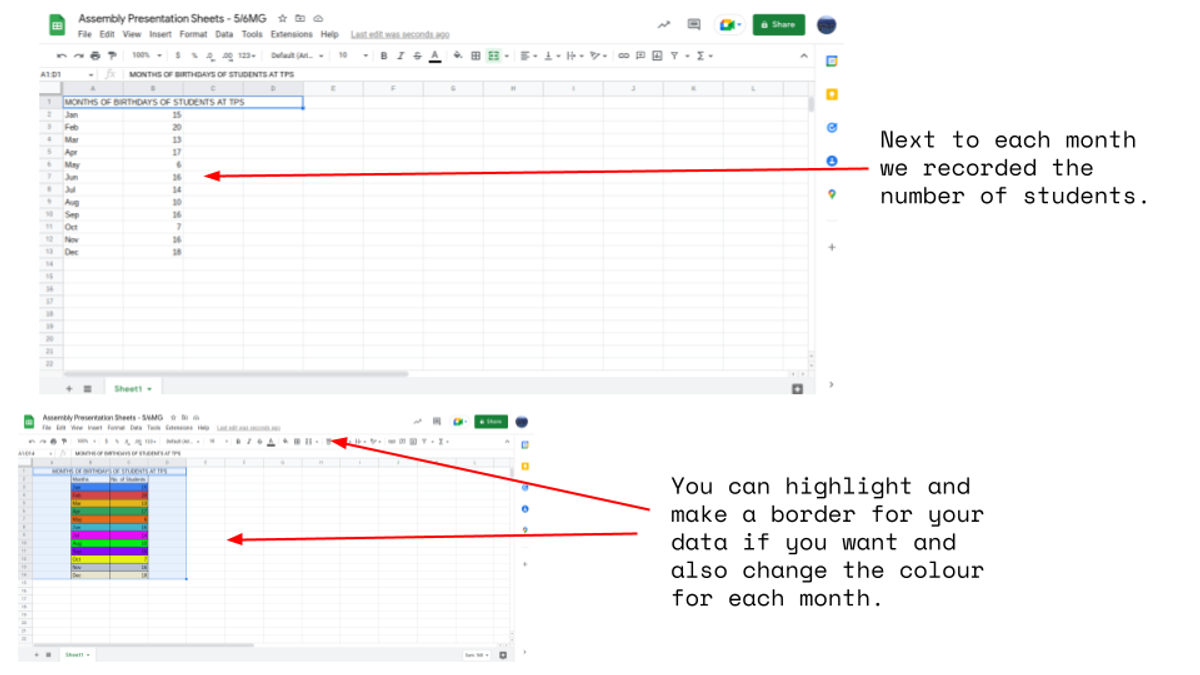
We used data of the months and birth dates of the students from TPS
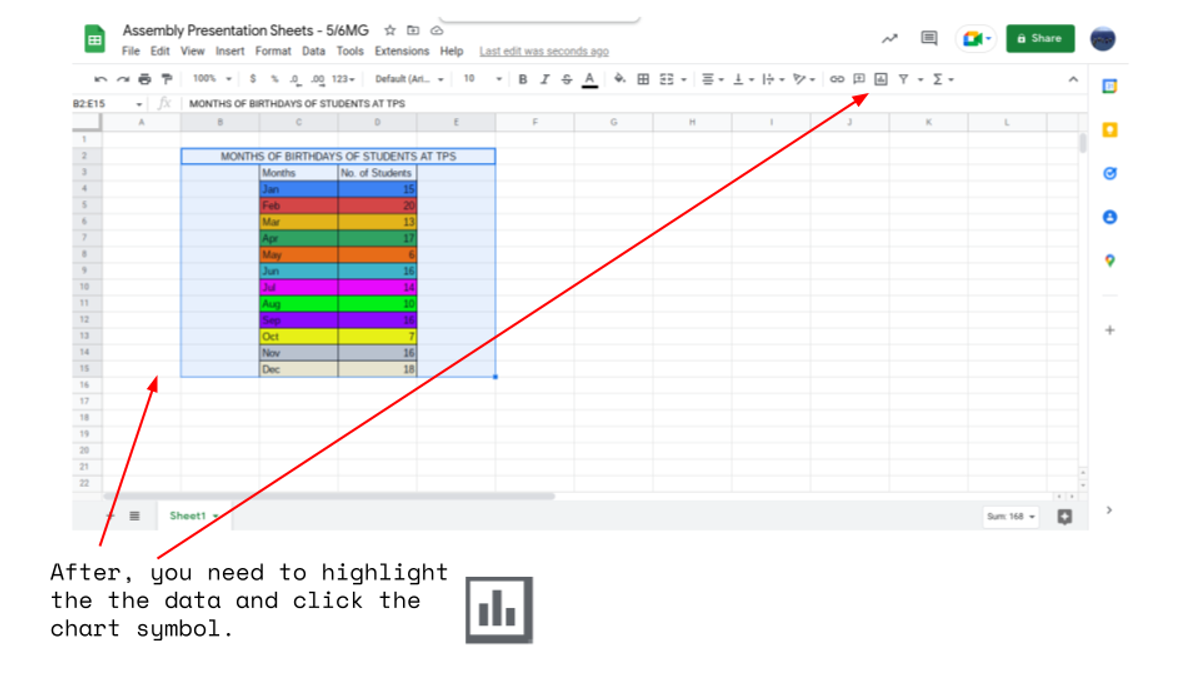
and put this information into the program to practice our Google sheets skills.
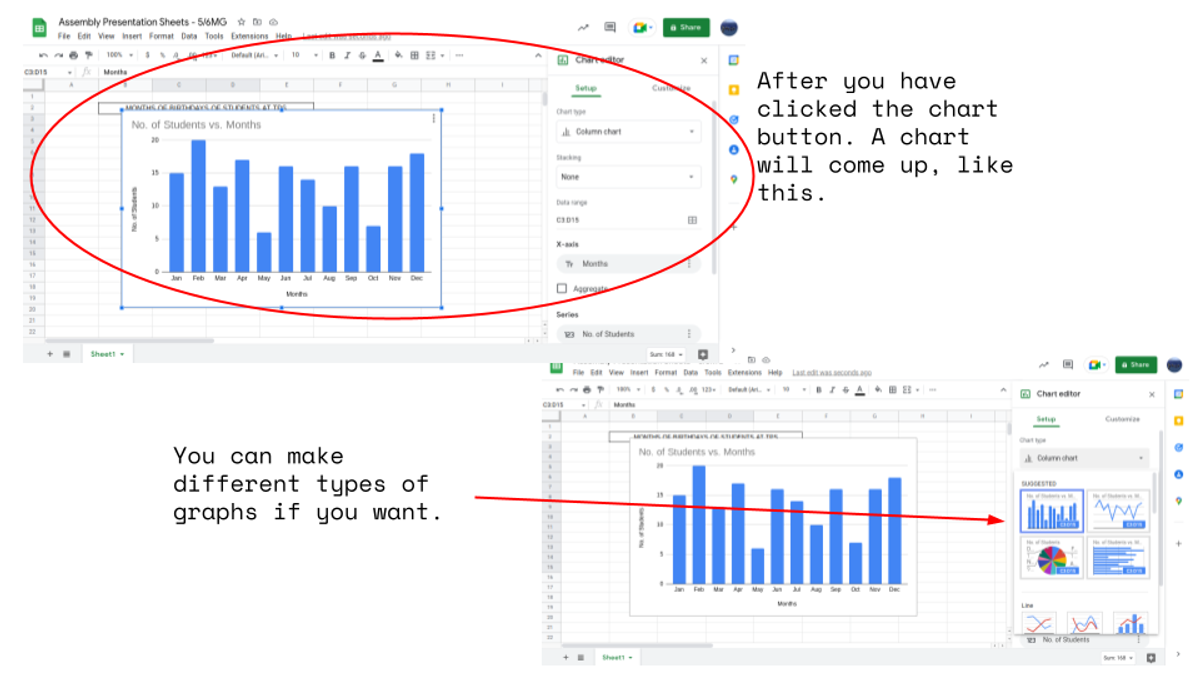
Then the program automatically created graphs to represent this data.
Use this link to see how easy it is.
CLICK HERE TO PRACTICE YOUR GOOGLE SHEET SKILLS AT HOME
From 5/6MG