



Page 0 Banner Photo
Cover Page
DATES TO REMEMBER Banner Photo
DATES TO REMEMBER SEPTEMBER, OCTOBER
PRINCIPAL'S REPORT Banner Photo
PRINCIPAL'S REPORT East Village Campus, Parent/Teacher/Student Conferences, Gymnasium, Meeting With Her Excellency, The Honourable Linda Dessau, Governor Of Victoria, Hollywood came to McKinnon – an hour with Michael James Scott who played the Genie in Disney’s Aladdin on Broadway., 2020 Berthe Mouchette Competition, Music Performance, Studio Arts – Heide Museum of Modern Art Photography Challenge
ARTS MATTERS Banner Photo
ARTS MATTERS NGV Creative Catalyst - Talk About Art Challenge, Looking Forward 
ENGLISH Banner Photo
ENGLISH A time for reflection and celebration
HEALTH Banner Photo
HEALTH Look after you, Jam Drops 
HUMANITIES Banner Photo
HUMANITIES Year 11 Business Management - Marketing Rebrand , VCE Legal Studies students participate in Q & A sesion with the Juries Commissioner of Victoria - Paul Dore
ICT Banner Photo
ICT Go Girl - Cyber Edition, Year 11s Learning the Skills of the Future, Innovative Solutions
LANGUAGES Banner Photo
LANGUAGES 12. September - Tag der deutschen Sprache - Day of the German Language, Alliance Française Berthe Mouchette Competition – , Year 9
MATHS Banner Photo
MATHS Maths and statistics in Lockdown
SCIENCE Banner Photo
SCIENCE How Science can teach us to be more relaxed, Responding to stress, Immerse yourself
SPORT NEWS Banner Photo
SPORT NEWS The term that was... remote
MUSIC NEWS Banner Photo
MUSIC NEWS Gigs on the Screen, Ensemble groups
LIBRARY Banner Photo
LIBRARY What are we reading in lockdown?
SCHOOL INFORMATION Banner Photo
SCHOOL INFORMATION General Office, Uniform Shop, School Uniform - COVID-19 relief sale by Fashion Clubwear, Lost Property
COMMUNITY NEWS/

ADVERTISEMENTS Banner Photo
COMMUNITY NEWS/ ADVERTISEMENTS Community News, Advertisements
View archive
Published by
McKinnon Secondary College
McKinnon Road, McKinnon, Victoria, 3204, AUhttp://www.mckinnonsc.vic.edu.aumailbox@mckinnonsc.vic.edu.au03 8520 9000 Facebook X / Twitter Instagram LinkedIn
Banner Photo

MATHS

Maths and statistics in Lockdown

Stage 4 lockdown has meant many of us have taken up new hobbies with all our extra time at home. This month my cooking exploits made for an interesting Statistics lesson starter for Year 8s. 


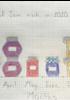
Behold this “jar graph” of all the jams/jellies/chutneys that I have boiled up over the last 6 months. 


Gallery Image


Year 8s were asked whether this was an accurate representation of how much cooking I’ve been doing. We made the following statistical observations:


  • The most productive months were April, July and August, most likely due to stay-at-home orders during these months.
  • This is definitely a “jar graph” not a “histojam”, firstly because jams are not the only thing present in the data, secondly because it represents categorical data, not numerical data.
  • The scale is not very accurate as the jars are all different sizes, the April and July columns should be the same height as the frequency is the same for these two months.


After discussing the “jar graph”, we decided we had better fix it so we used our knowledge of bar graphs to make it a more accurate representation. 


Gallery Image


A bar graph made in class by 08MAT1c. 

Gallery Image


A beautiful pictogram style graph drawn by Katy Do 8A. 


Emma Griffingham

Maths teacher