
Data and Statistics Project
Year 8G

Data and Statistics Project
Year 8G
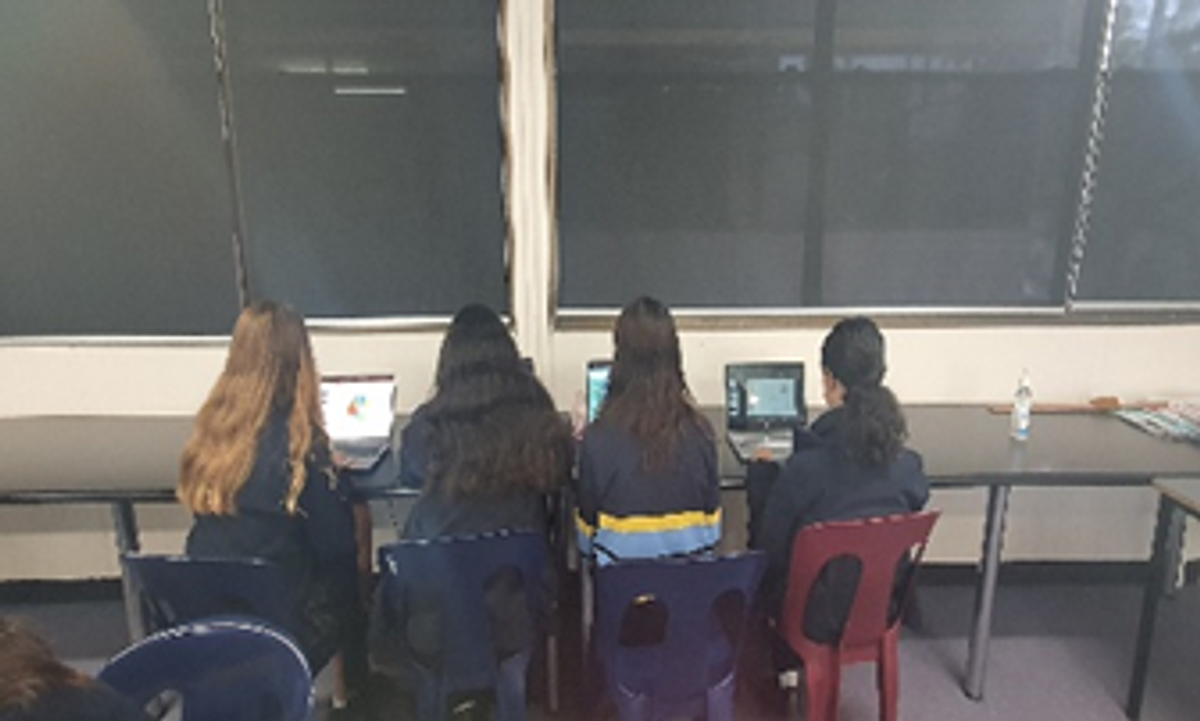
This term in Year 8 Maths we learnt about data and statistics. During this topic, we conducted surveys on a question of our choices - asking a range of Year 8 students. We were able to make a frequency table of our results, different types of graphs using Excel and identify the mean, median and mode. We also interpreted the tables and graphs by asking various questions and summarising the results.

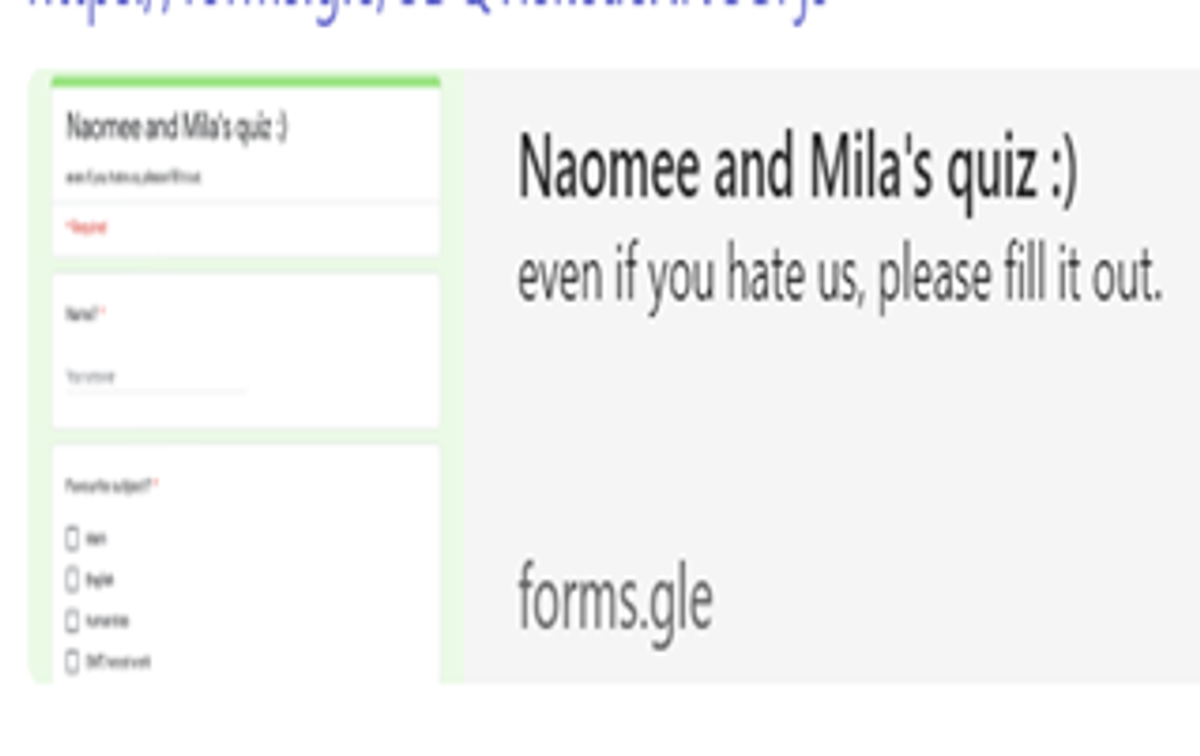

Mila and Naomee: We conducted a survey out of a sample of 100 Year 8 students at Epping Secondary Collage, with the survey question being “What is your favourite subject in Year 8, at ESC?”. We conducted this survey to get a better understanding of our year levels likes and dislikes. Our results can be used to better improve ESCs proceedings and learning environment, by making minor alterations to our timetable to make us students more eager to come to school. This in turn will improve our abilities to absorb more learning techniques and skills. The results showed Physical Education as Year 8’s favourite subject.
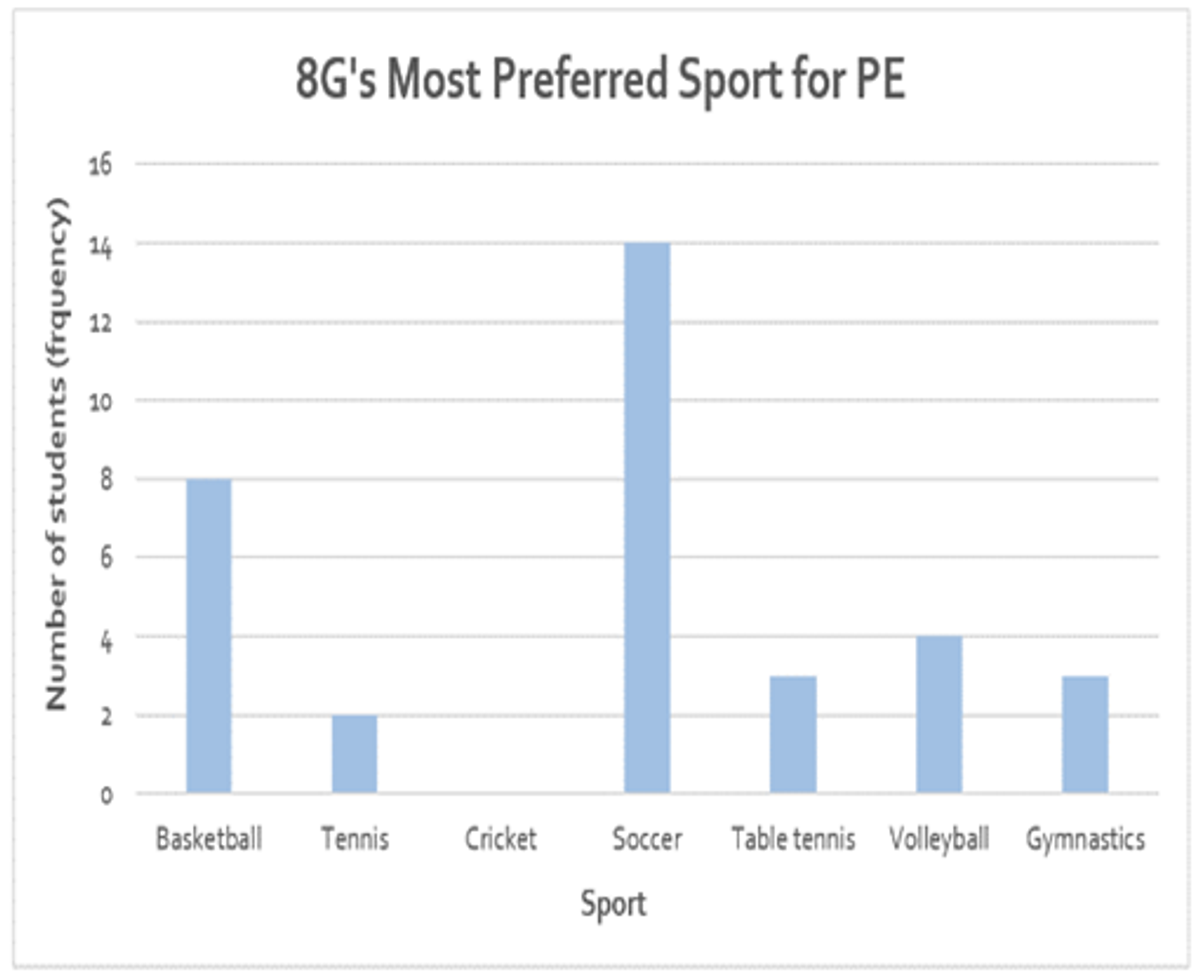
Katerina: The survey that I conducted was based on the question, ‘What is your most preferred sport to play in PE?’. I decided to only survey the students in my class 8G.The PE teacher could use the data from this survey to select a sport that 8G can do in their upcoming PE classes more often and that they would enjoy participating in. The following column graph shows the results of my survey: Soccer is the most preferred sport in 8G for PE.

Stefani, Ian, and Hine: We conducted a survey on the question, "What is your favourite canteen drink?" We decided to survey only a sample of year 8 students in our class (8G), to acquire our data and results. This survey was conducted so that the canteen workers could understand which drinks were most popular, and to make investment in and supply more of it. Powerade option is the most favoured drink of 8G students.

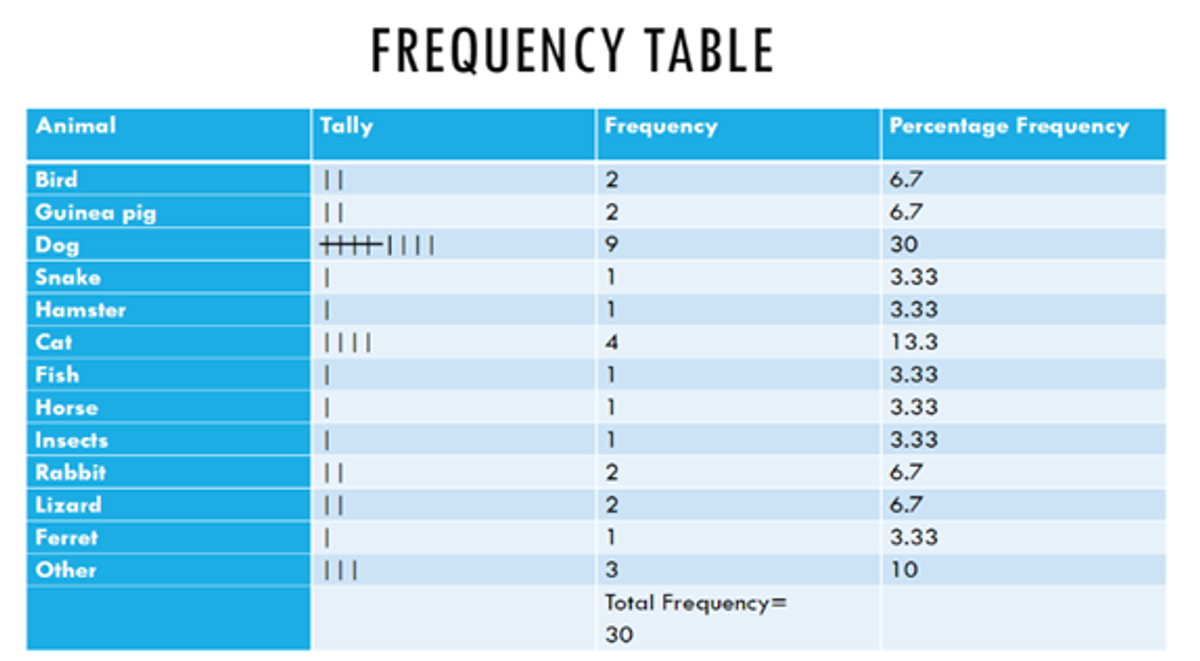
Natalie: The question surveyed was the favourite pet of 8G students. The finding showed the dog as the most popular pet followed by cat for 8G’s.
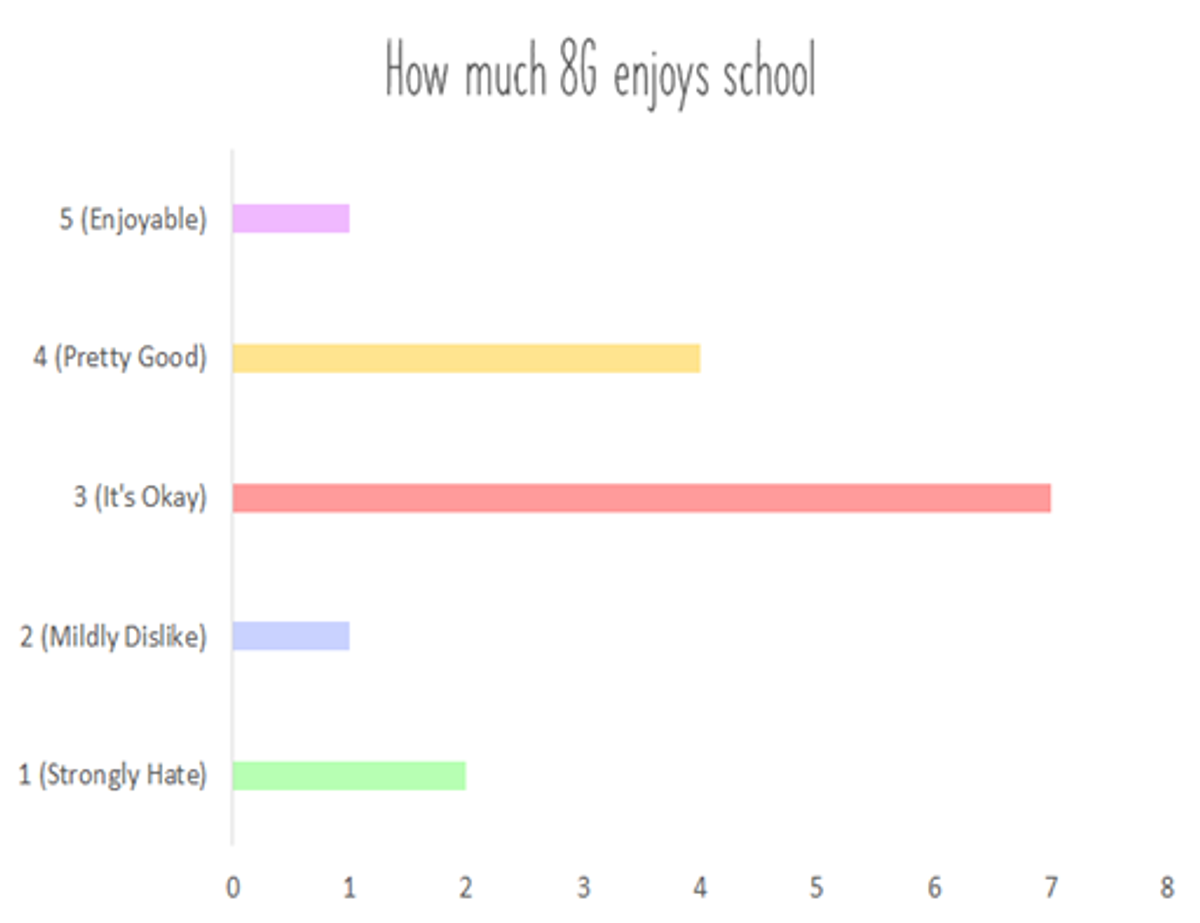
Michelle: The question "How much does 8G enjoy school?" was surveyed, with a total of 15 responses. Teachers may use this data to improve their way of teaching within classroom - make their students want to come to school every day! 7 out of 15 students decided school was 'Okay' which is equivalent to a '3/5'. Whereas only 1 student found school 'Enjoyable' but 2 didn't have a passion for school at all and responding with "Strongly Hate".
The graph depicts the varied opinions 8G has on school.
By: Katerina, Stefani, Ian, Hine, Michelle, Natalie, Mila, and Naomee
Teacher: Ms Chahal