
2019 Student Survey
2019 Student Attitude to School Survey.
On Wednesday morning we received the State-wide Comparison report for the Student Attitudes to School Survey from the Department of Education. We received preliminary data results at the end of July which overall indicated improvements in positive responses from students and so we were eagerly awaiting the this follow up report which compares our results to all secondary schools in the state.
We improved in 18 out of the 19 Factors compared to 2018, this follows on from improving all 19 Factors from 2017 to 2018. It is heartening to see such a clear indication of how students are viewing our improvement journey and I congratulate and thank all the teachers and Education Support Staff for their hard work.
Some of the specific factors we are particularly pleased about our improvements in over the past three years are:
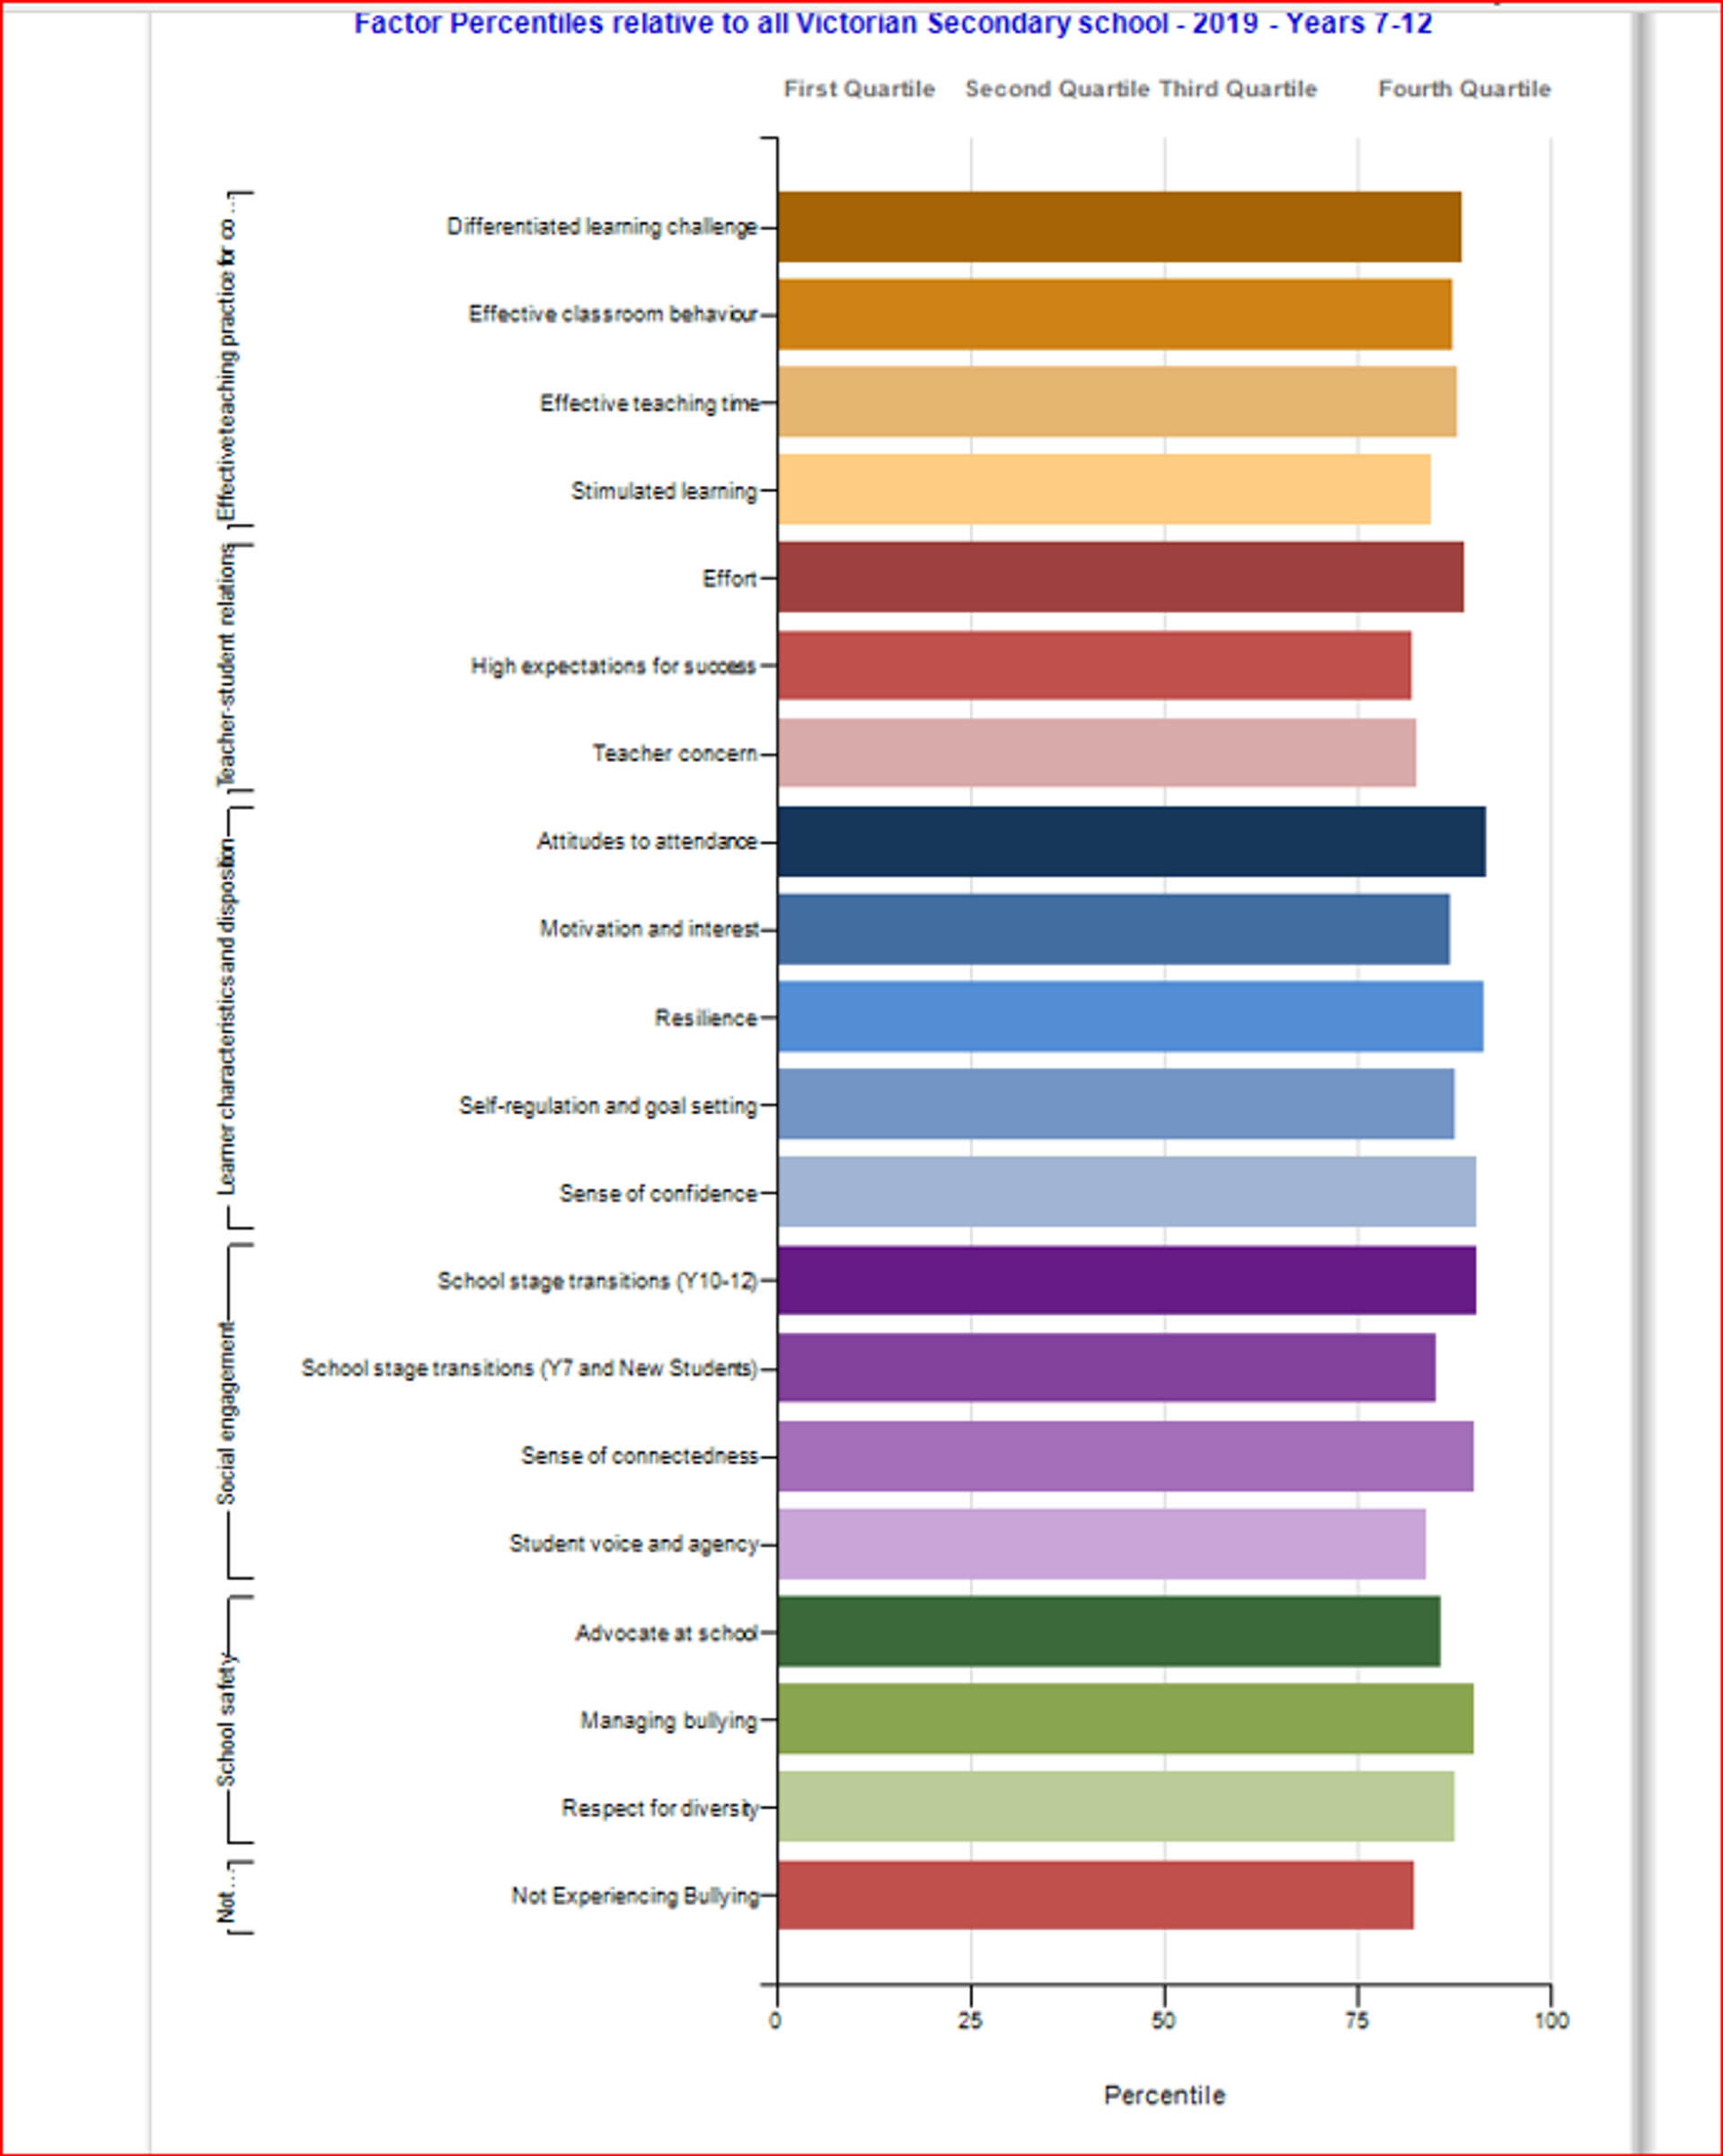
- Effort: 88.9 percentile – a 53 percentile point increase since 2017
- Sense of Confidence: 90.5 percentile – a 50 percentile point increase from 2017
- Advocate at School: 85.8 percentile – a 50 percentile point increase since 2017
- Stimulated Learning: 84.6 percentile – a 45 percentile point increase since 2017
- High Expectations for Success: 82.2 percentile – a 45 percentile point increase since 2017
- Effective Teacher Time: 88.0 percentile – a 40 percentile point increase since 2017
Other factors that we are proud of the results are:
- Attitudes to Attendance: 91.7 percentile
- Resilience: 91.4 percentile
- School Stage Transitions (Years 10-12): 90.4 percentile
- Sense of Connectedness: 90.2 percentile
We look forward to unpacking the results with the Student Voice group and receiving the Staff and the Parent Opinion Survey results over the coming months.
The graph above is the first of seven pages from the Summary Report. The full Summary Report can be accessed via Compass -> School Documentation -> DET Surveys -> Student Attitudes to School Survey -> 2019 Summary Report.