
MATHS
YEAR 8 STATISTICS PROJECT
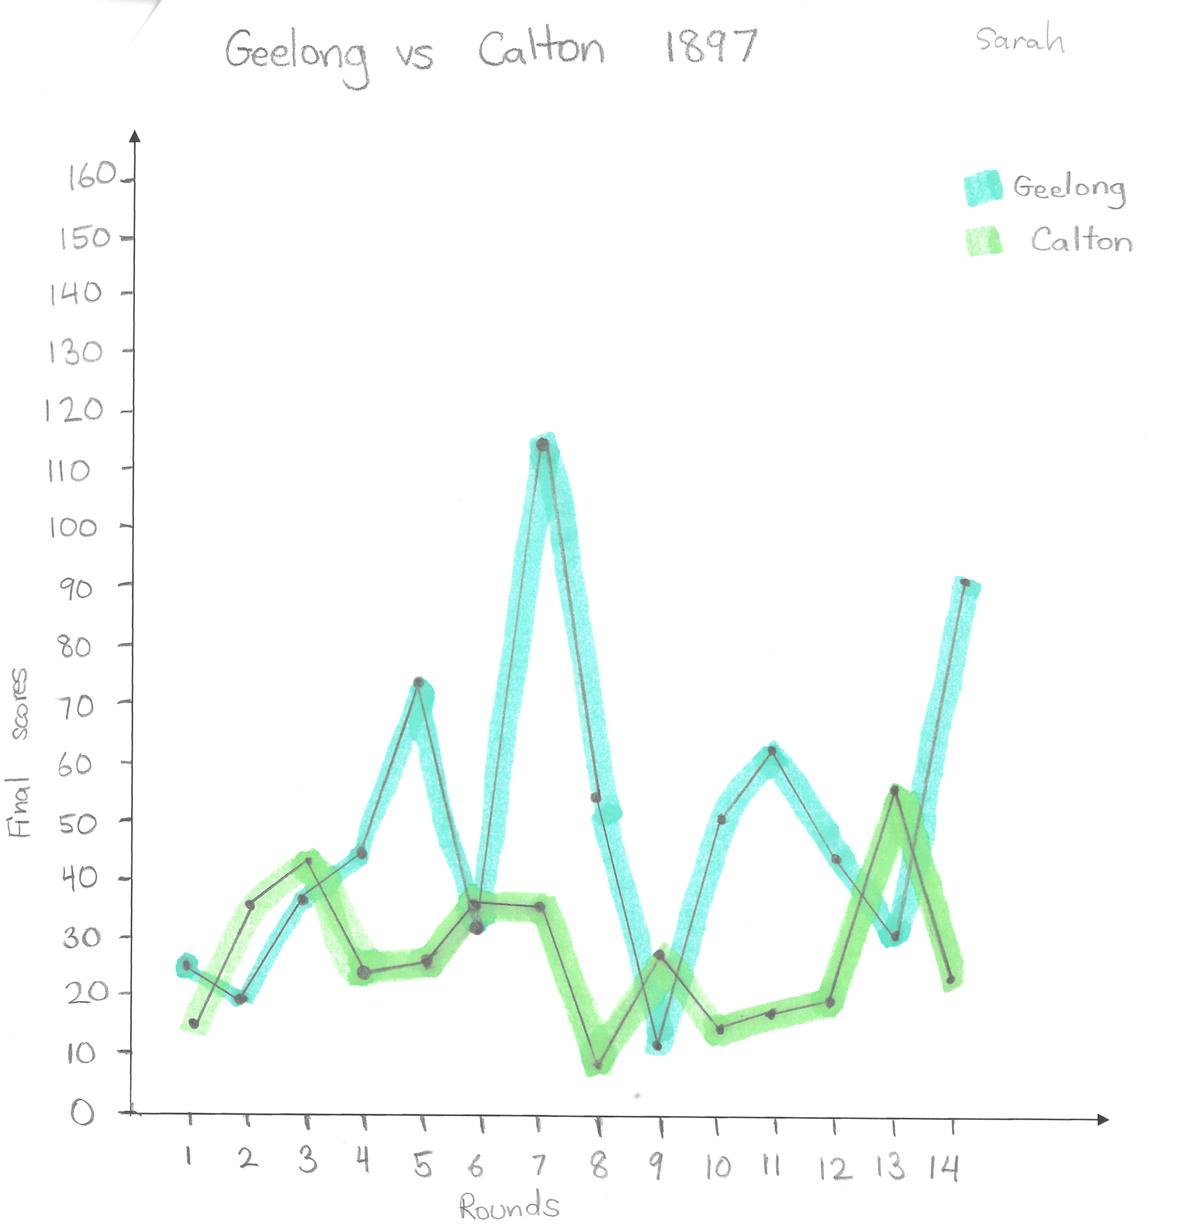
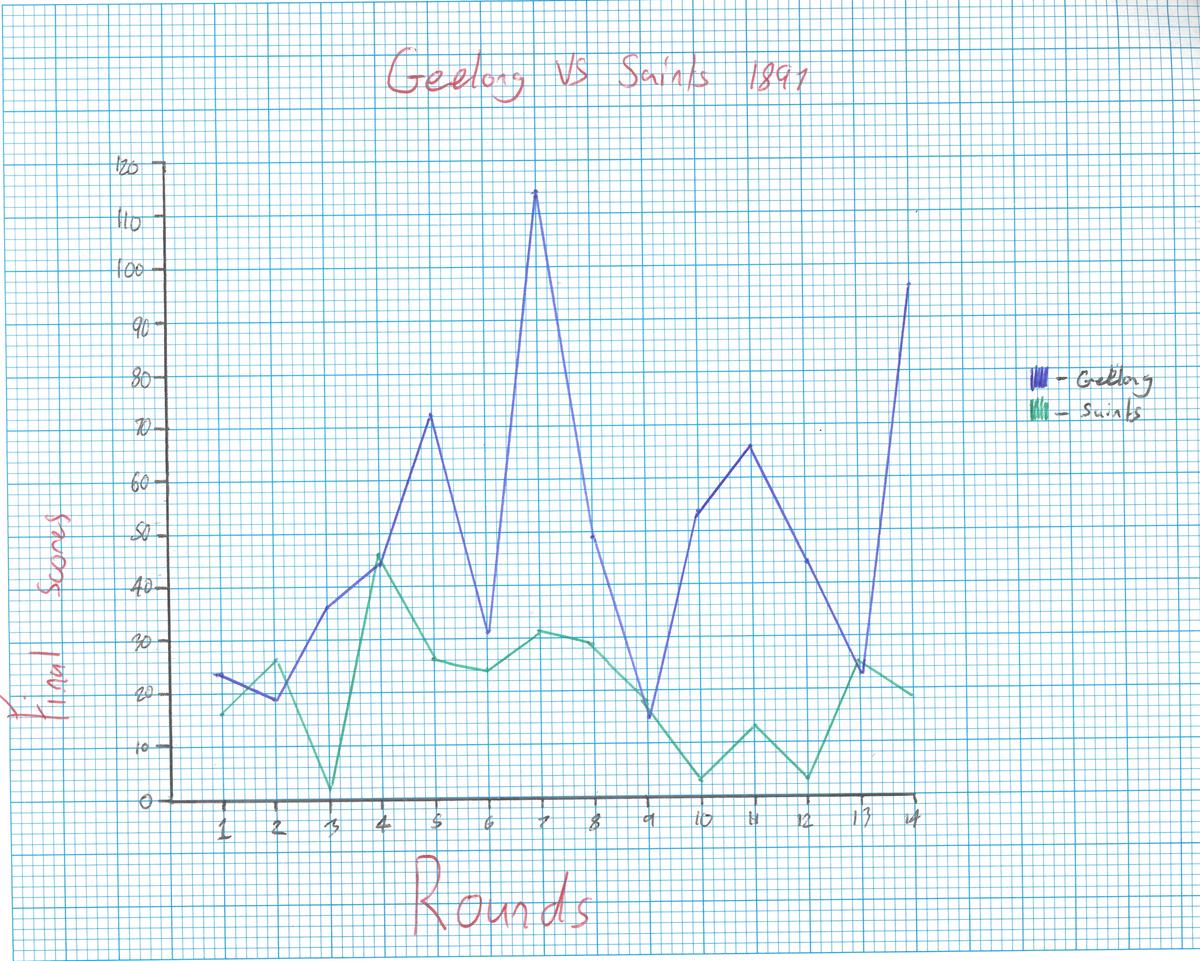
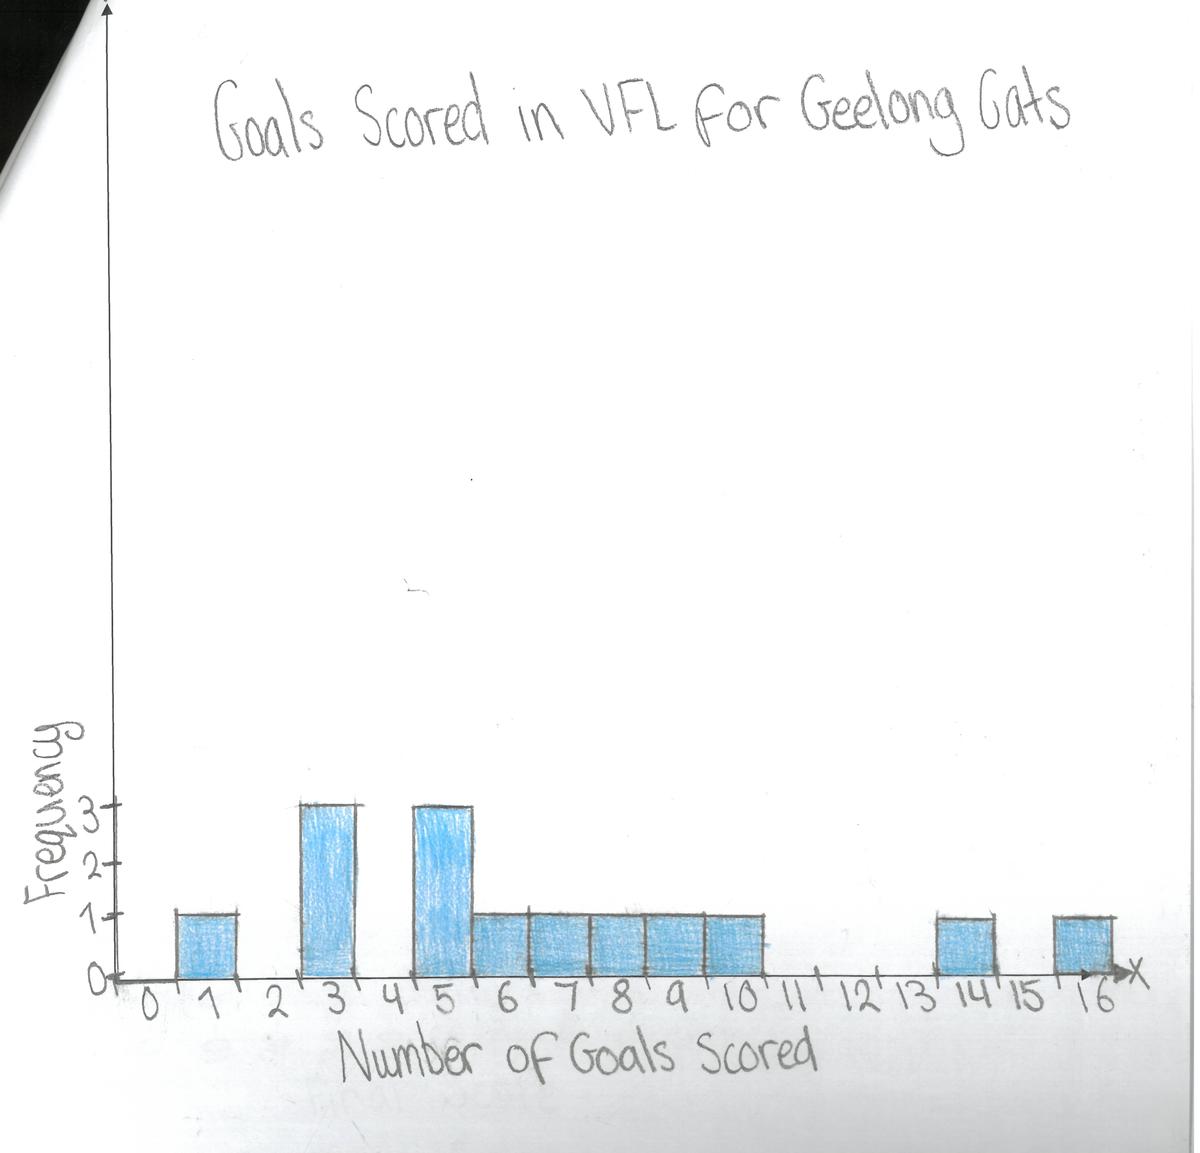
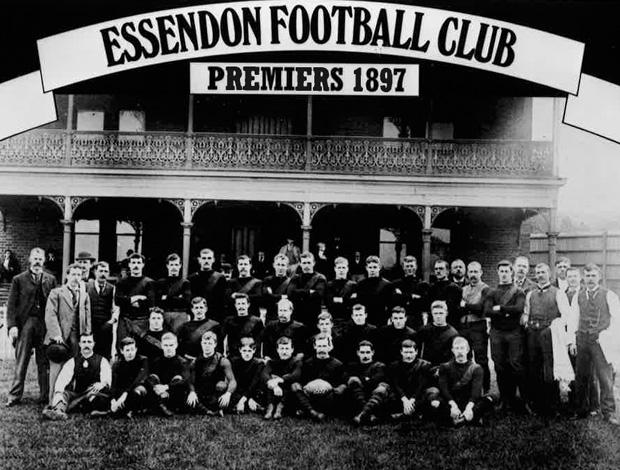
The first season of the Victorian Football League (VFL) was played in 1897, with only eight teams competing for the premiership. One of our Year 8 Maths teachers, Ms Griffingham, thought that the data from this season would make a great basis for a statistical investigation for our Statistics topic.
Students were required to select two teams from the first VFL season and collect data on their performance over 14 rounds. They were then able to conduct statistical calculations such as the mean, median, range and interquartile range to analyse the performance of their team. This allowed them to find out some interesting (and sometimes disappointing!) information about their favourite teams.
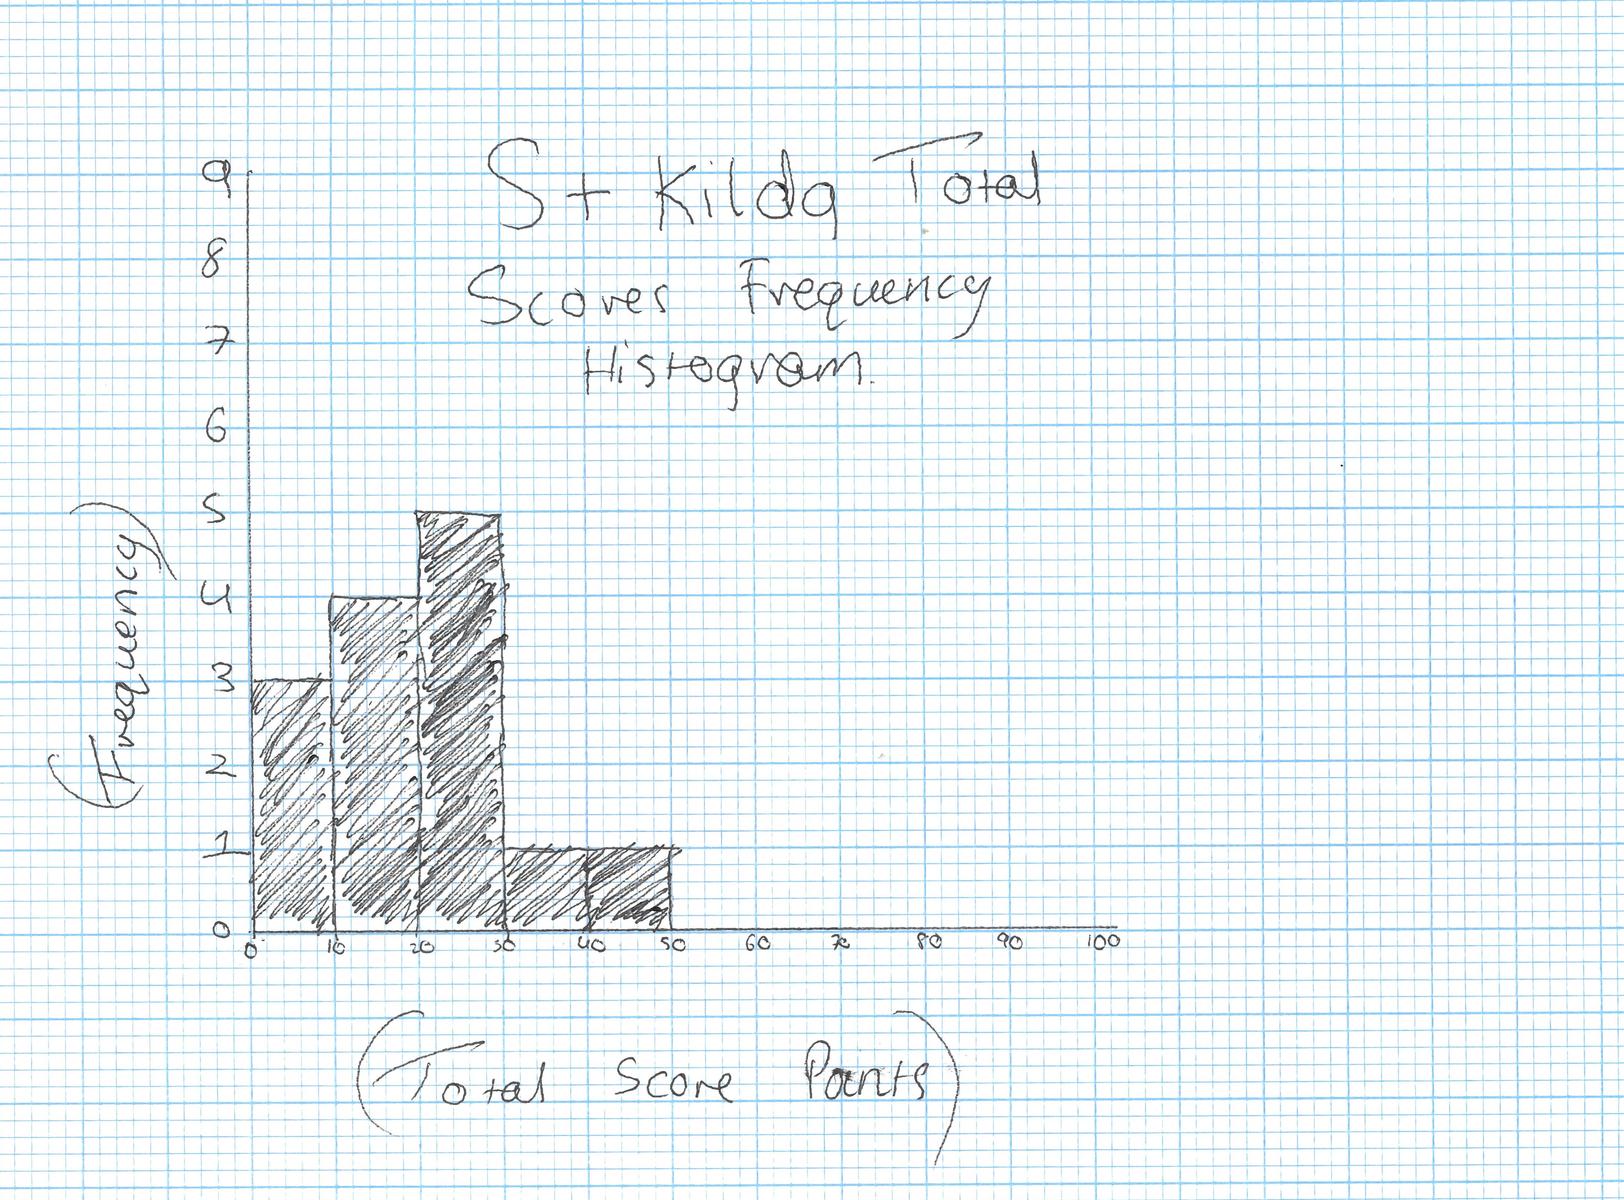
Graphs and histograms representing 1897 VFL data created by Year 8 students can be seen below, as well as some comments from students across the cohort about the project.
Natalie Little
Maths Teacher


During this investigational project I have learnt how to gather and collect data and be able to apply this information to graphs and tables. This project helped me understand the process of which data collection and statistical investigation occurs. I enjoyed creating and drawing the graphs to express the data and information in a clearer format.
Lulu Liang
Year 8C
This project really helped me realize the effort and difficulty of statistical investigation. It was quite challenging, as when I started this topic I didn't even know what a histogram was. I really enjoyed drawing the graphs, they help me to more clearly picture and understand data and look neat and tidy.
Kai Munro
Year 8C
Instead of just learning the basics of probability through the textbook questions, this project taught me how we use statistics and probability in real life experiences. I enjoyed doing the VFL scores because it was something different to what we normally do, and it showed me what sort of things people may need to do and for what reasons.
Anasia Dassios
Year 8L
Yes, this project helped me understand statistics. I learnt how to implement the frequency of scores and the mean and median into graphs. I enjoyed this because I got to study my favourite sport at the same time as well as having fun doing it.
Cayden Li
Year 8L
In this project I ended up learning more than I expected and I also believe this is a much more fun way to learn than textbook questions. I also found it cool that we did this data on sports because that made me more excited about doing it. Overall, this unit was fun and I hope that we do another project like this for Maths!
Isaac Albanis
Year 8E
This project helped me understand the process of a statistical investigation because now I know how it works. I learnt how to graph and record scores from VFL games. I enjoyed doing this project because I love watching AFL, and seeing the VFL scores, the ladder and what teams played back then and to see how good they were.
Peter Kats
Year 8O

Lulu Liang
Kai Munro

Anasia Dassios

Cayden Li

Isaac Albanis
Peter Kats
Lulu Liang
Kai Munro
Anasia Dassios
Cayden Li
Isaac Albanis
Peter Kats