Mathematics

CURRICULUM FOCUS
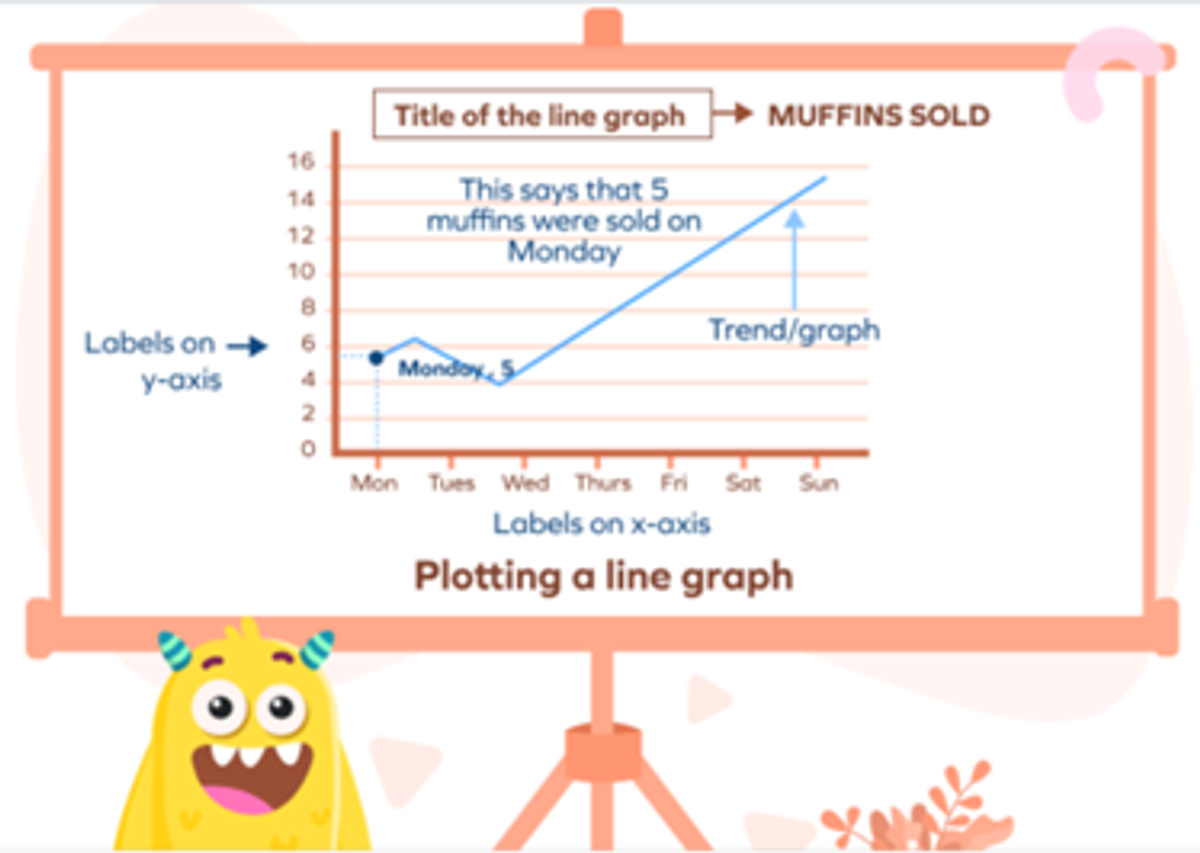
Students are learning to create line graphs.
VOCABULARY
Data: facts and statistics collected together for reference or analysis.
Statistics: The practice or science of collecting and analysing numerical data in large quantities.
Graphs: A diagram showing the relation between variable quantities, typically of two variables, each measured along one of a pair of axes at right angles.
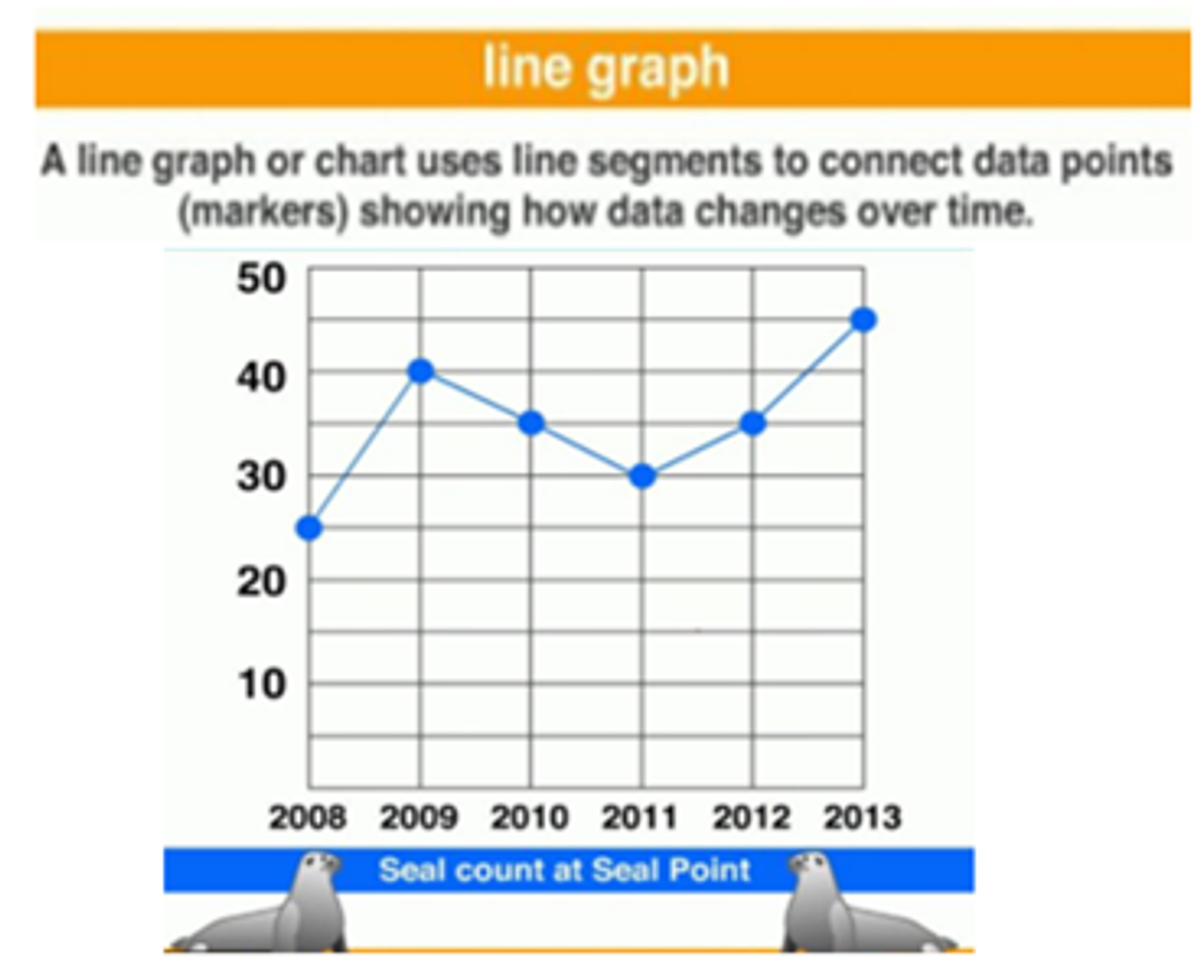
Line graph: A graphical representation of how something changes over time.
ACTIVITIES YOU CAN DO AT HOME TO SUPPORT YOUR CHILD'S LEARNING
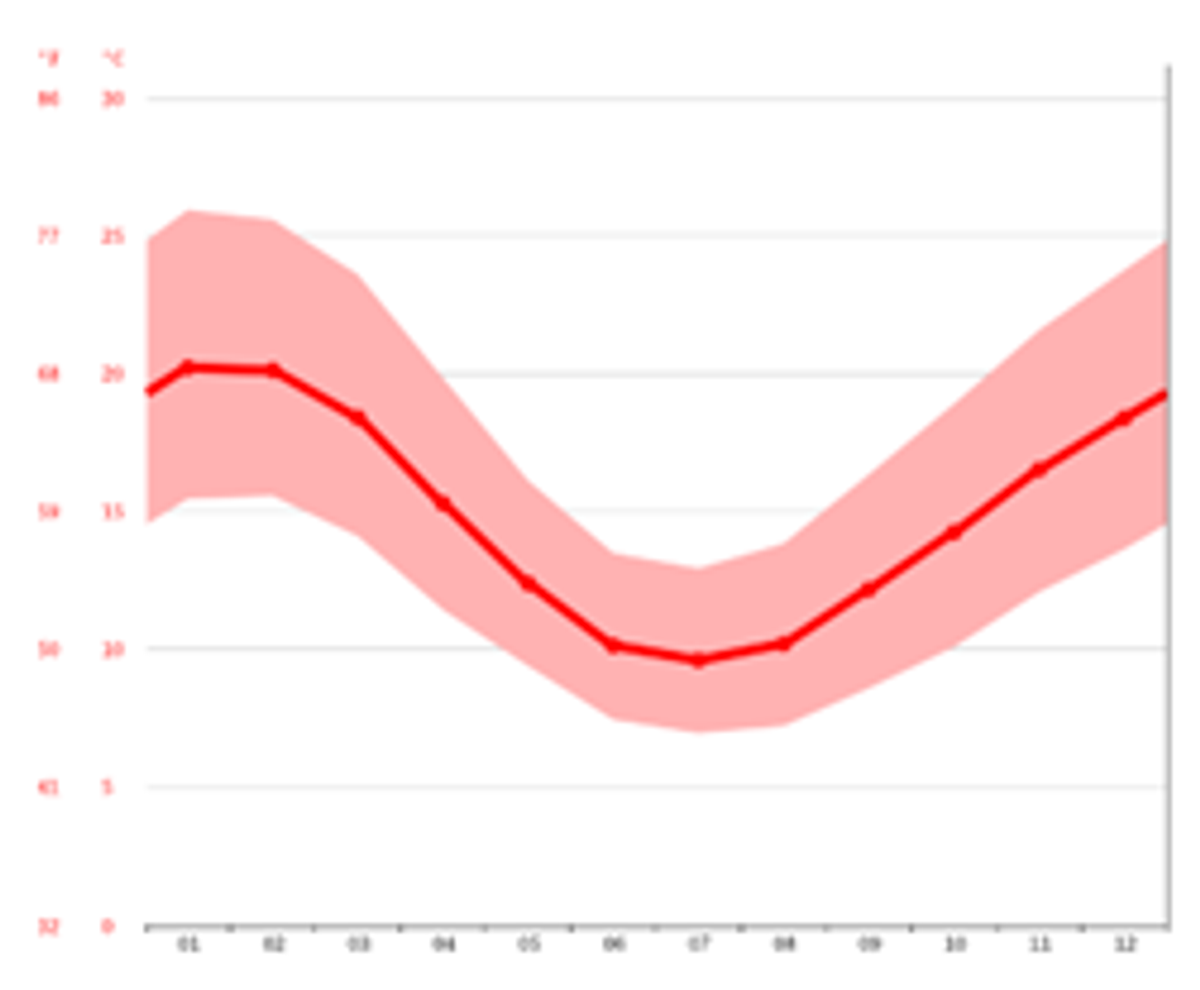
Locate a line graph of recent weather in Melbourne. Have a discussion with your child about what the graph is showing them. Ask them to label the x- and y-axis.
Average temperature in Melbourne.