
MATHS
YEAR 8 – STRAIGHT LINES PROJECT
In Mathematics, Year 8 began to explore graphing straight line and linear equations for the first time. The project involved creating impressions of stained glass windows by colouring in sections created after successfully graphing straight lines.
It’s an interesting project to reflect on, as it marked the waning phase of learning from home. We learned about the topic during lockdown, but assessed it during our half in-person, half at-home learning. It shows that students continued to learn and grow in radically new concepts even through adversity. Below are two samples and reflections on the project. You will notice that some students took the time to graph quadratics.
Jordan Abela
Mathematics Teacher
‘This project was based on our knowledge of straight line graphs - how to draw, label and solve them. This project taught me how to identify if the gradient of a line is undefined or equal to 0.’
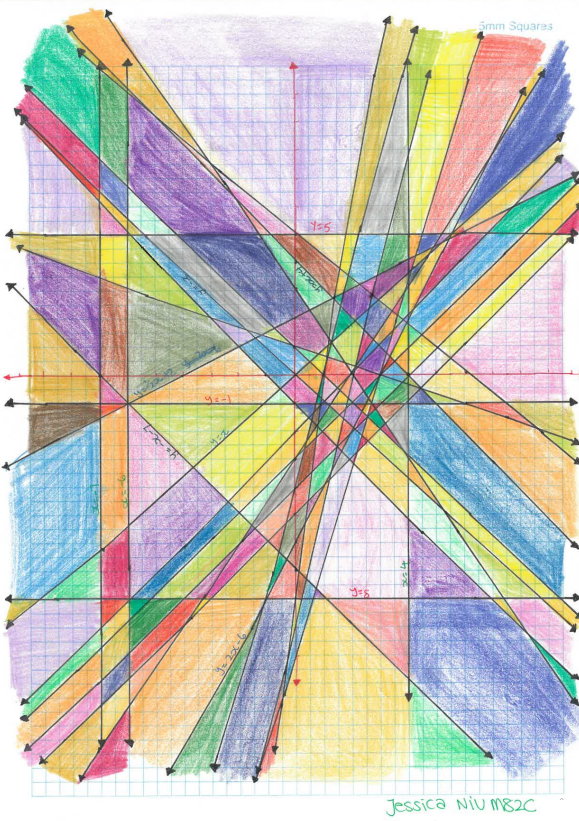
Jessica Niu
Year 8 Student
‘I thought this was a fun and interesting topic to have an assessment on and I enjoyed the task as it involved drawing and colouring which was a lot less stressful and complicated compared to a test.’

Dorothy Du
Year 8 Student
YEAR 9 DATA ANALYSIS PROJECT
After acquiring knowledge about Probability and Statistics last term, Year 9 Maths classes completed a Statistics project in which we had to choose a topic we are passionate about and conduct surveys before creating graphs and analyzing trends within the collected data.
After Melbourne’s extended periods in lockdown, I became inquisitive of how my generation manages their finances, especially after witnessing an international recession. Furthermore, I reflected upon my own financial practices and questioned how they compared to that of my peers.
I consolidated all these queries to create the essence of my project:
Teenager Spending Habits
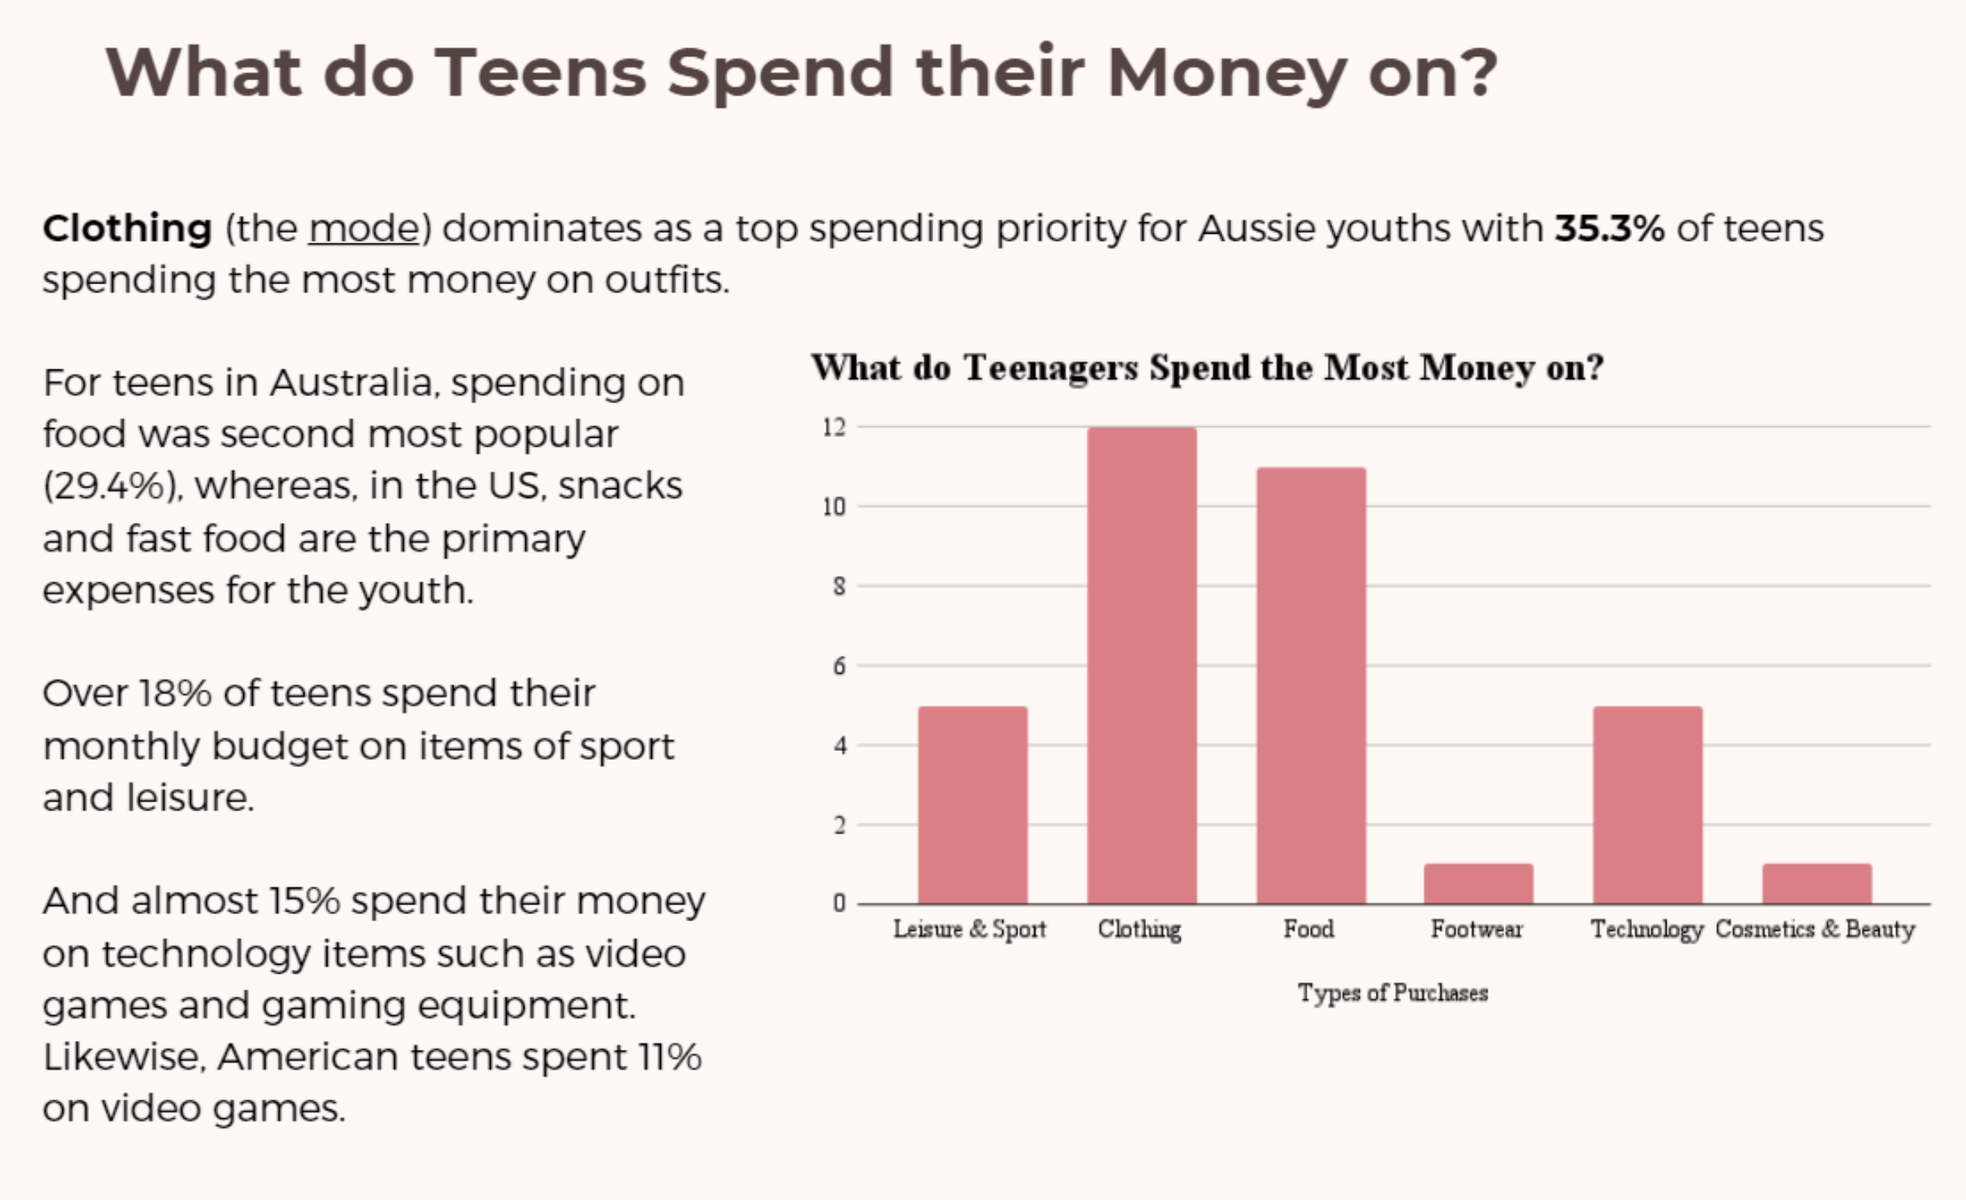
A snapshot of Ruhani's Maths Project: Aussie Teenager Spending Habits
After establishing my project’s topic, I put together a google form to send to my classmates as well as other teenagers, to collect data. I asked questions such as:
- “What do you spend the most money on?’
- “How much money do you spend in one month?”
- “How do you get this money?”
- “Are you saving money for future use?”
and a few more similar questions to understand Generation Z’s spending practices. Additionally, while creating this google form, I encountered a website examining American Teenager Spending Habits and considered that it would be especially intriguing to compare my data focusing on Aussie Teen Spending, with Teens from the US.
Following my data collection, I organized said data into graphs to analyze trends and compare statistics. Finally, I put together my project on Canva, in the form of a newsletter article, as if I was reporting the comparison of Australian Teenager and American Teenager Spending Habits.
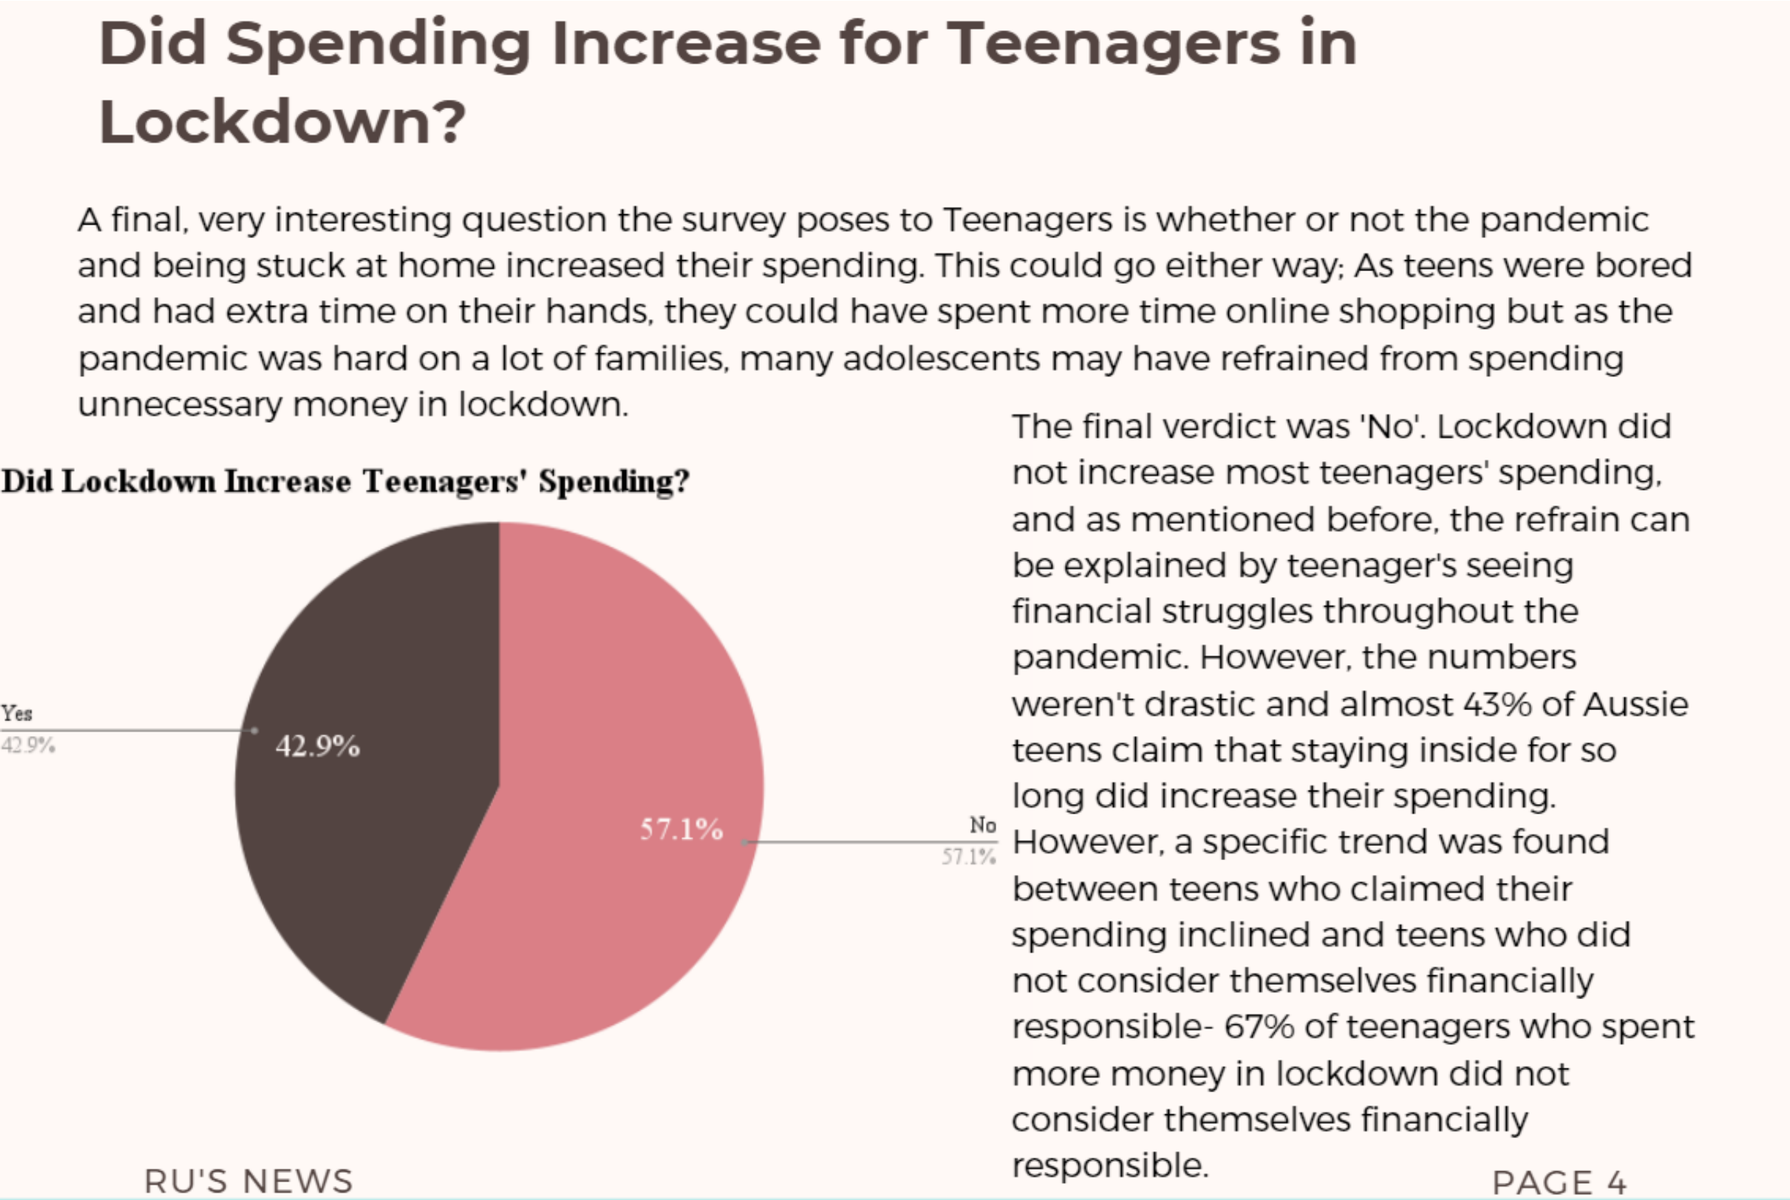
The Conclusion to Ruhani's Maths Project
Overall, this task taught me how to analyze trends and compare data as well as create graphs and charts through Google Spreadsheets. Moreover, this assessment taught me how I would be able to the statistics and probability knowledge that we are taught practically.
Ruhani Sabnani
Ruhani Sabnani
Ruhani Sabnani
Year 9 Student