
Attendance
How We're Tracking So Far
Attendance
How We're Tracking So Far
As we reach the end of Term 1, it is a great time to reflect on how attendance has tracked, not just in 2023, but compared to previous years.
The graph below shows the average attendance each week in 2023 (the solid blue line) compared to 2022 (the dashed red line), 2021 (the dashed yellow line) and 2020 (the dashed green line). The solid purple line indicates 90% attendance, which is the minimum expected attendance for students at the College.
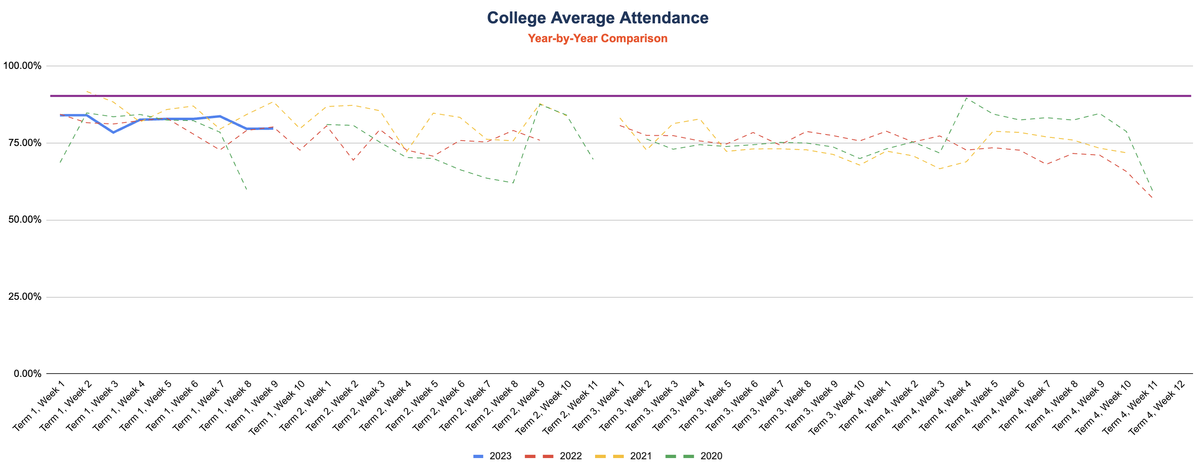
The remote learning periods and lockdowns are evident during the Covid-affected years of 2020 and 2021, with attendance dropping upon the announcement of a lockdown, and rising in the first weeks of returning to on-site learning. During the remote learning periods, attendance steadily dropped each week until students returned on-site.
Anthony Asta
Acting Assistant Principal - School Operations