Mathematics News
Data Representation - Graphing in Year 3E
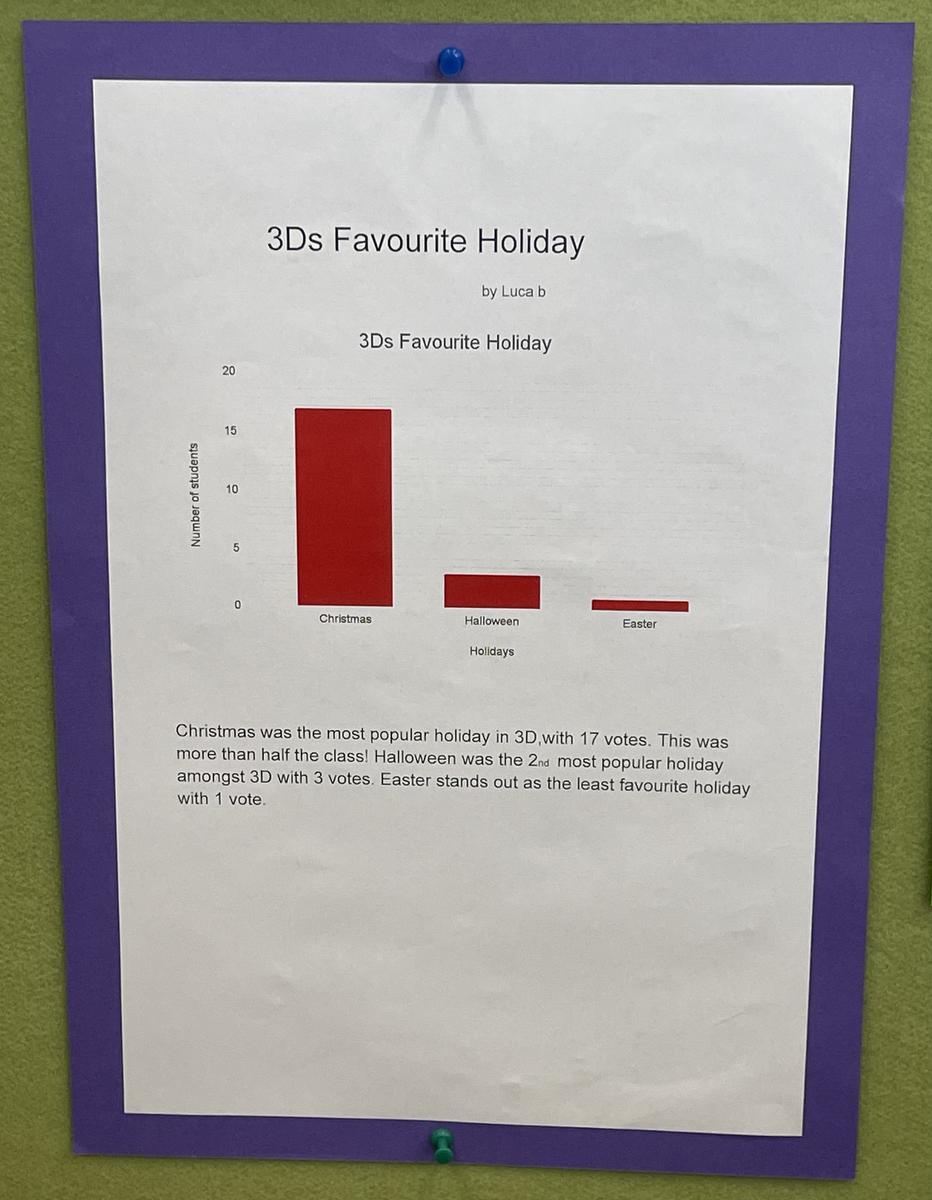
Over the past couple of weeks year three have been learning about creating graphs for data representation. First we learned about bar graphs, then made our own ones on paper after surveying the class.
We picked a partner and the teacher taught us how to make a graph on google sheets then paste it onto google docs. After that we printed them out and stuck them onto coloured paper. We all really enjoyed learning about graphs this term.
Ivy and May, 3E