Teaching and Learning in 6M

This term the Year 6 students did a unit on Data Representation and Fractions, Decimals and Percentages. We were able to combine these two units together to create a wonderful data poster.
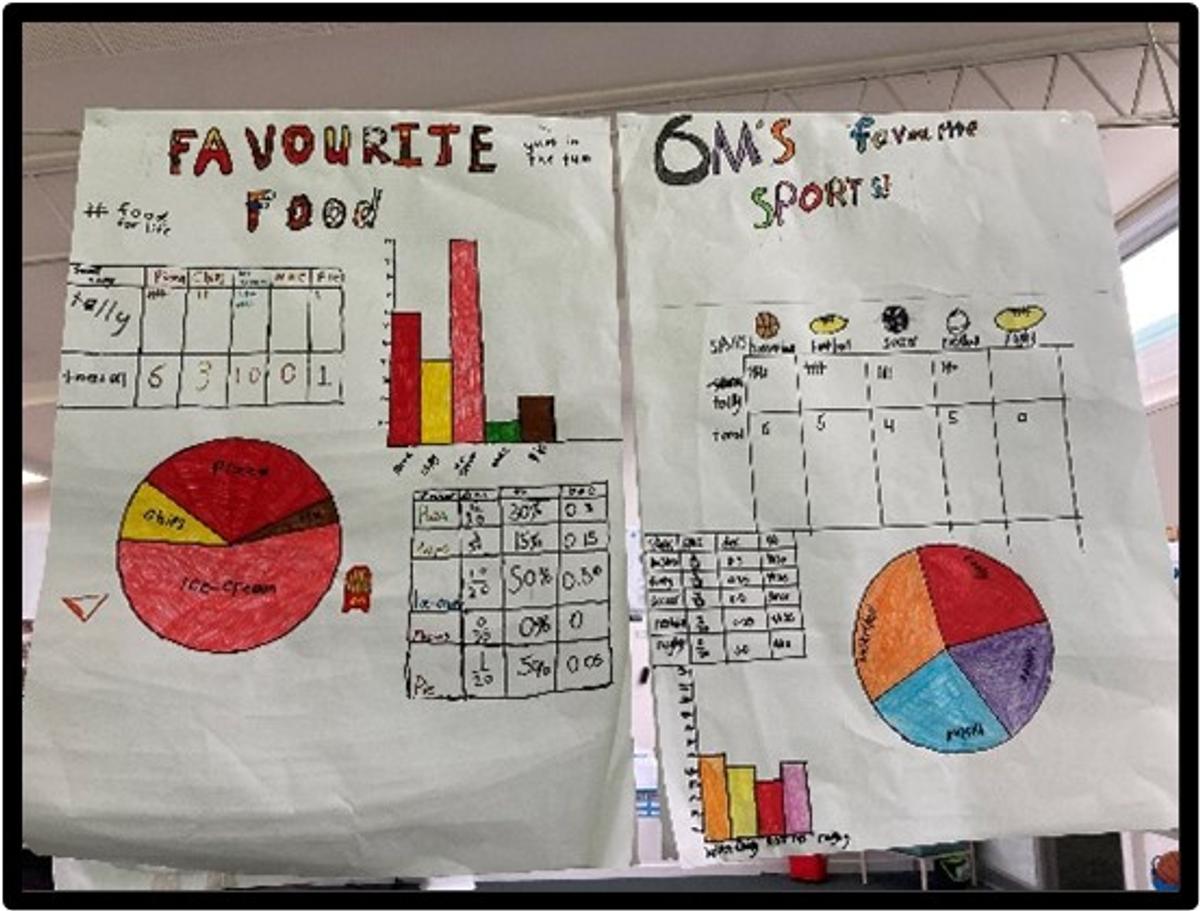
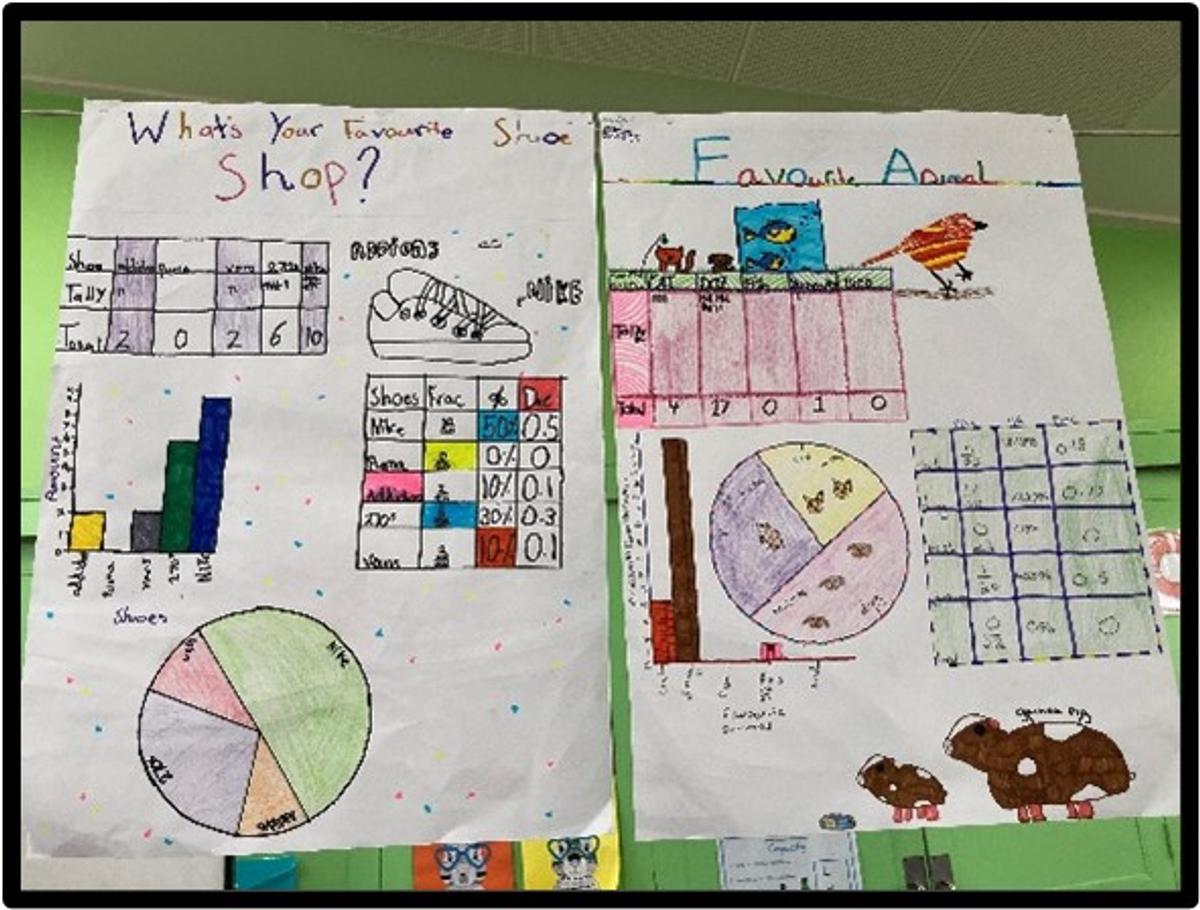
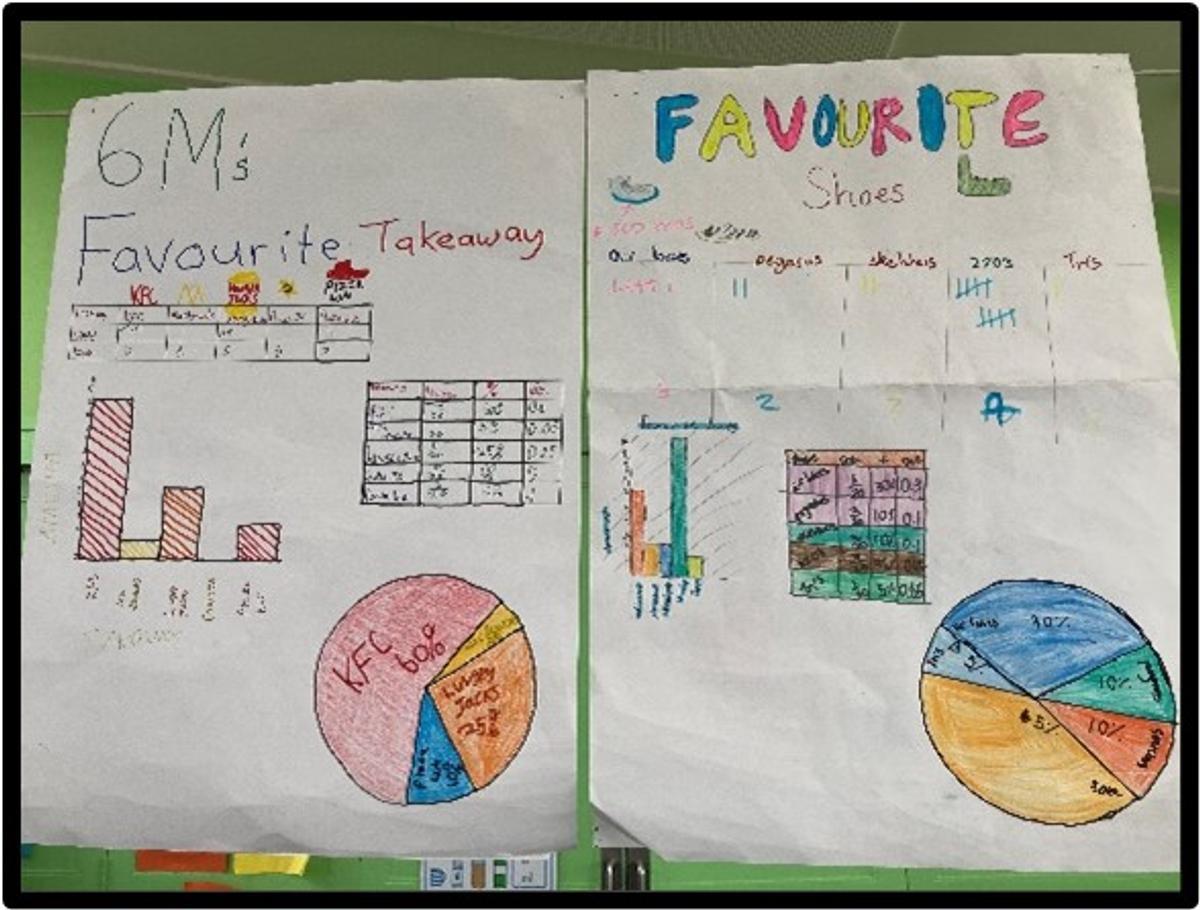
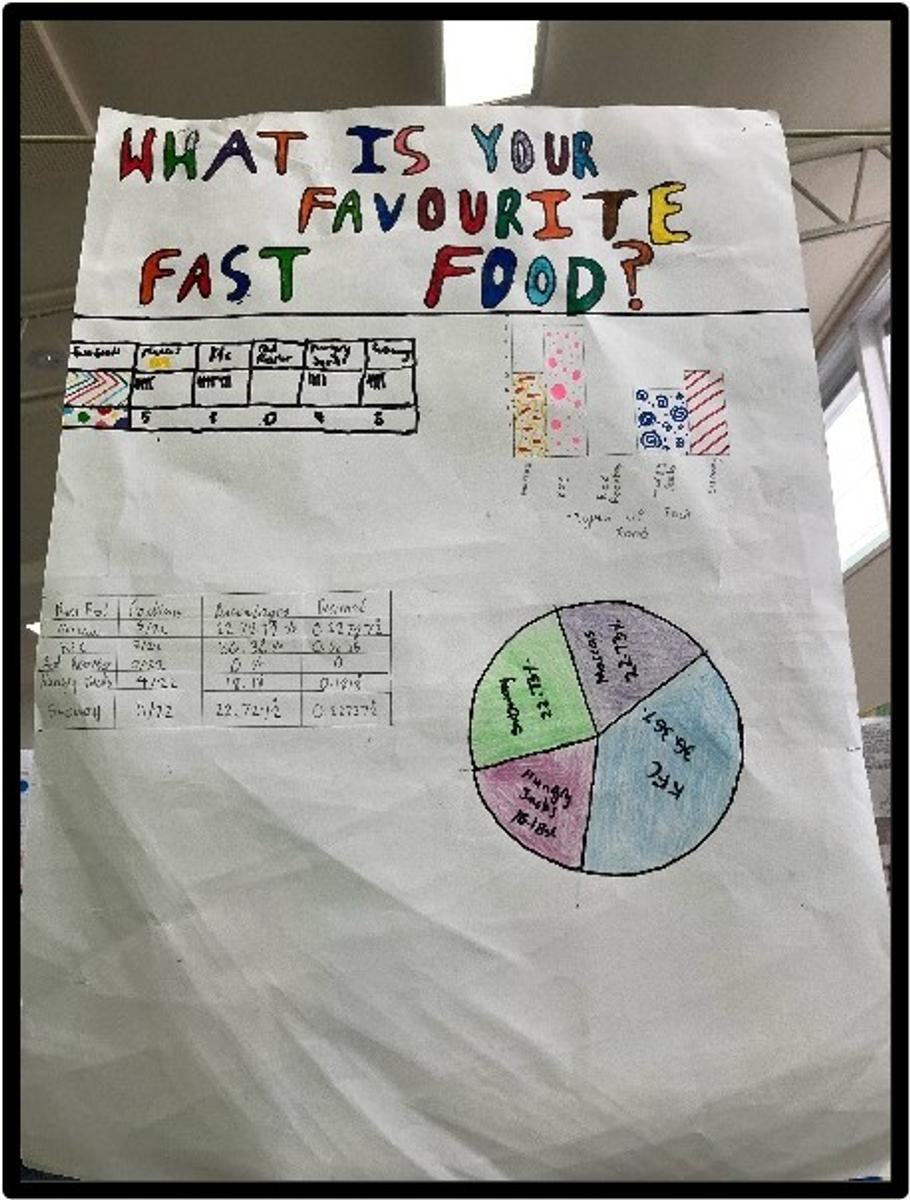
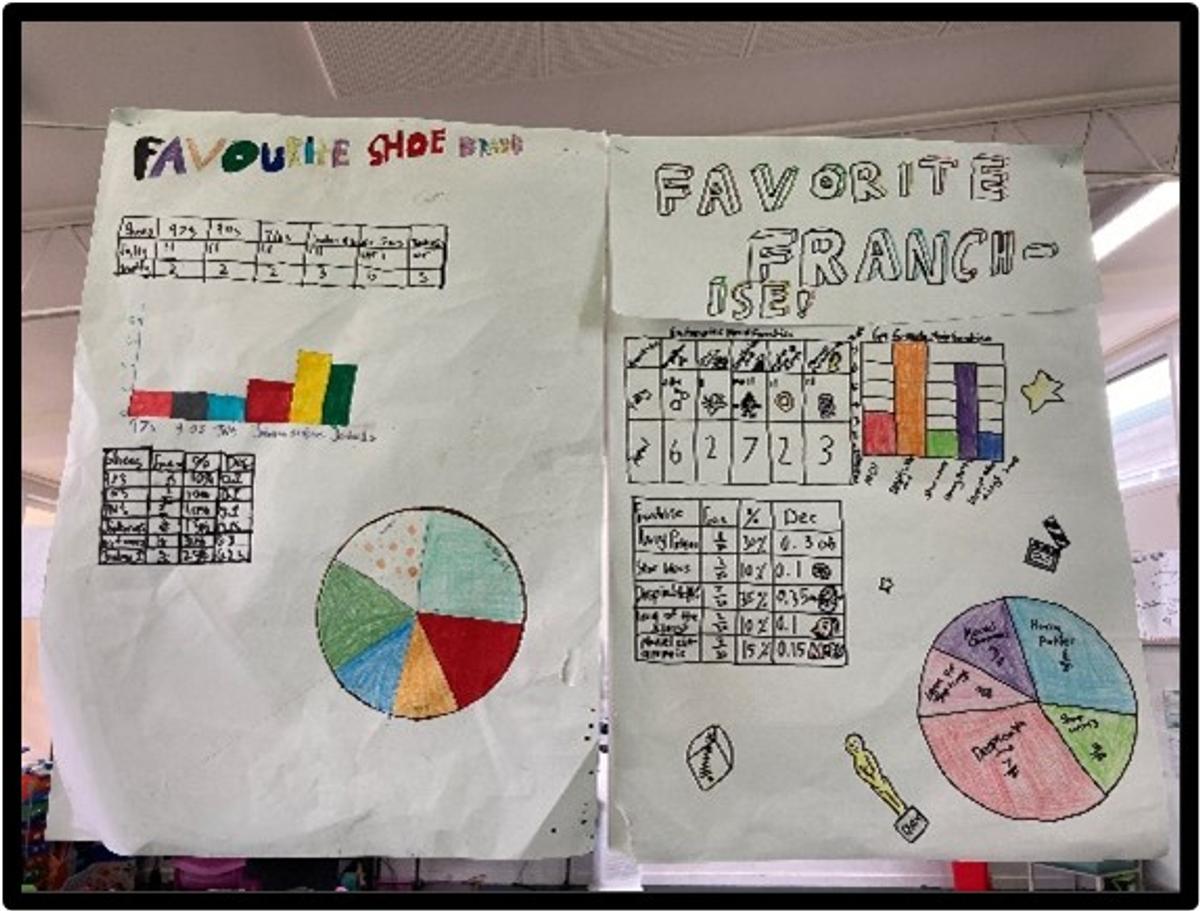
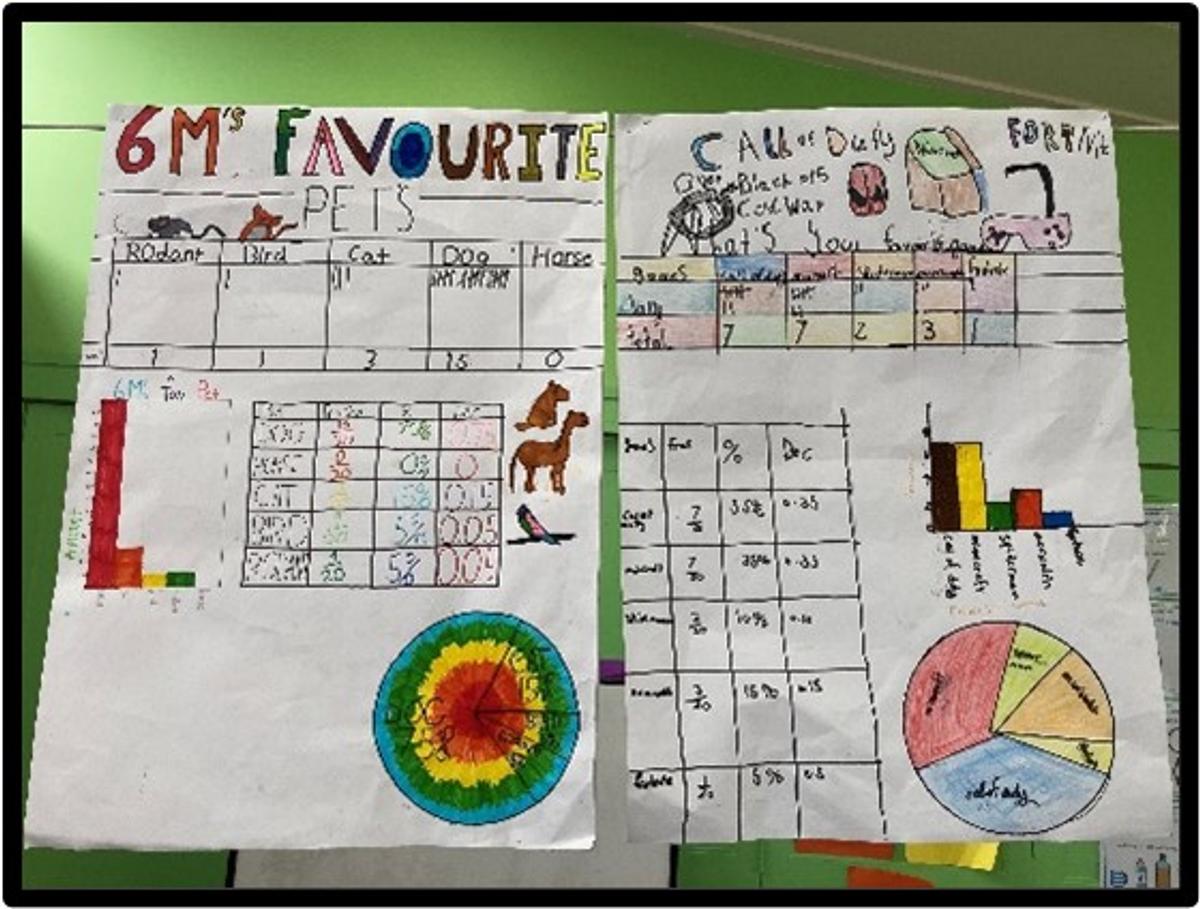
The students were paired up and had to choose a survey question. They then had to come up with their own answers and survey the class. After they had tallied up the answers they created their first graph, a bar graph, to represent their findings. We were able to incorporate converting between fractions, decimals and percentages as well and use this information to create a pie chart.
Although some questions were similar, depending on what answers they chose to include and who they chose to ask in the class meant that their data varied from group to group. It was great to see each group get creative with their posters and enjoy working with different people.