NAPLAN YEAR 7
Steve Sirrals

NAPLAN YEAR 7
Steve Sirrals
There are two types data sets shared below.
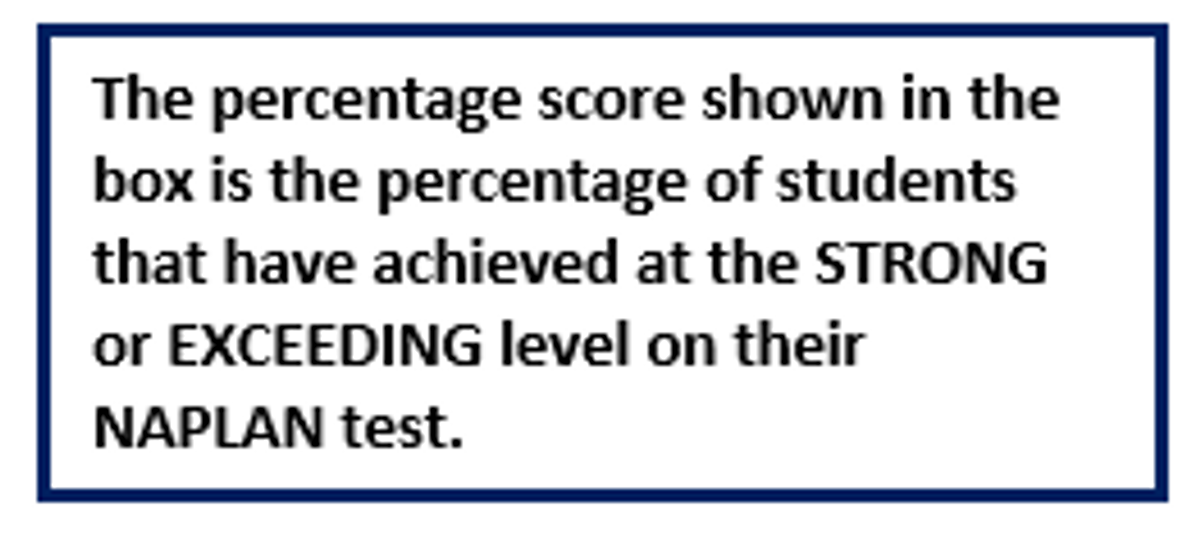
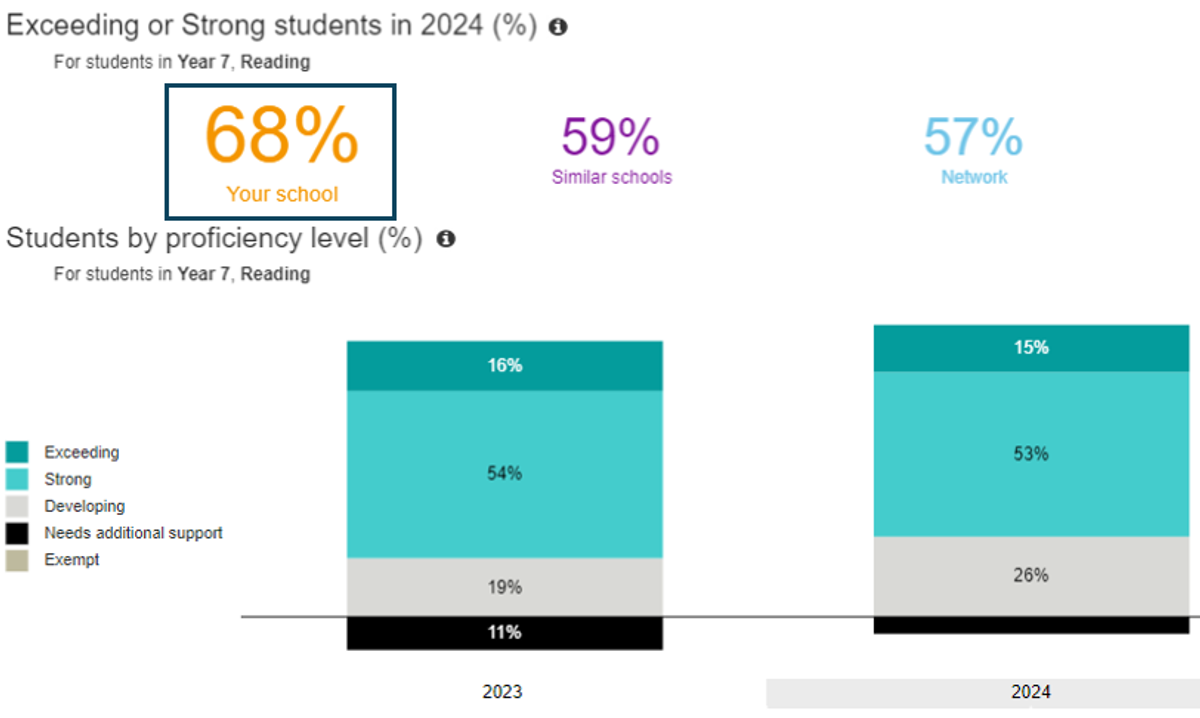
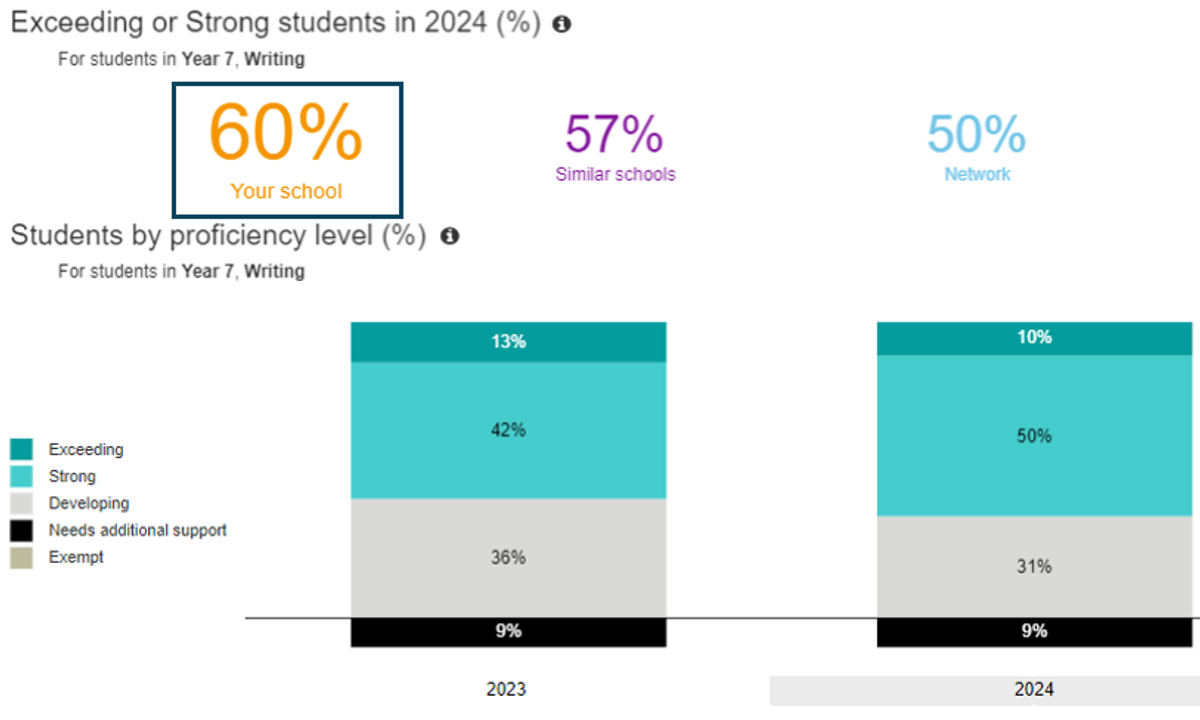
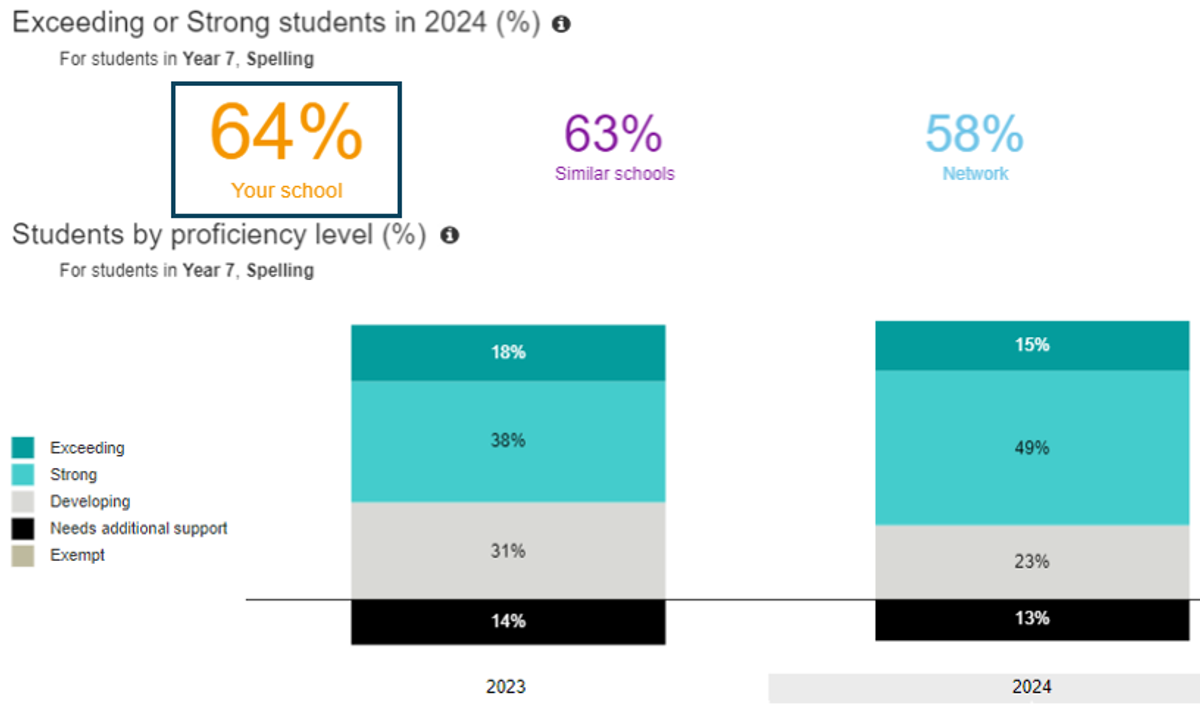
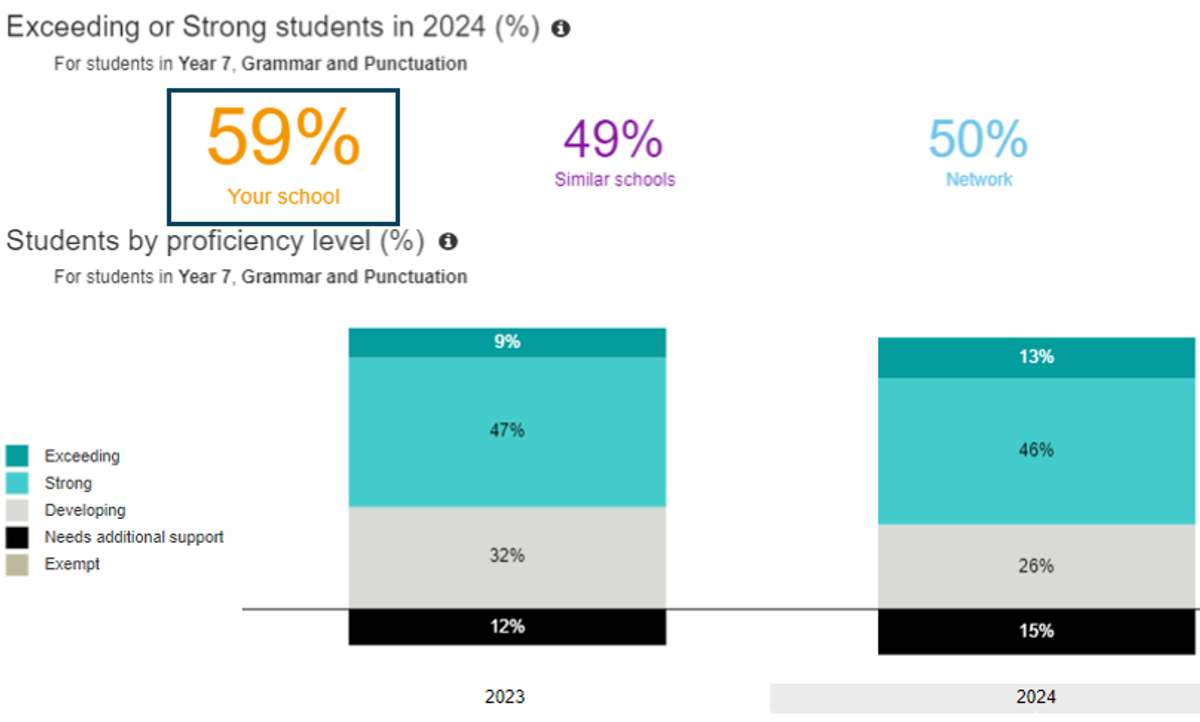
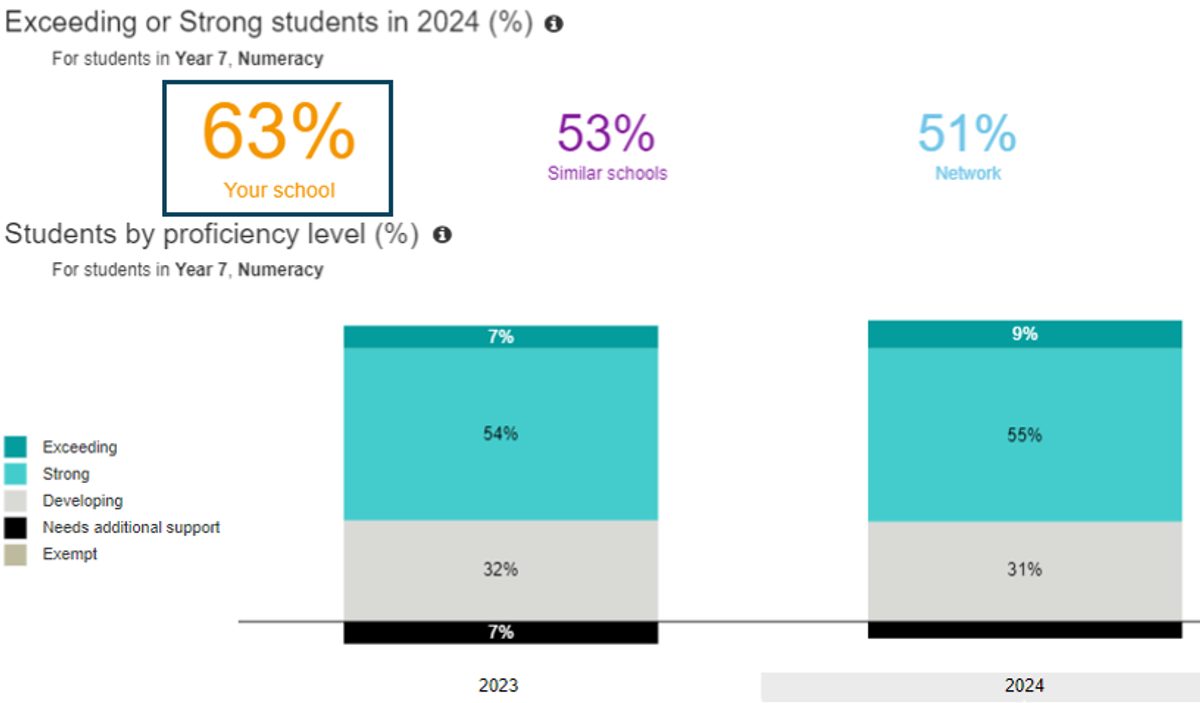
The first is the Proficiency Levels which shows the percentage of cohort achievement at 4 different levels: Needs additional support, Developing, Strong, Exceeding.

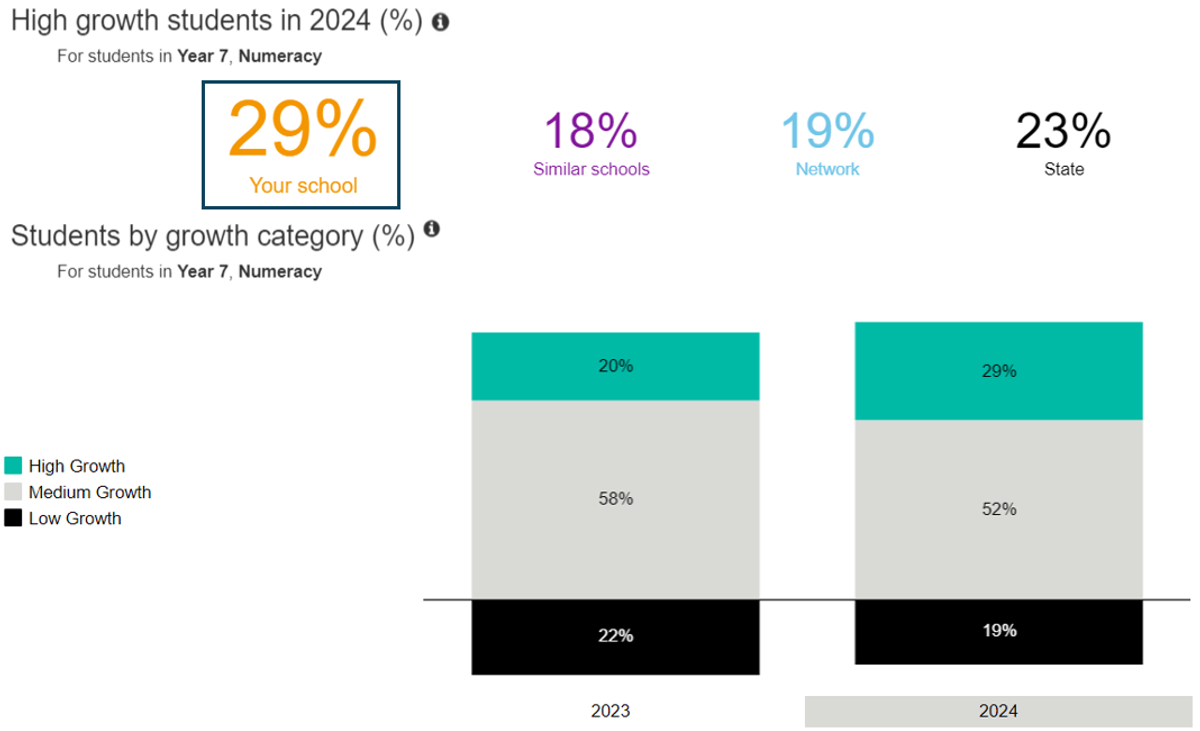
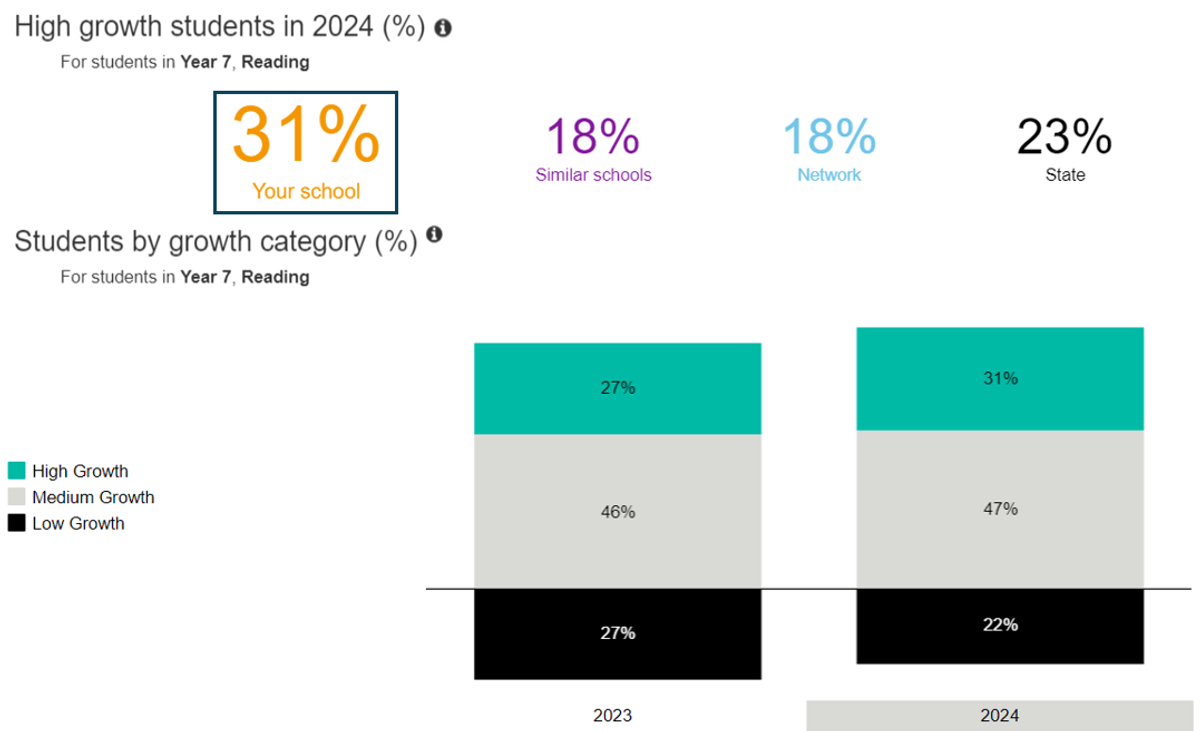
The second is the Relative Growth. The relative growth report shows the percentage of students achieving high, medium and low growth, relative to students who had the same NAPLAN score two years ago.
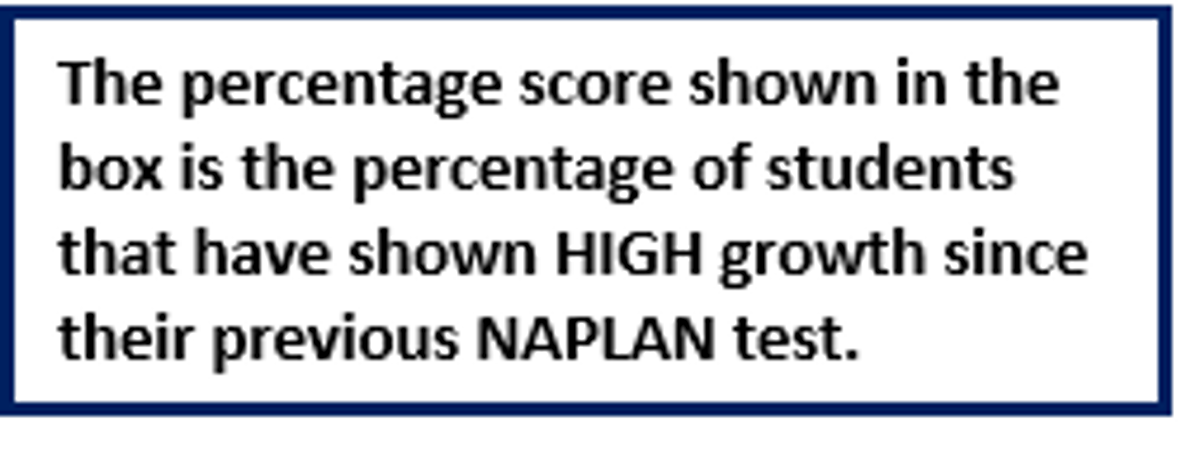

Woodmans Hill percentage is shown in comparison with Similar Schools, schools in our Network group and the State average.
The Network Group is a group of schools in Ballarat. For comparison, comparing with Similar Schools is most effective.
When presenting this data to the Year 7 cohort this week, I spoke particularly about the RELATIVE GROWTH data (the last two data sets above).
This data shows the impact of the learning that the year 7 cohort has experienced over the last two years. Whilst Year 7 students had only been students of Woodmans Hill for 6 weeks when the NAPLAN testing was complete, this data shows us that our students at Woodmans Hill have a huge potential to have significant and high growth in regards to their learning.
Our job, as educators, is to ensure that we do everything in our power to ensure that our students continue to show high levels of growth as they progress through Woodmans Hill
Year 7 Reading

Year 7 Writing

Year 7 Spelling

Year 7 Grammar and Punctuation

Year 7 Numeracy

Year 7 Reading

Year 7 Numeracy
