
Year 5/6 Bulletin

Linking Fractions, Decimals and Percentages
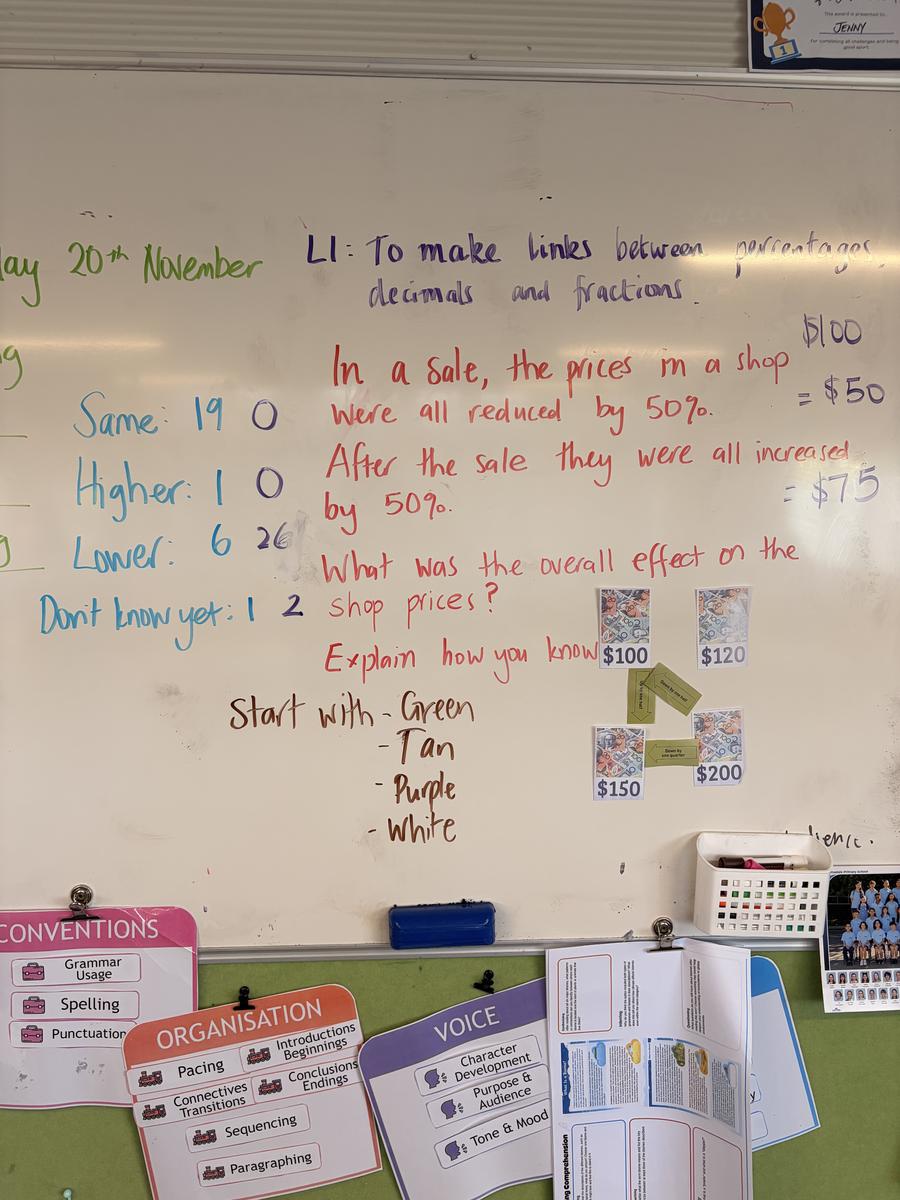
Learning Intention: To make links between percentages, decimals and fractions.
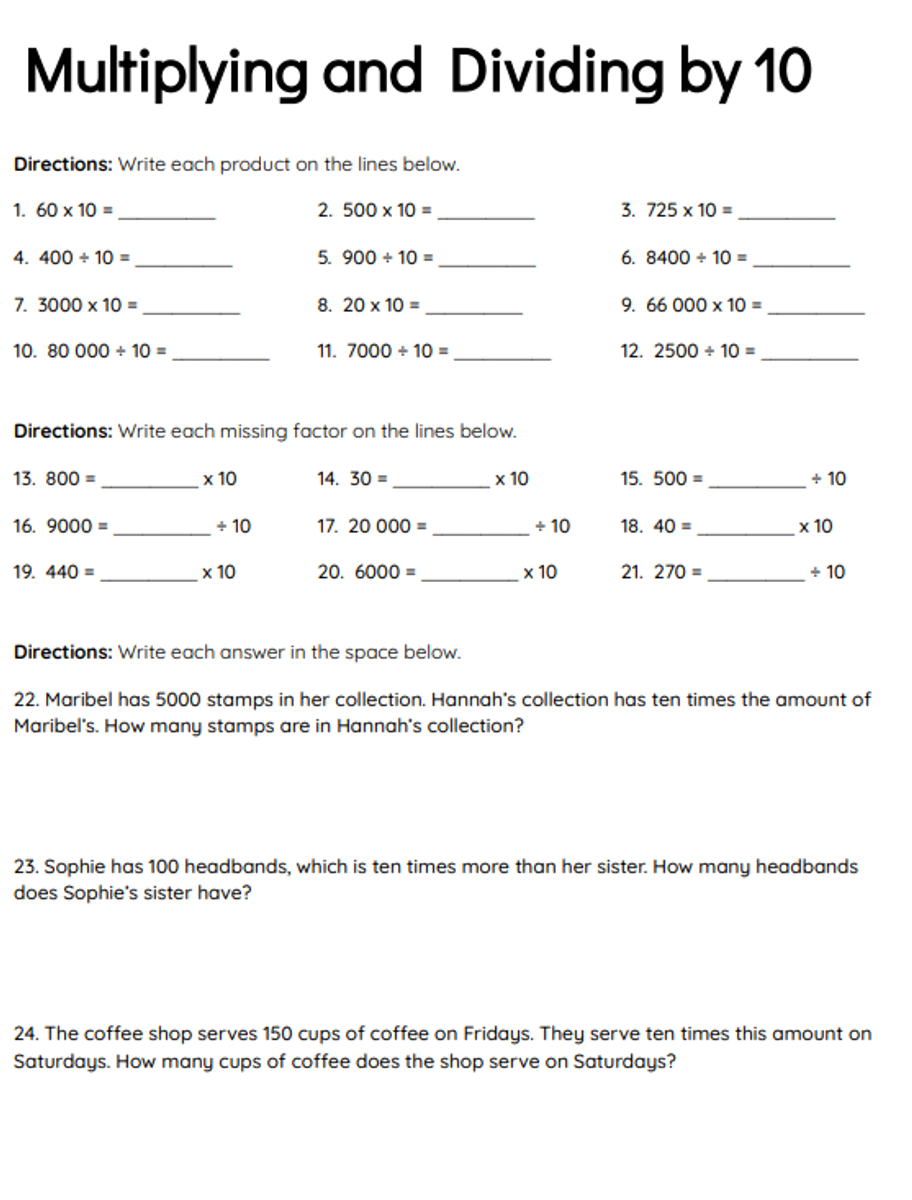
Fluency
We began our mathematics session with a fluency warm-up designed to strengthen students’ confidence in multiplying and dividing by powers of ten. Using a Multiplying and Dividing by Powers of 10 fluency sheet, students practised shifting digits to scale numbers up or down. This work supports a strong foundation for understanding decimal movement, which later helps them recognise the relationship between decimal notation and percentage values.
Whole
To introduce the main concept, students explored a challenging real-world problem:
“In a sale, the prices in a shop were all reduced by 50%. After the sale they were all increased by 50%. What was the overall effect on the shop prices? Explain how you know.”
Students first solved the problem independently on their whiteboards before voting on the outcome which was tallied:
Did the price return to the original amount?
Was it now higher?
Was it lower?
Or were they unsure?
This voting process visually demonstrated the varied initial thinking within the class.
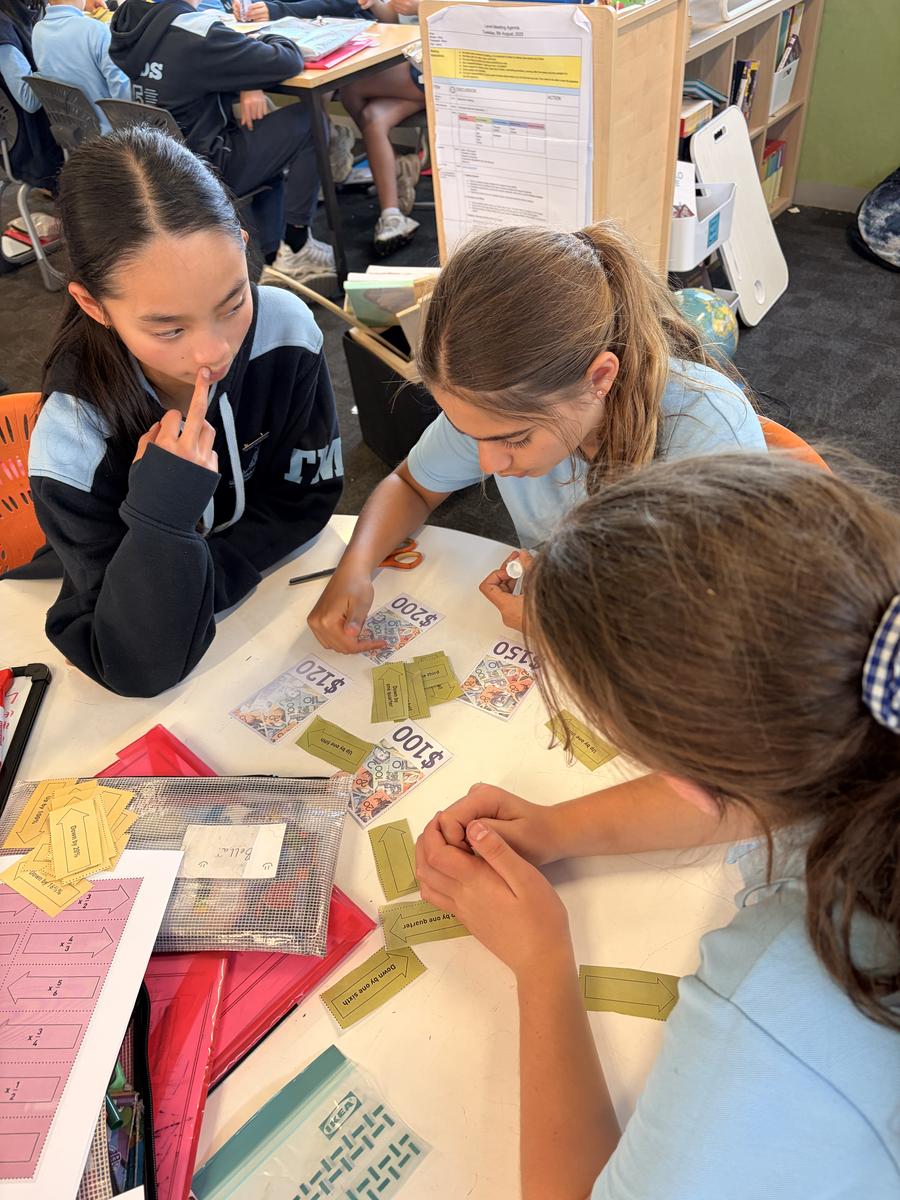
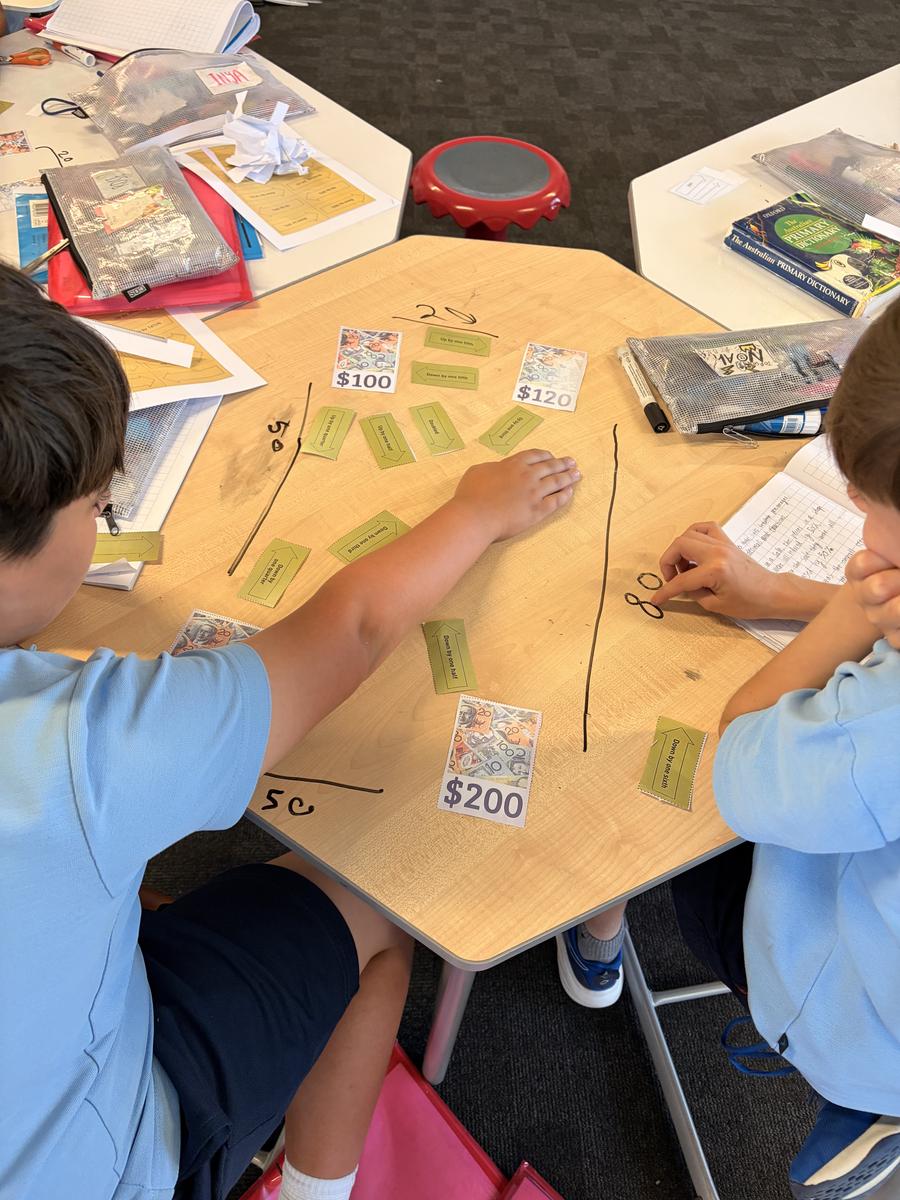
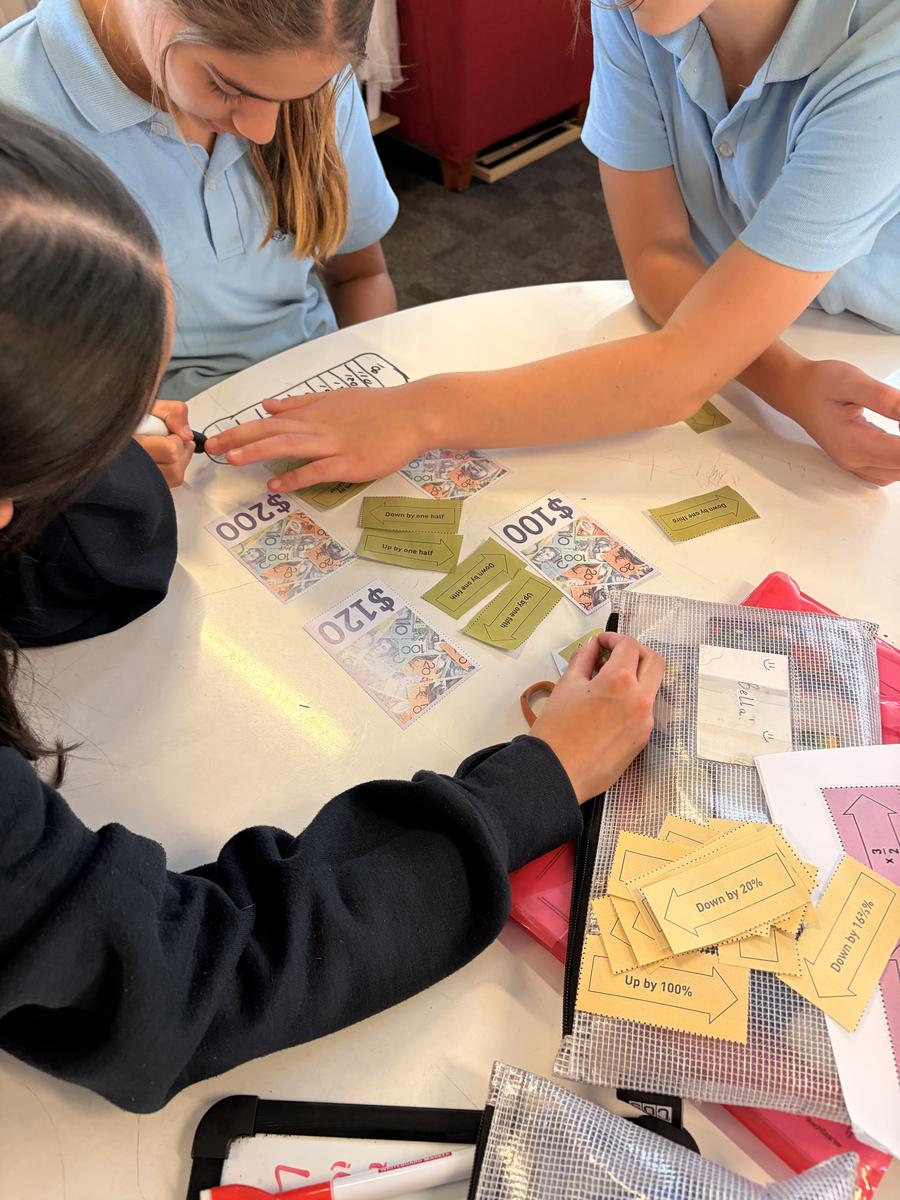
We then brought the group together for a guided modelling session. Students gathered around the focus group table, where “money cards” representing fractional, decimal, and percentage values were placed in a square. We began with the green and yellow sets of cards and discussed how each representation could connect across the square, moving horizontally, vertically, and diagonally. This allowed students to see that 50% can be expressed as 0.5 or ½ and that increasing and decreasing by the same percentage does not result in a return to the starting value. This idea of non-reversibility is a key mathematical concept highlighted in the attached resource.
Small
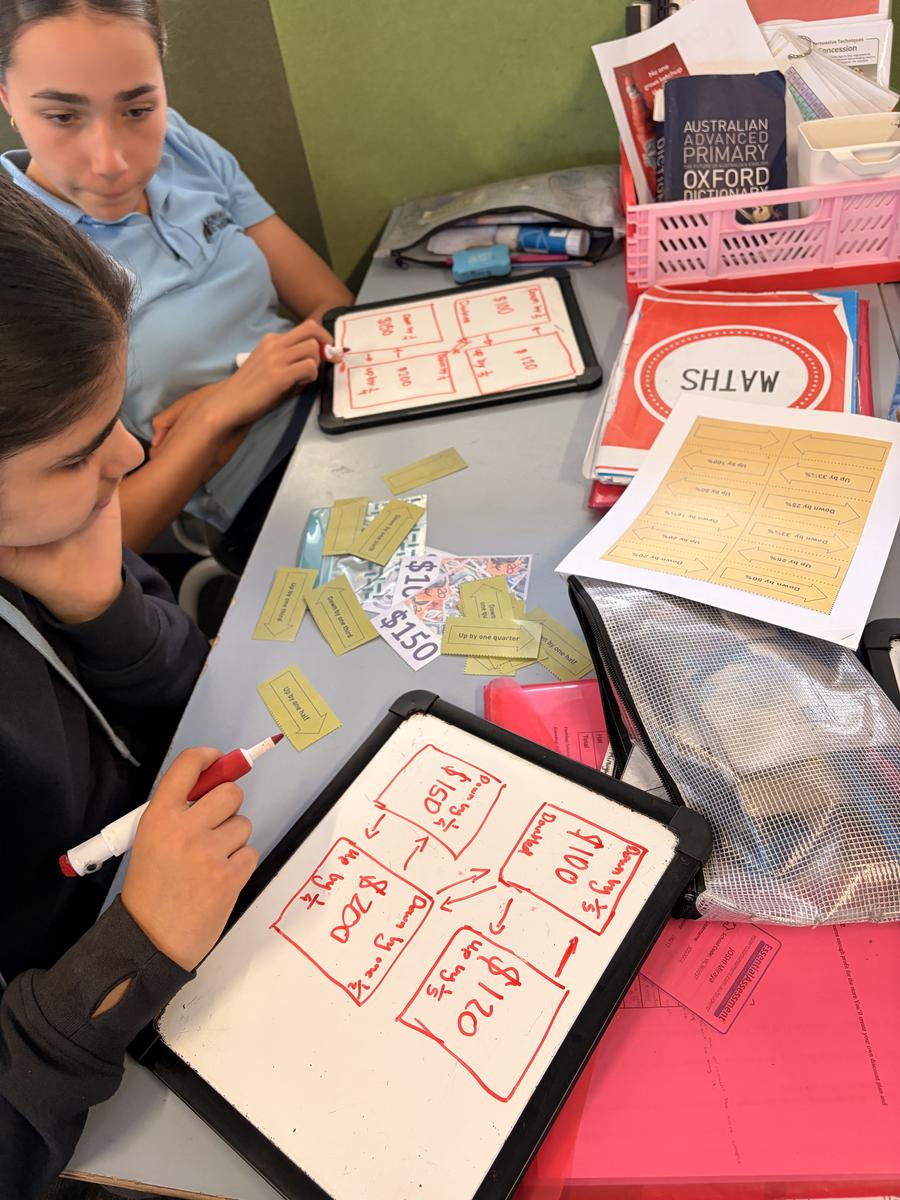
Students then worked in groups of 2–4 to apply the model to new examples.
All students used the green and yellow cards to match fractions, decimals and percentages around the money amount. Students had the enabling option of using only the green cards to focus on more accessible conversions. Those students who needed extending used the white and pink cards, which required more complex reasoning and percentage changes. This hands-on sorting task required students to reason about the size of numbers and recognise how equivalent representations help compare proportional change.
Whole
We concluded by bringing the class back together for a discussion to synthesise learning. Students shared observations about how percentages, decimals and fractions connect and described how a 50% decrease followed by a 50% increase results in a value lower than the original, an insight supported by the Percentage Increase resource. Students explained that decreasing by 50% means multiplying by 0.5, while increasing by 50% means multiplying by 1.5. Together, these operations multiply to 0.75, not 1, leading to a final value that is 75% of the original amount. This conversation helped reinforce the rich mathematical link between representations and the importance of understanding percentage change in context.
Thank you for your continued support,
Jenny and Luca.