Junior School

Only one week left of Term 1! Time has certainly run away with us this year.
Mathematics
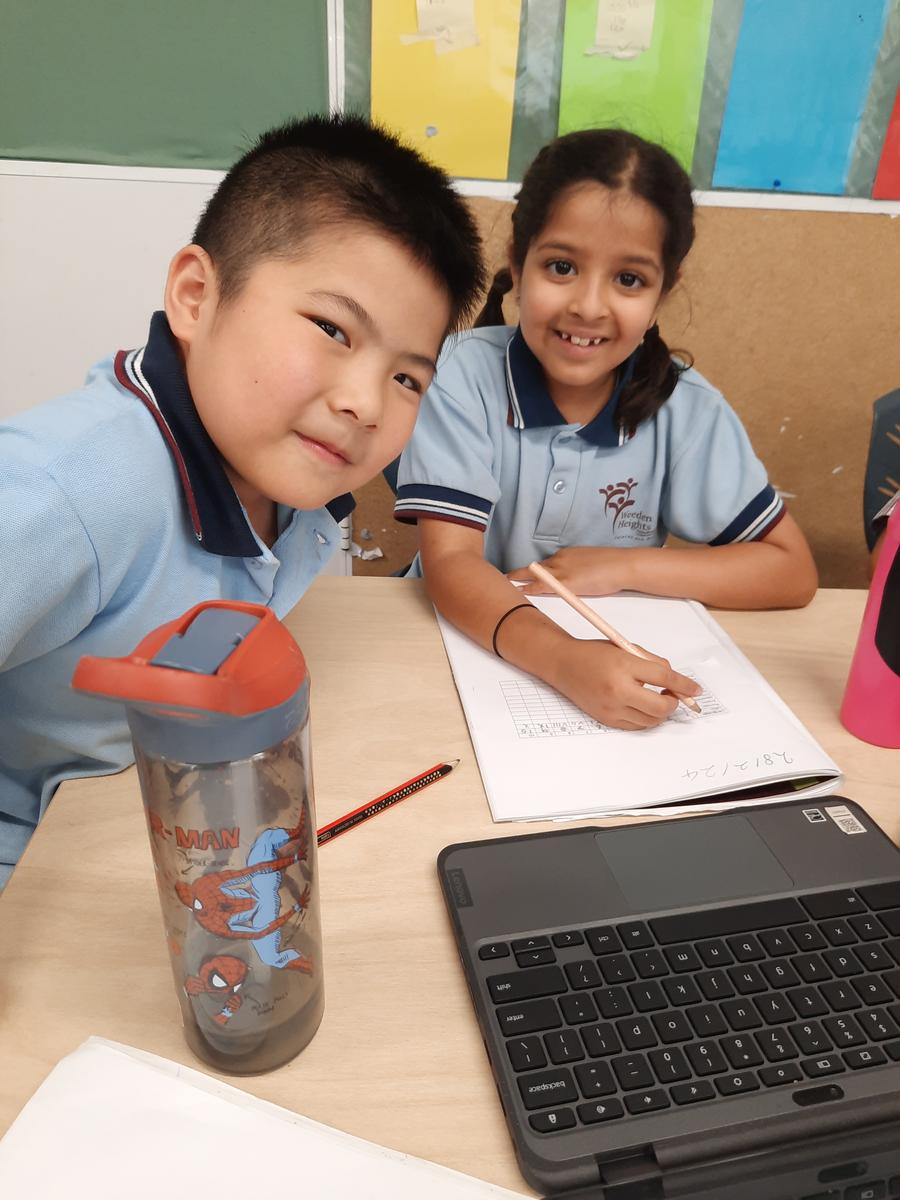
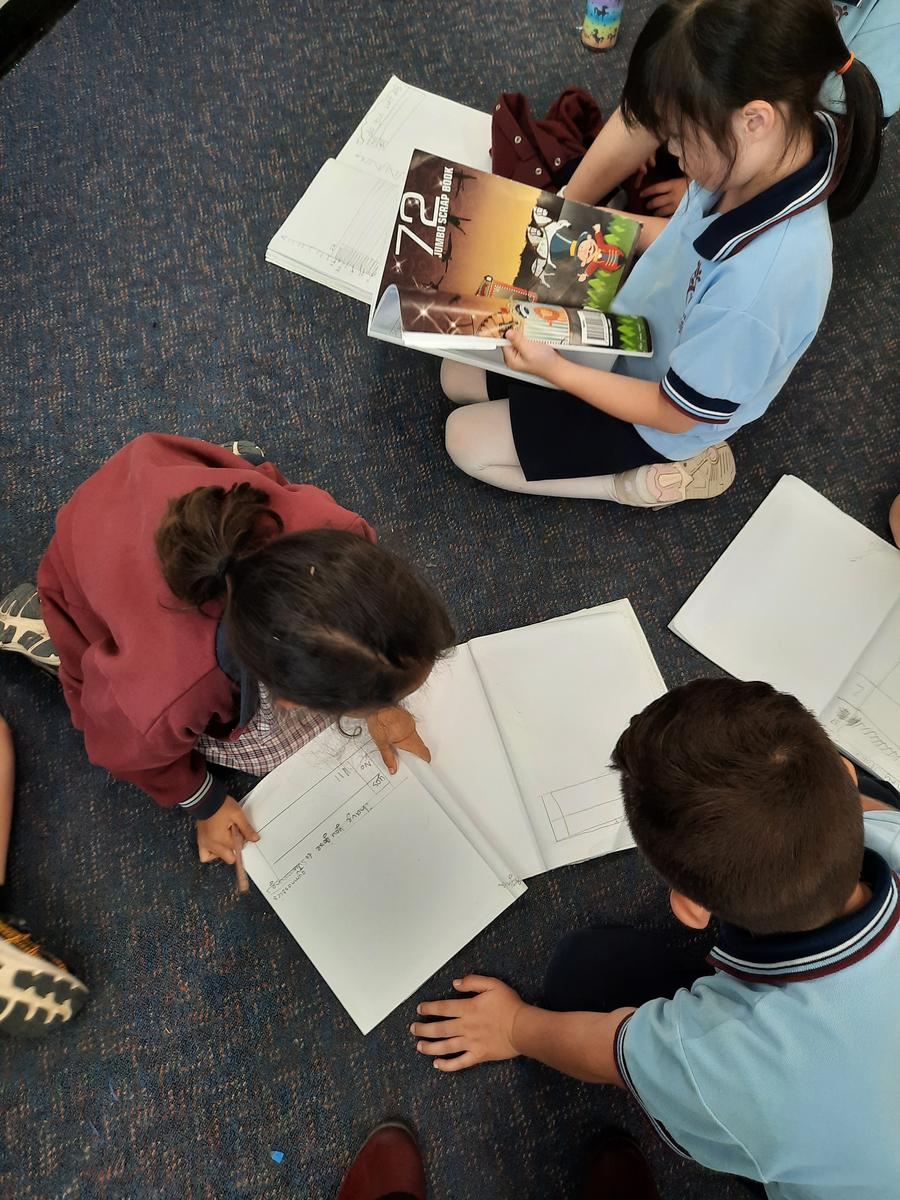
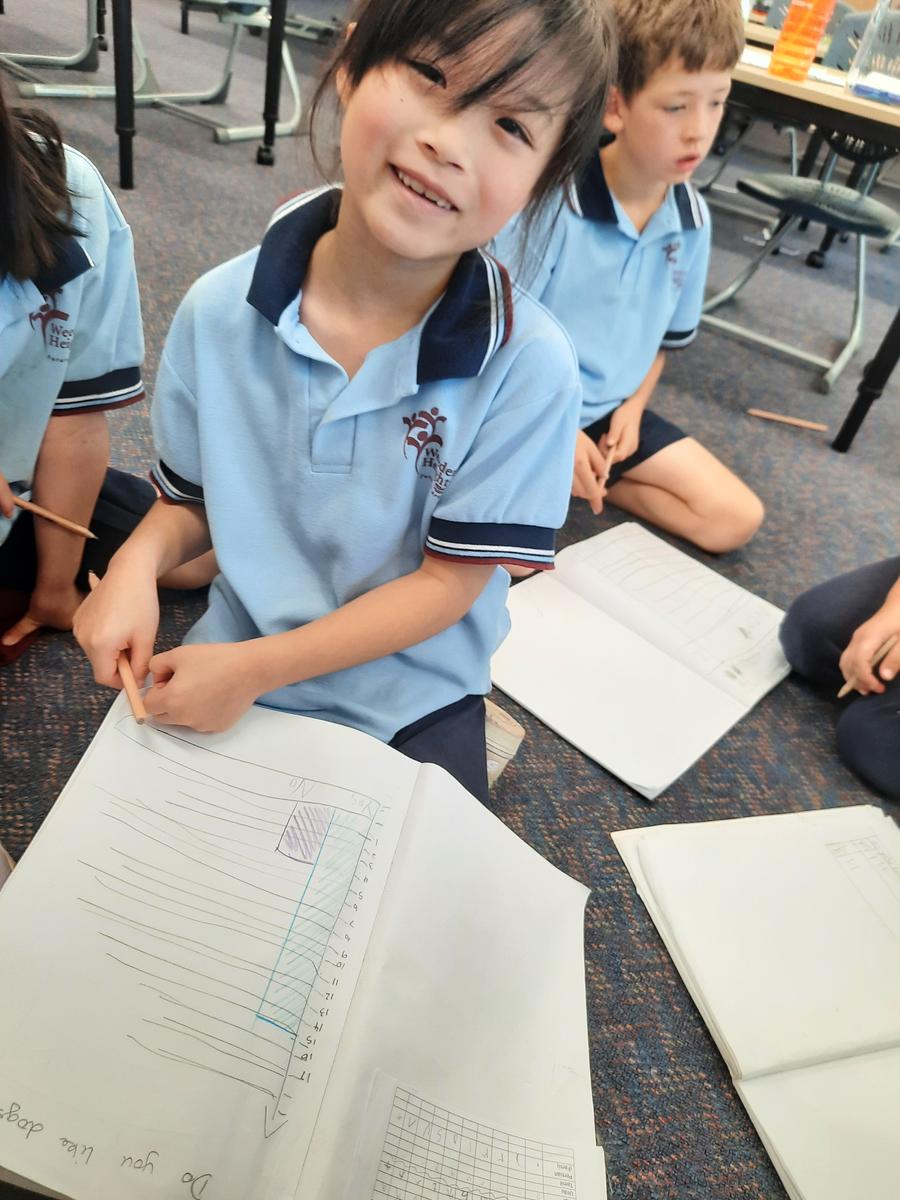
Over the past two weeks, students in year 2 have been learning about questions, data gathering, and graphs. They have thoroughly enjoyed learning how to create specific questions to collect interesting data, and being able to survey their classmates to find out their feelings and thoughts!
A graph is a type of diagram that is used to represent gathered data. It's important to know about the different features of a graph so you can understand what the graph is actually telling you. To give you a good overview of what the features of a graph are, have a quick look below:
- Title: Without a title, it’s very difficult to know what the data on the graph is all about.
- Axises: There are usually two, the x axis (horizontal line going "up" the page) and the y axis (vertical line going "across" the page).
- Labels: Whether a pie chart, bar graph, or dot plot, a graph needs labels. What do the lines going up the page mean? How many people gave a particular answer?
Inquiry Learning - Then & Now
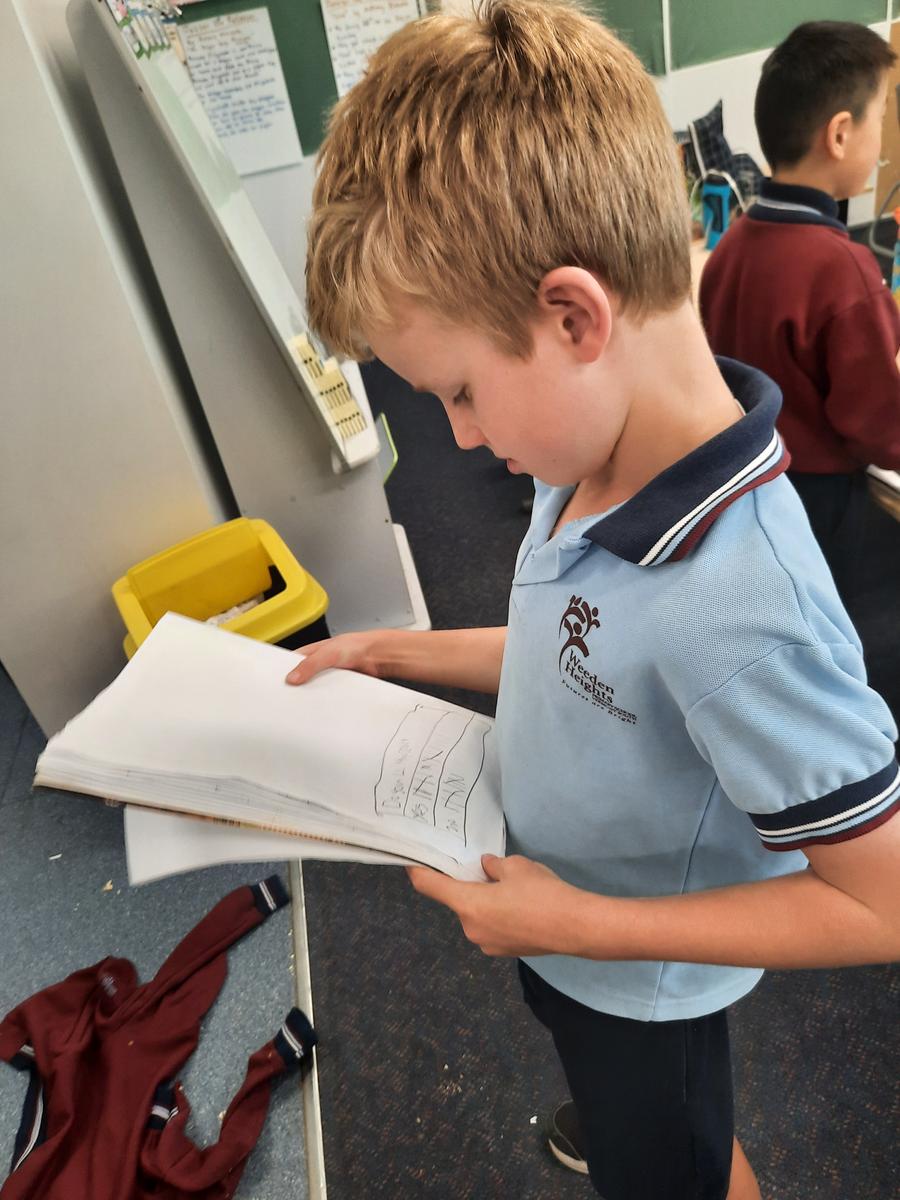
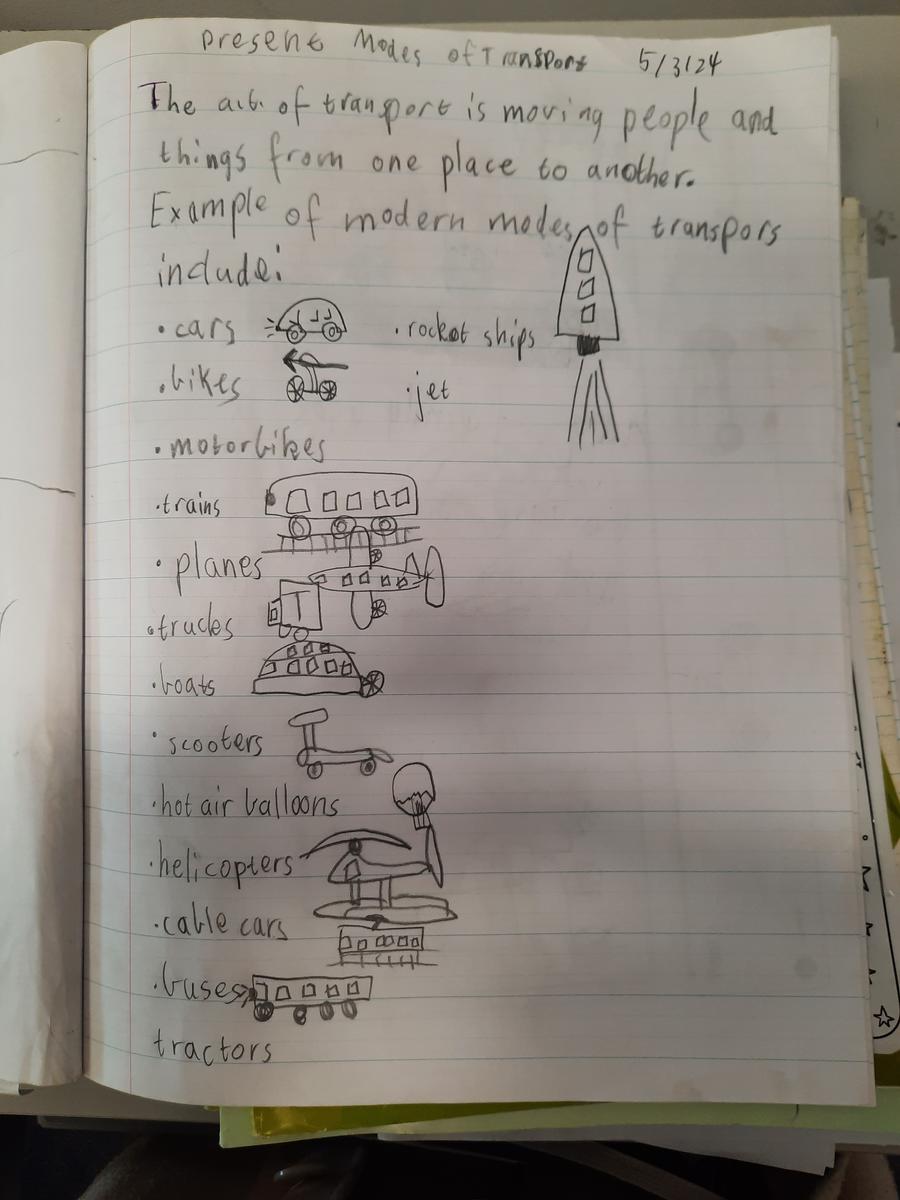
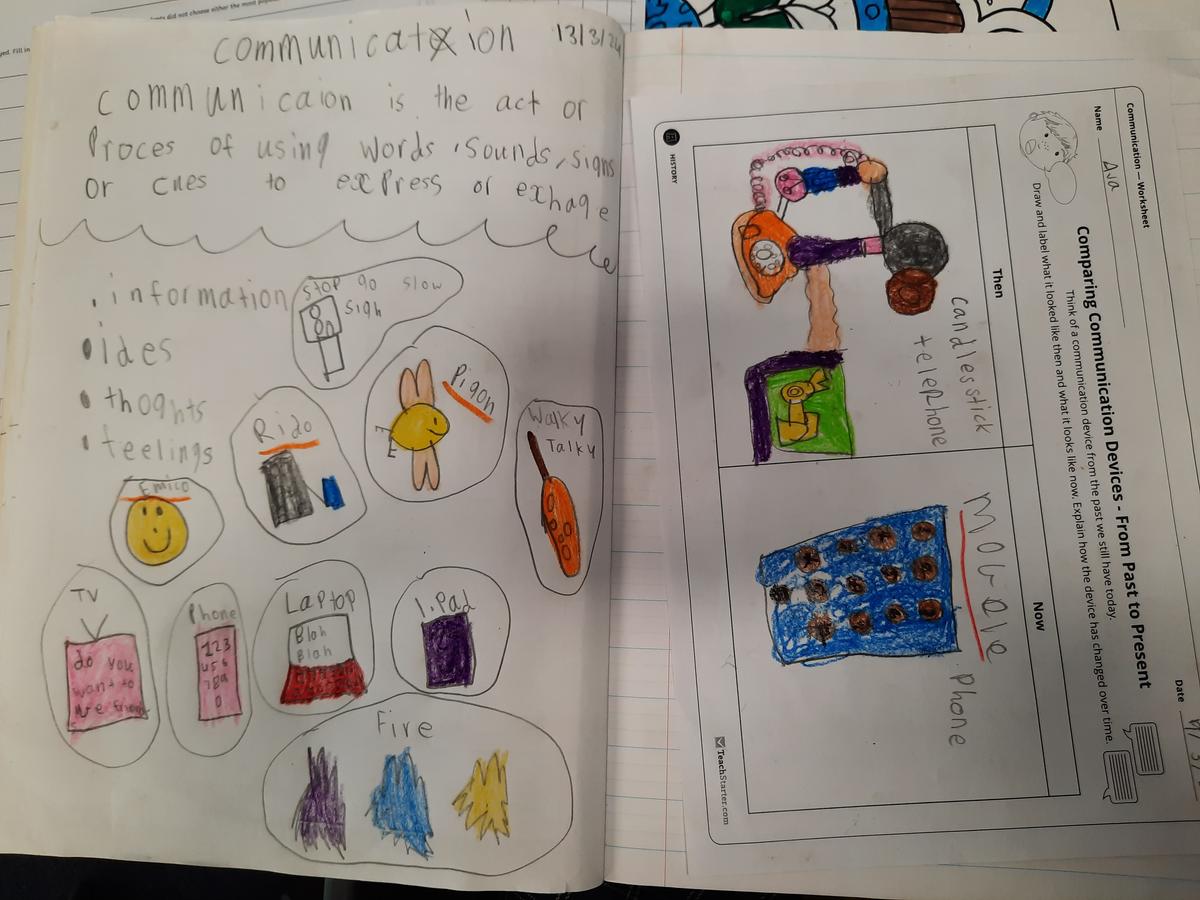
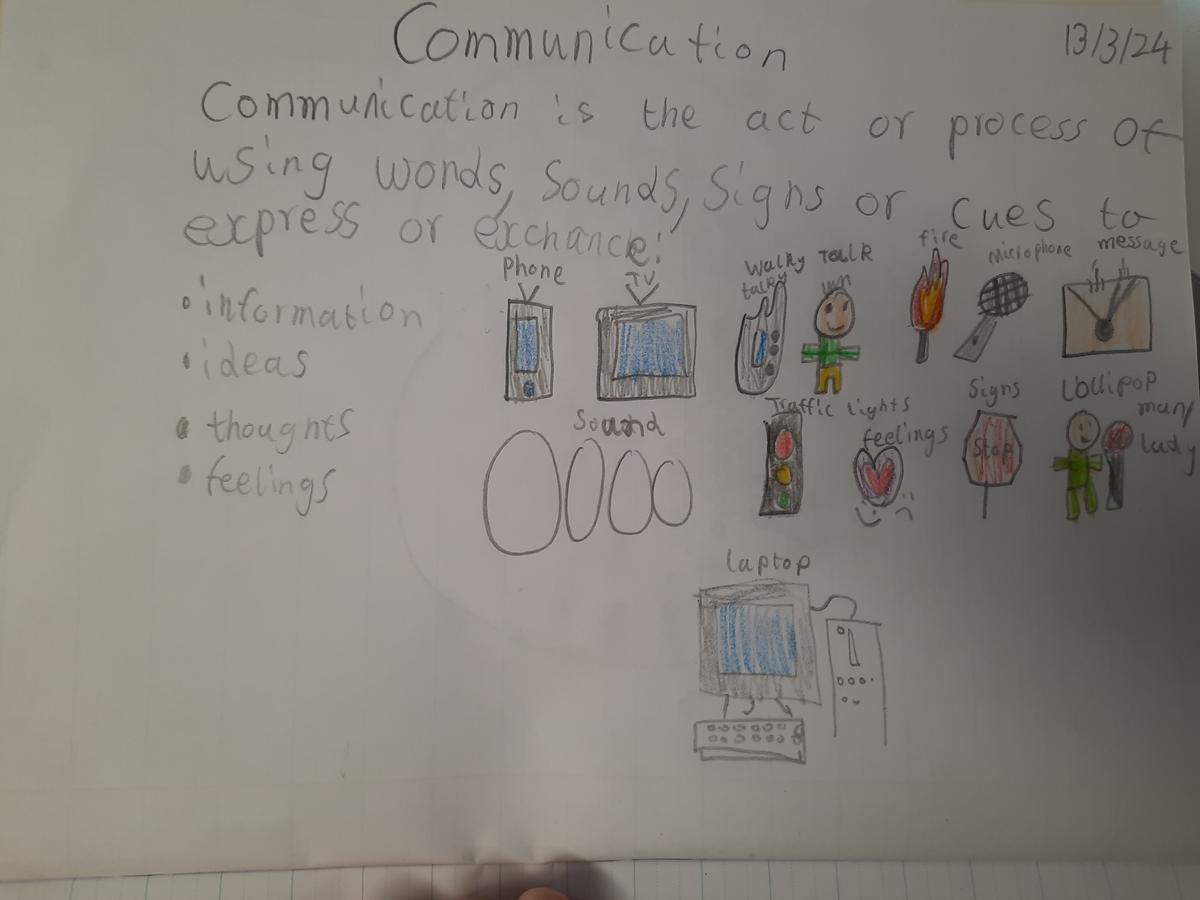
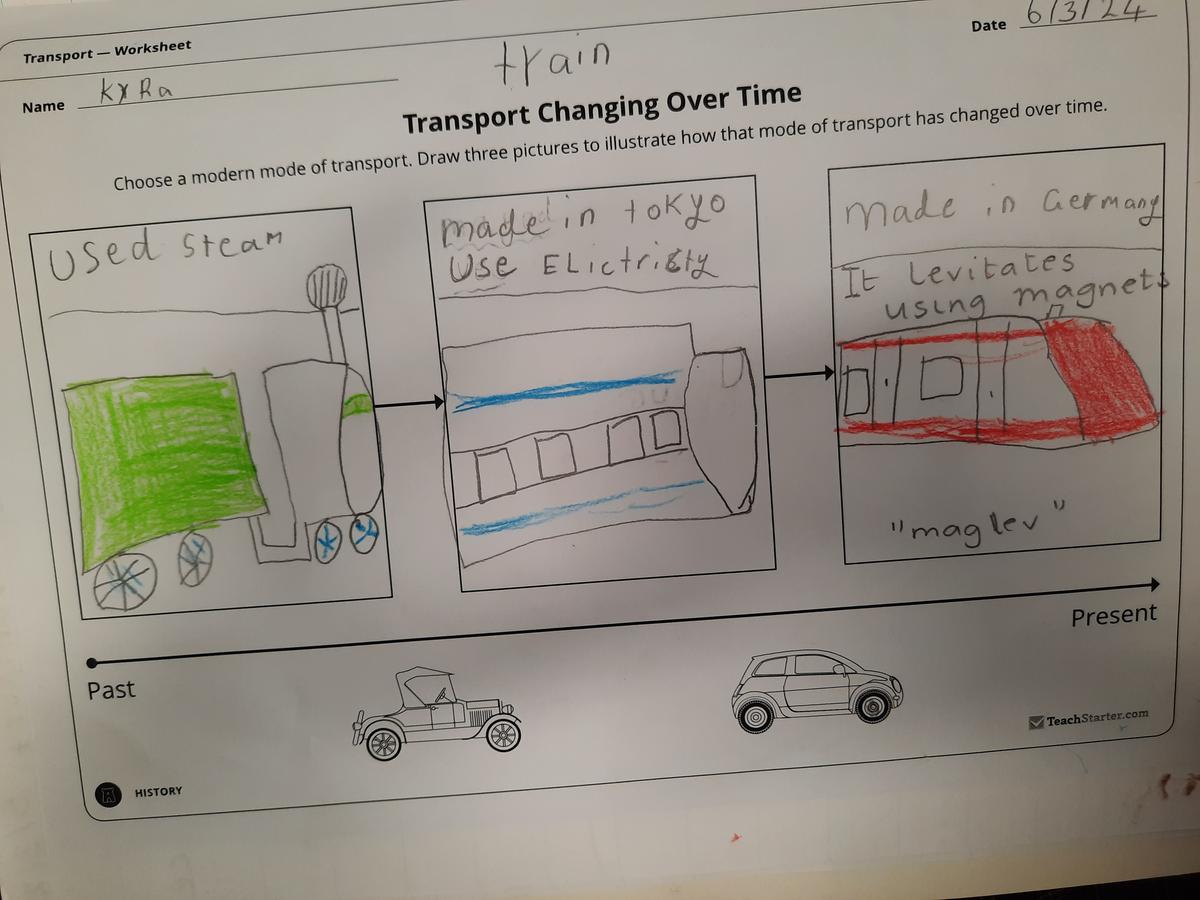
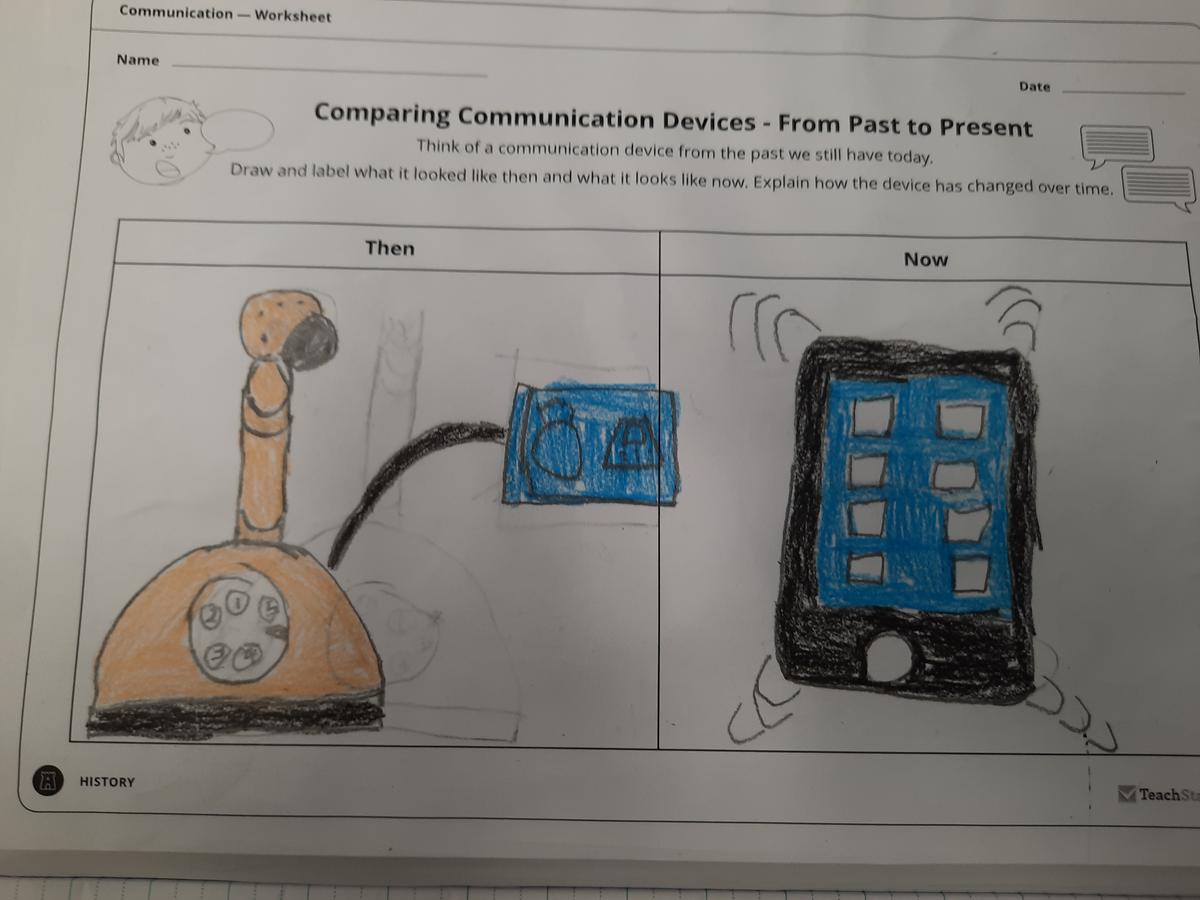
Students have been exploring the history of communication, transportation, and entertainment (specifically, toys) over the term. They have been fascinated by the origins of telephones and trains, pigeon mail and airplanes. Have a look below at some of the work they have created over the weeks.

