Mathematics News

Mathematics at Westgrove!
Maths Vocabulary Word of the Week:
Each newsletter we will be introducing you all to a new maths vocabulary word for you to learn.
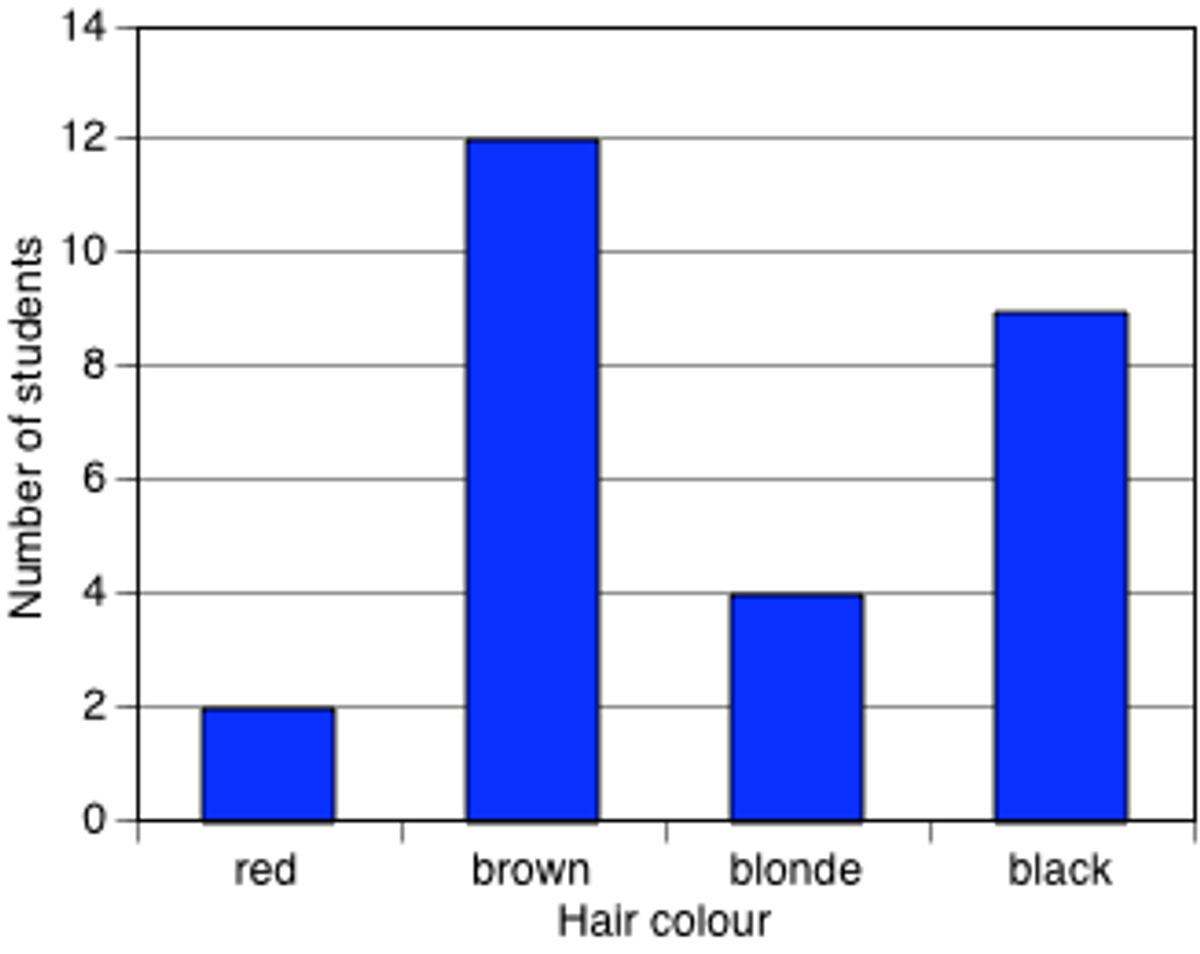
Column Graph:
A column graph is a graph used in statistics for organising and displaying categorical data. It consists of a series of equal-width rectangular columns, one for each category. Each column has a height equal to the frequency of the category. This is shown in the example below which displays the hair colours of 27 students.
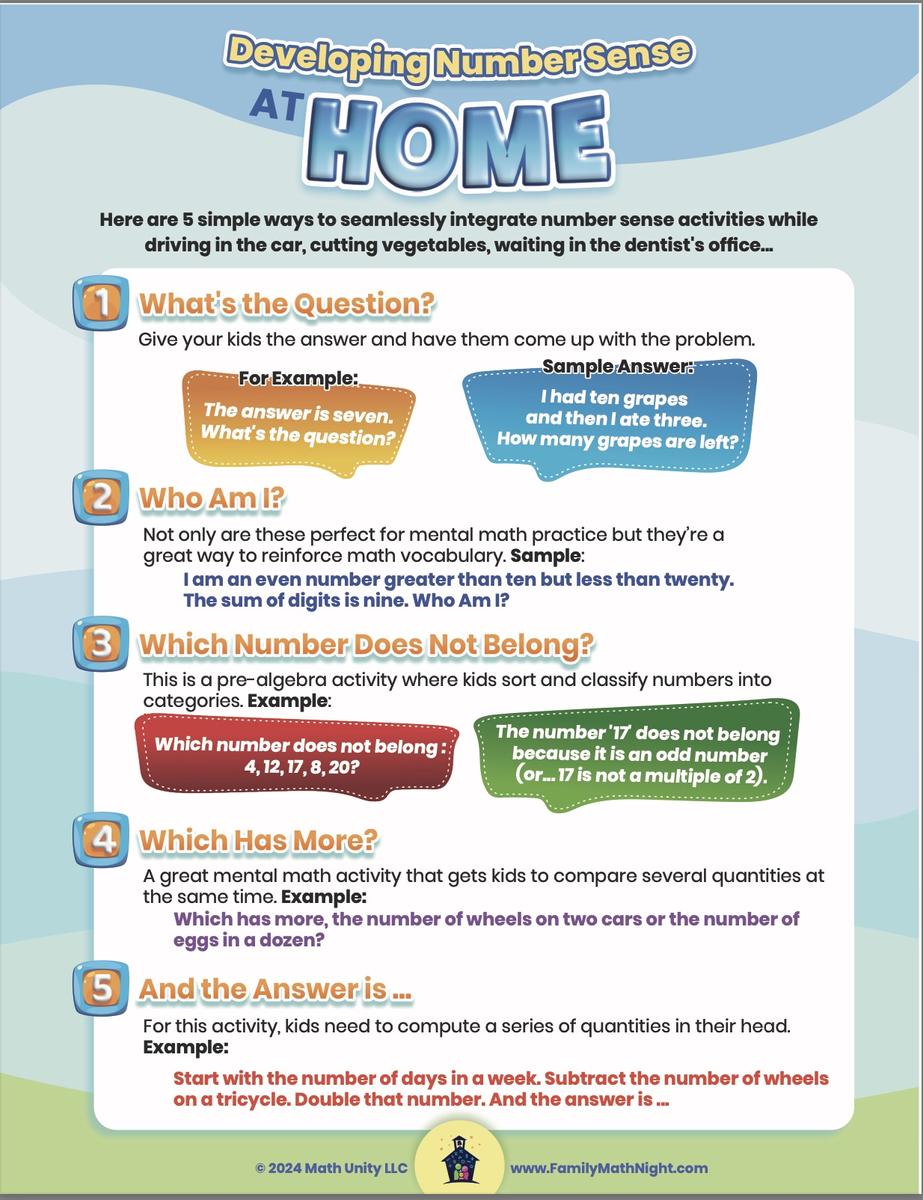
Maths at Home Ideas:
Problems of the Week!
Prep - 2 Problem
Year 3 - 6 Problem


