Mathematics
CURRICULUM FOCUS
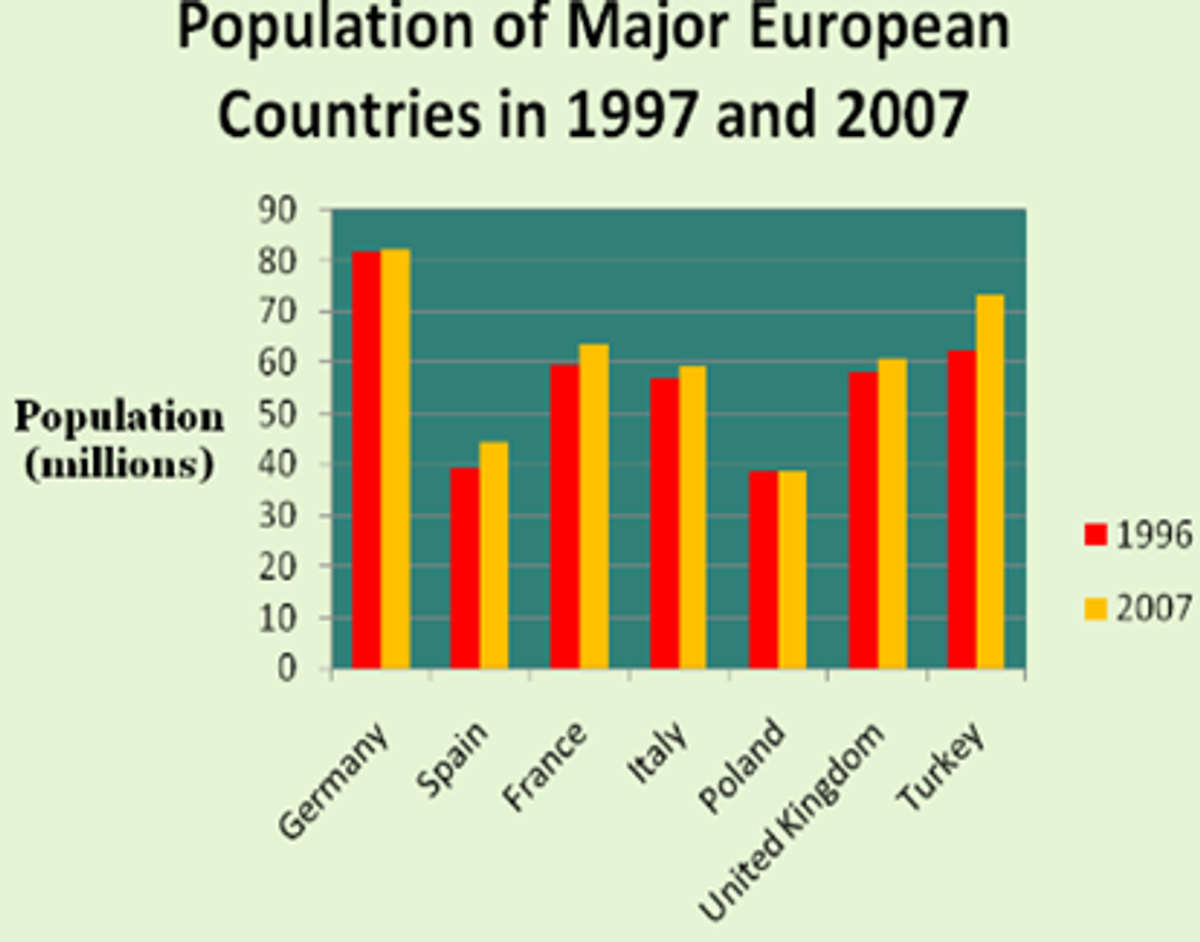
We are learning to create side by side graphs.
VOCABULARY
Side by side bar graph: A side by side bar graph is used to compare two different groups or categories side by side. It allows you to see differences and similarities between multiple things.
Analysing the graph means you carefully look at the graph to see any noteworthy information. This could include highs, lows, averages (mean) and most common occurrences (mode).
Facts: A thing that is known or proved to be true.
ACTIVITIES YOU CAN DO AT HOME TO SUPPORT YOUR CHILD'S LEARNING
Create a side by side graph and complete the following tasks.
You can create your own question but two ideas are:
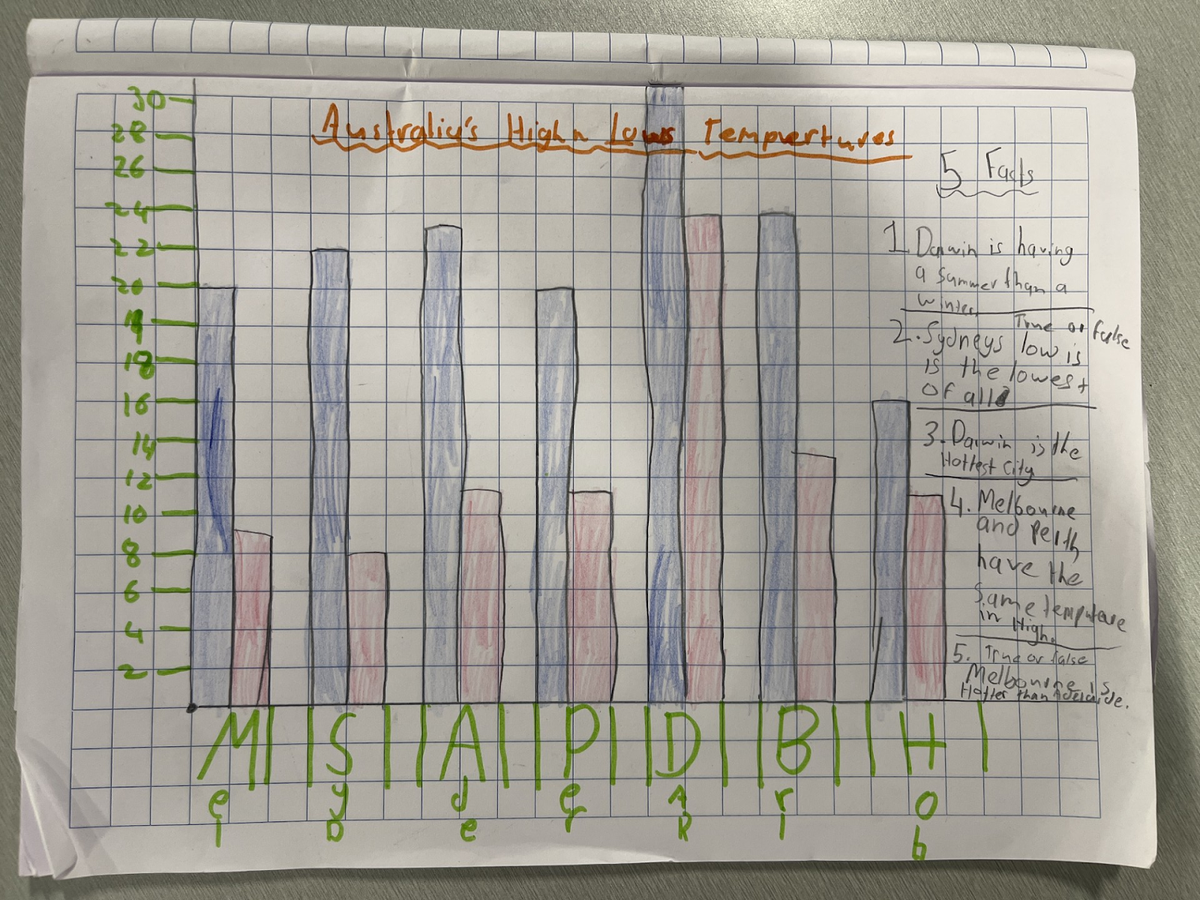
- Record the high and low temperatures for all capital cities in Australia for the current day.
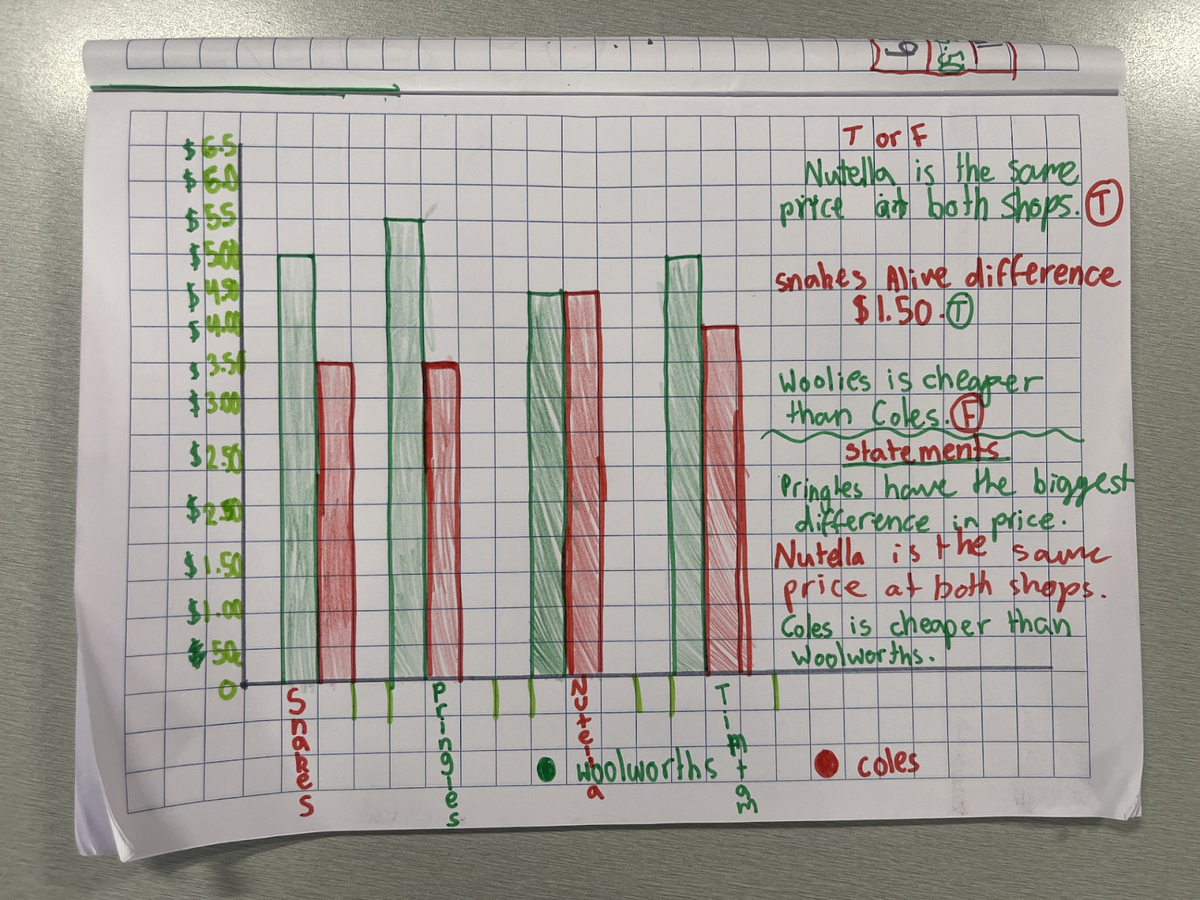
- Compare four items prices at Coles and Safeway
Analyse the graph and record 3 statement facts about the data.
Create 3 true or false questions for someone at home to answer
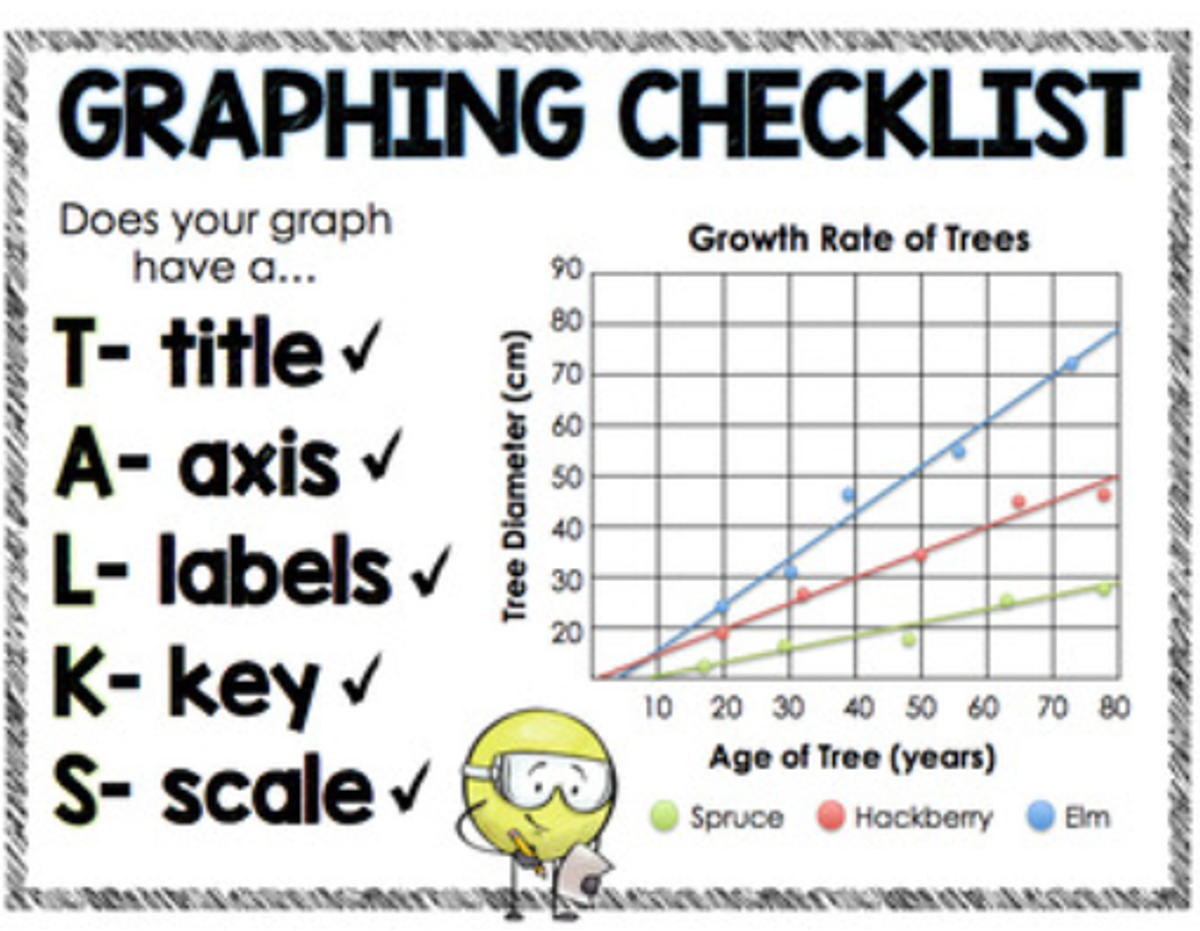
Use the checklist below to ensure your graph isn’t missing anything.

