MATHS

YEAR 8 STATISTICS PROJECT
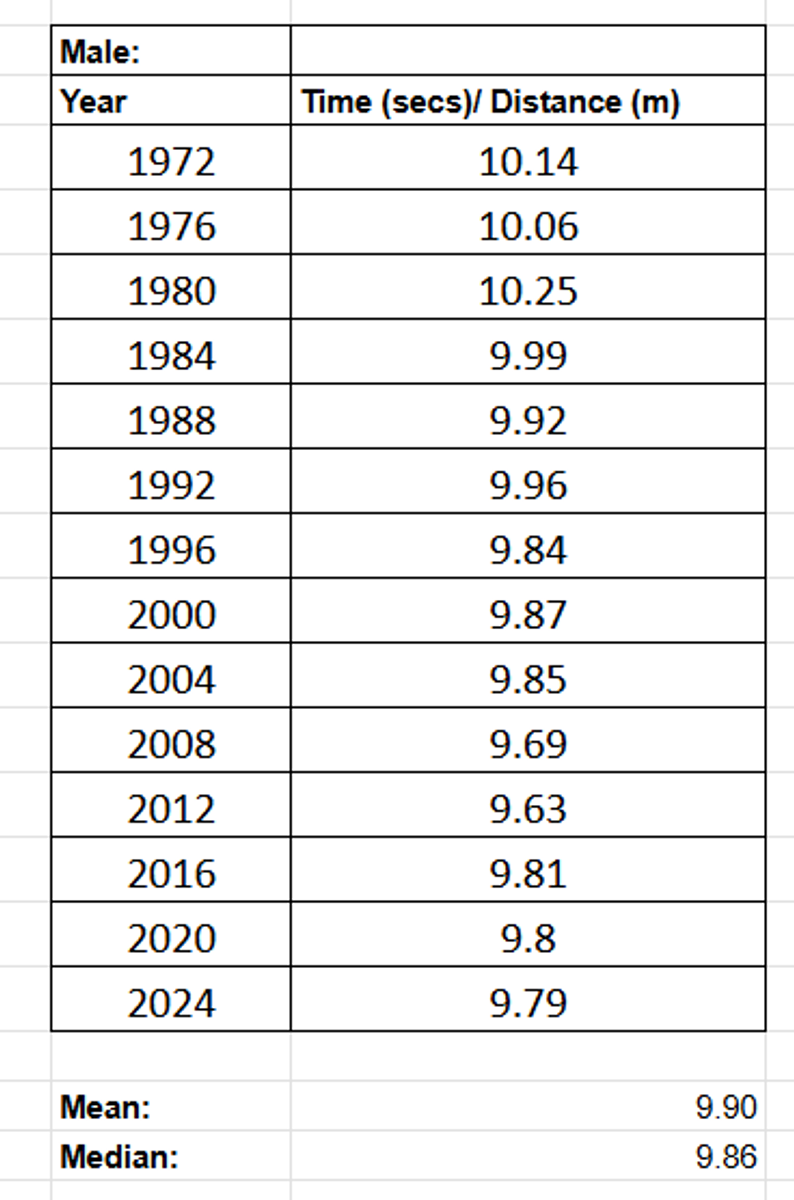
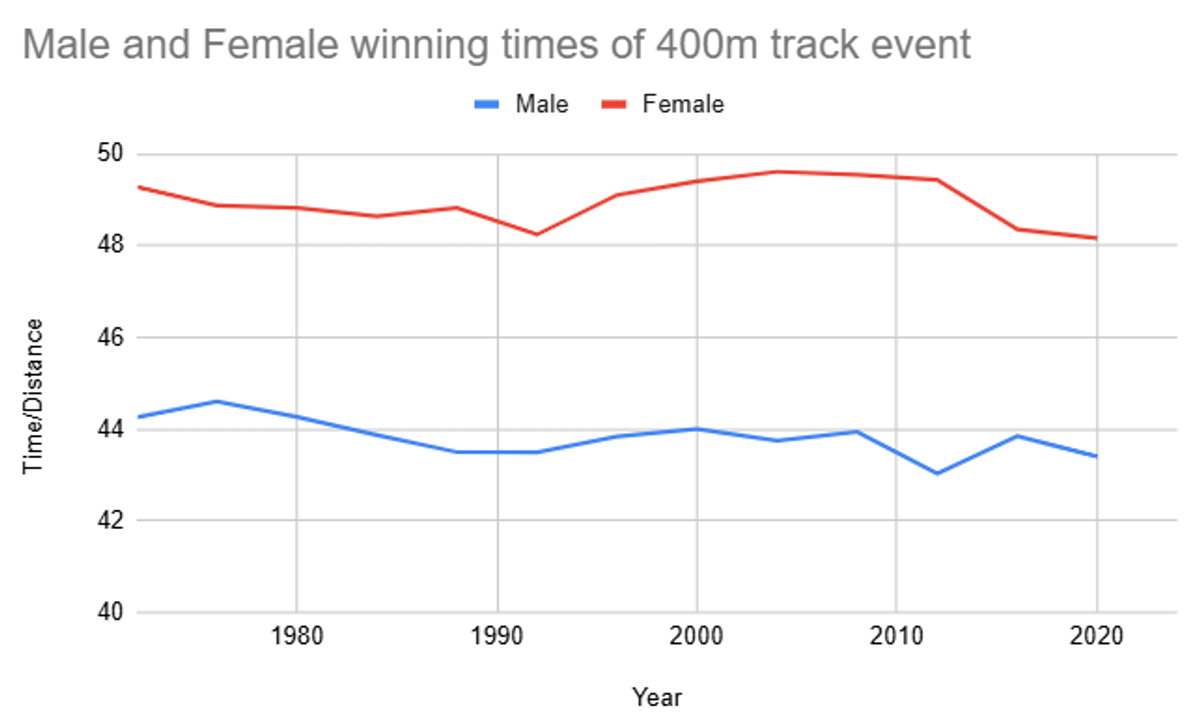
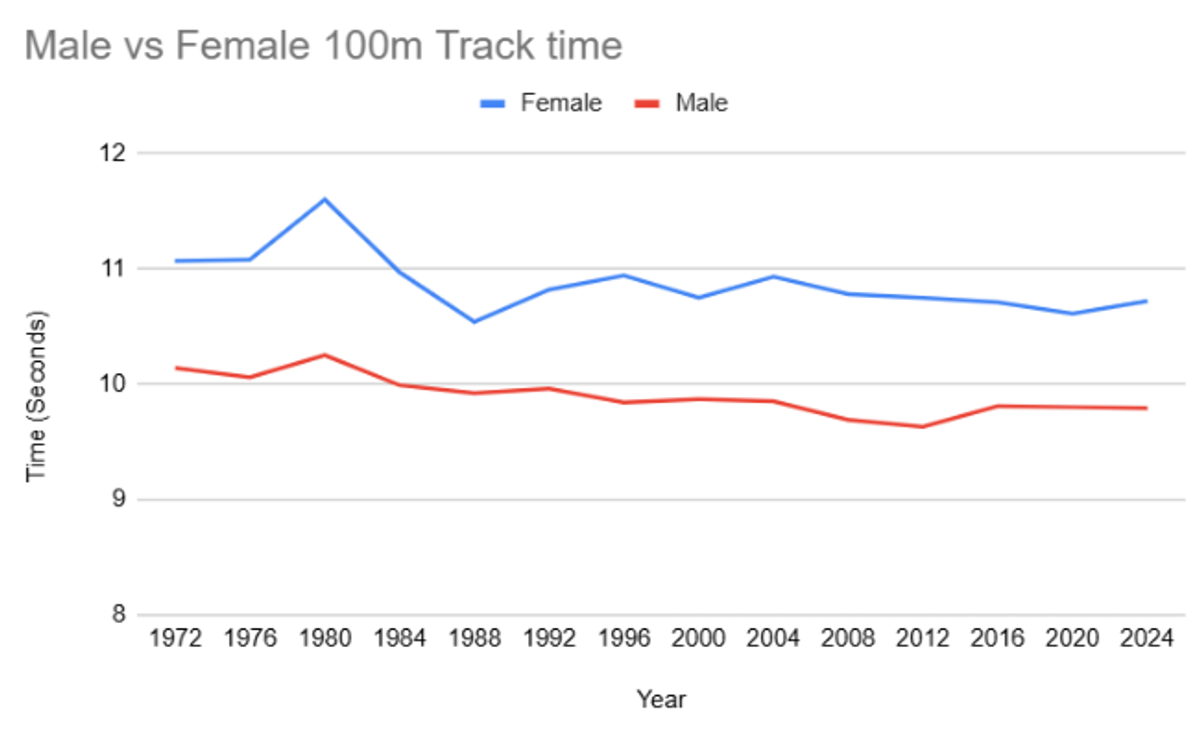
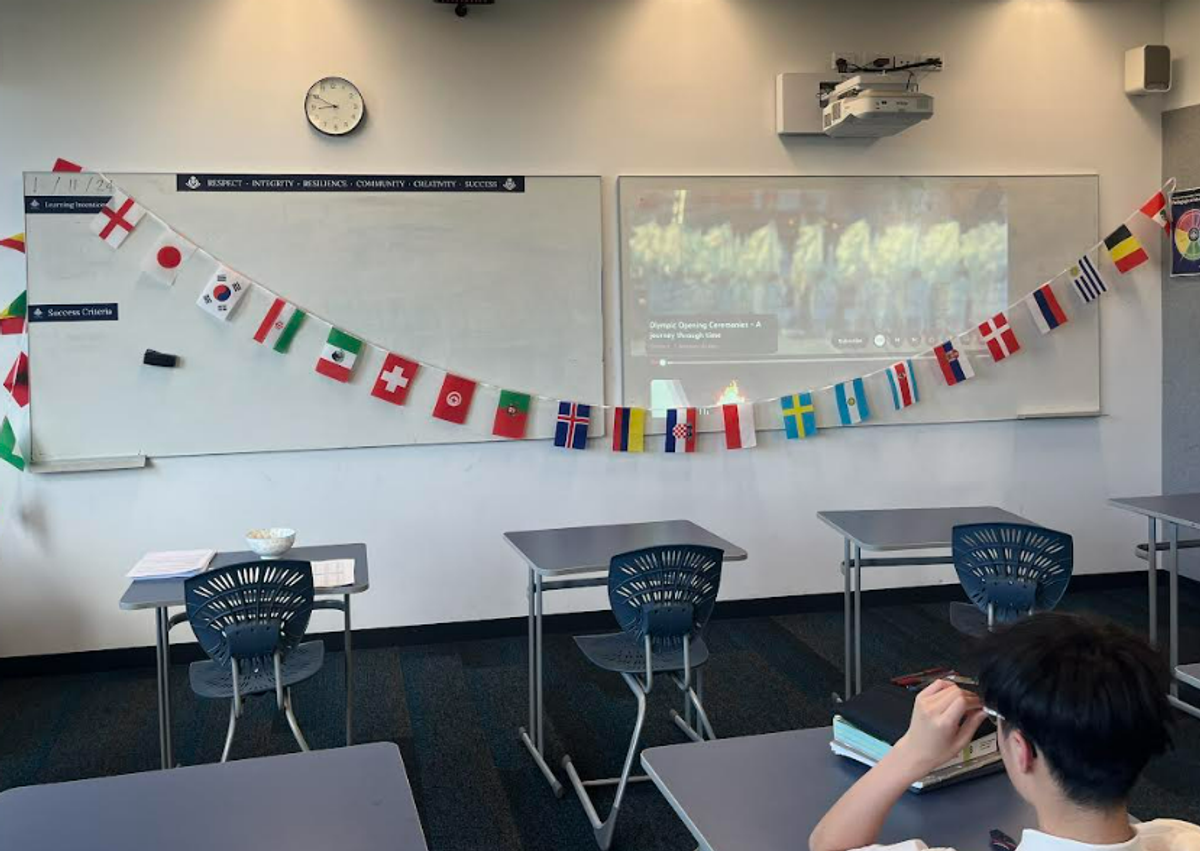
Year 8 students worked on a Statistics project where they explored how the winning times/distances of Olympic events have changed over the past 52 years.
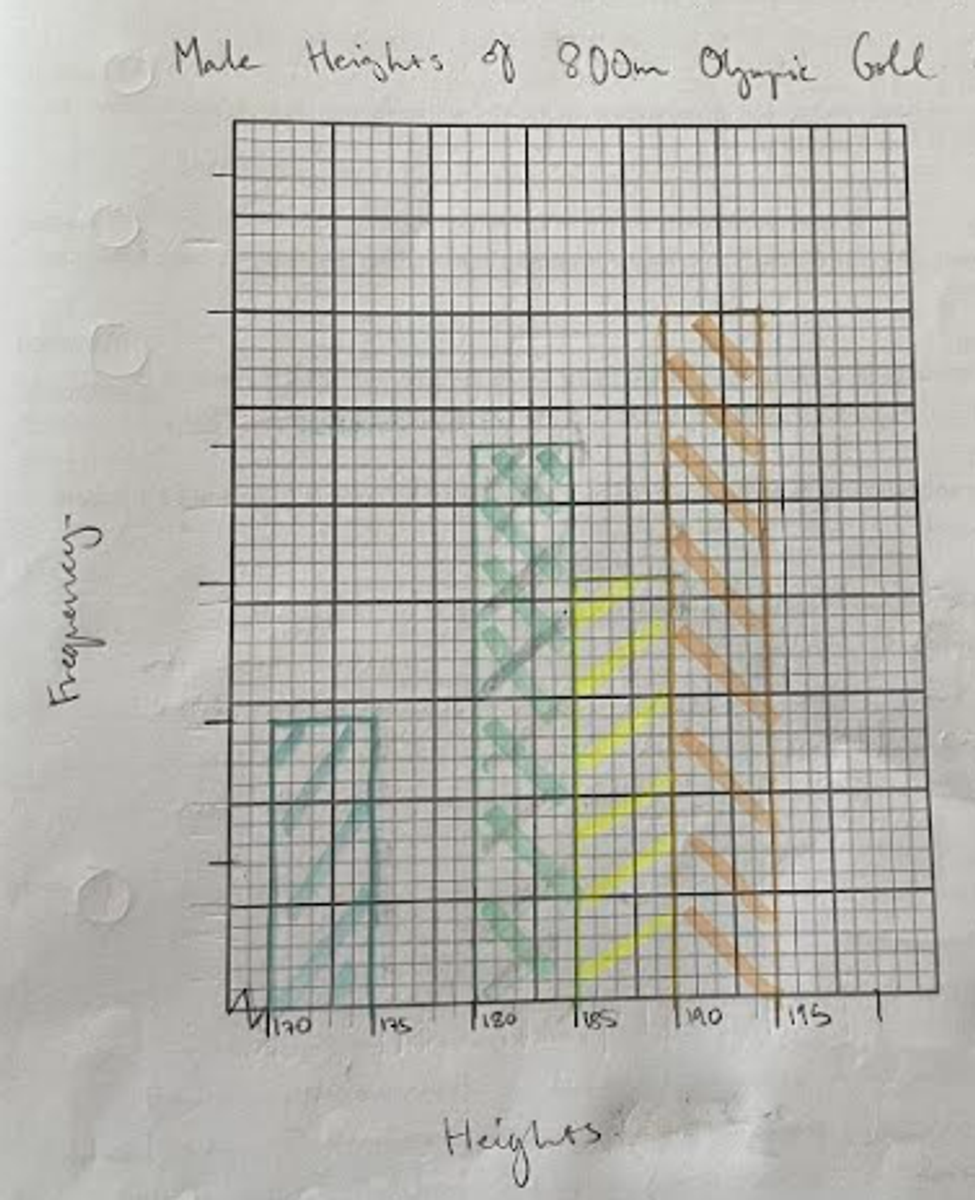
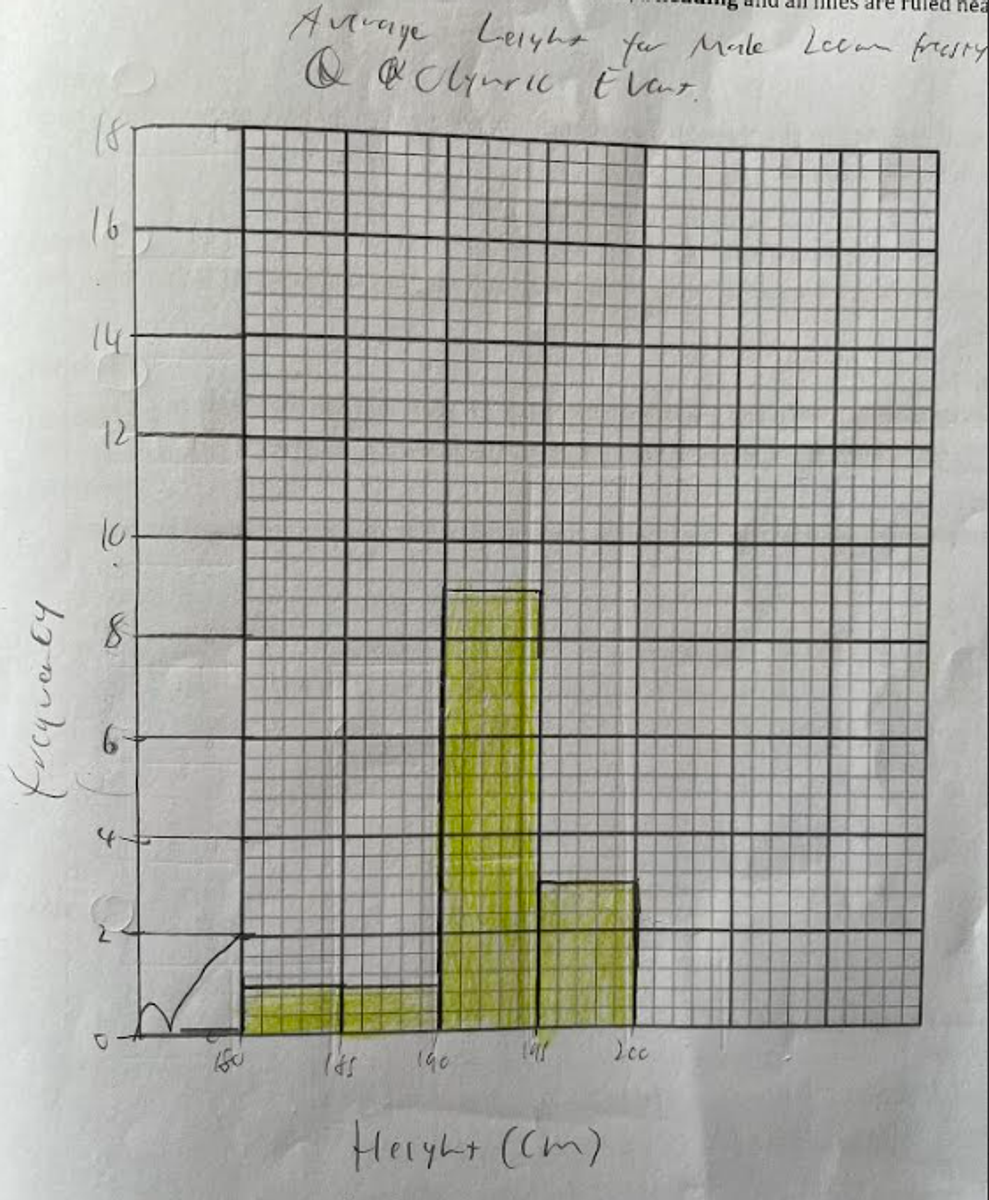
They presented the data in a report form that included calculating the averages using different methods and representing the data using histograms.
Sebastian Le (Year 8) summarised it as follows:
This term the Year 8s did a Statistics Project using real statistics from the Olympics. We were given a certain event and statistics from that event (e.g. 200m Butterfly and the height and distance swam of each winning athlete).
Using this information, we had to answer questions in the booklet. We also used Google Sheets to create graphs and calculate the mean, median, mode, etc. The project was similar to a Learning Task, an assessed "test" that's completed over a long period of time. The work was mainly independent so we could control the pace at which we worked.
I found it to be a very enjoyable experience and a nice break from the exhausting test environment. I very much enjoyed re-learning how to use Google Sheets and the independent learning environment. I think that we should do more projects like this in the future.
At the end of their report students were asked to reflect on the process and content, some comments they made include:
I liked this project; I learnt a lot about using Google sheets. I enjoyed doing this topic about the Olympics (it makes it more fun). I also learnt more about the Olympics e.g. when it started, average times and where it was held.
I learnt how to find the IQR and the importance of checking over my calculations. I enjoyed getting to do histograms and using Google sheets.
I learnt how to find the IQR and I enjoyed using the Google sheets element the most.
I improved a lot using Google sheets and I enjoyed using them too. I also improved at drawing Histograms.
I thought this project was really helpful. I learned how to draw histograms and how to use my Chromebook to create line graphs. Also, I really enjoyed writing the reason and analysing the differences between the data my teacher gave me.
During this project I learned how to calculate the IQR from a set of data. I enjoyed the project as I liked using Google sheets to make graphs.
I enjoyed representing the same data in different ways using the mean, mode, median and range. I also learnt how to make a graph in Google sheets.
An awesome end to the year – well done Year 8s.
Year 8 Maths Team

