Year 1 Bulletin
Maths

Year 1 Bulletin
Maths
Learning Experience Overview:
The previous week and this coming week, the students have been exploring data and the process of collecting, organising and creating questions using different forms of data. Each lesson was modelled on different strategies for each lesson to allow students to clearly understand the steps.
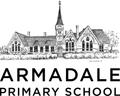
In the first lesson of the week, we got the students to create appropriate questions for data collection using picture prompts. The Teachers modelled how they created questions using particular questioning prompts that connect to the picture. The picture contained various cartoon animals, which we then designed questions that were clear and could be used for data collection.
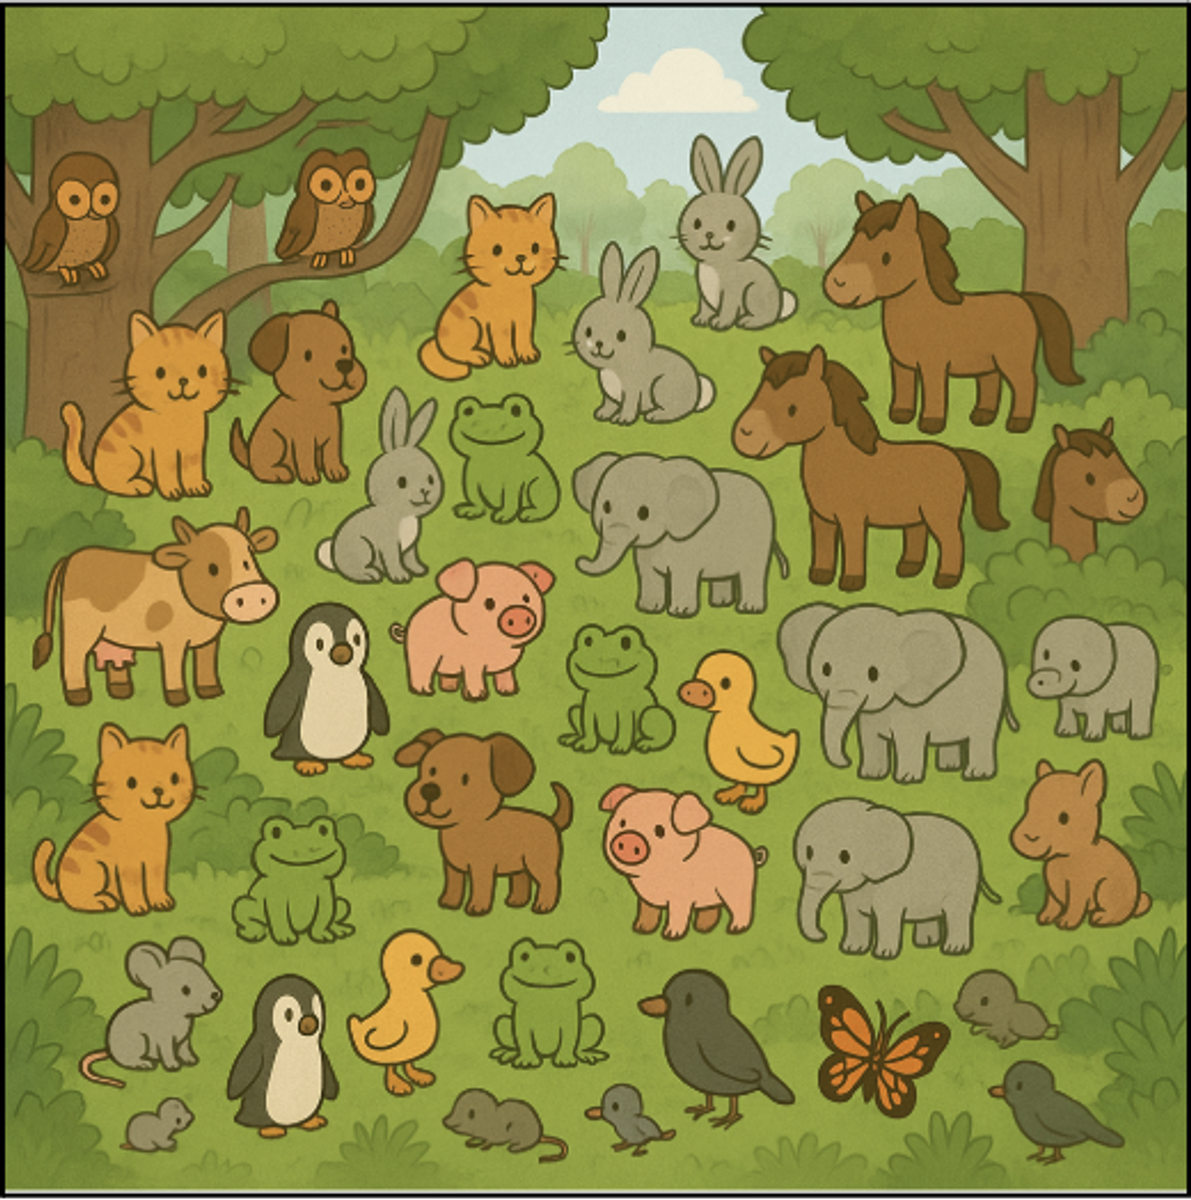
Students applied the questioning prompts below for creating questions that would link to a picture of a city traffic intersection, which showed multiple forms of vehicles as well as crossing pedestrians. This allowed for multiple directions in the types of questions the students can create, as well as the type of data they could collect from it.
Think-Aloud Prompts:
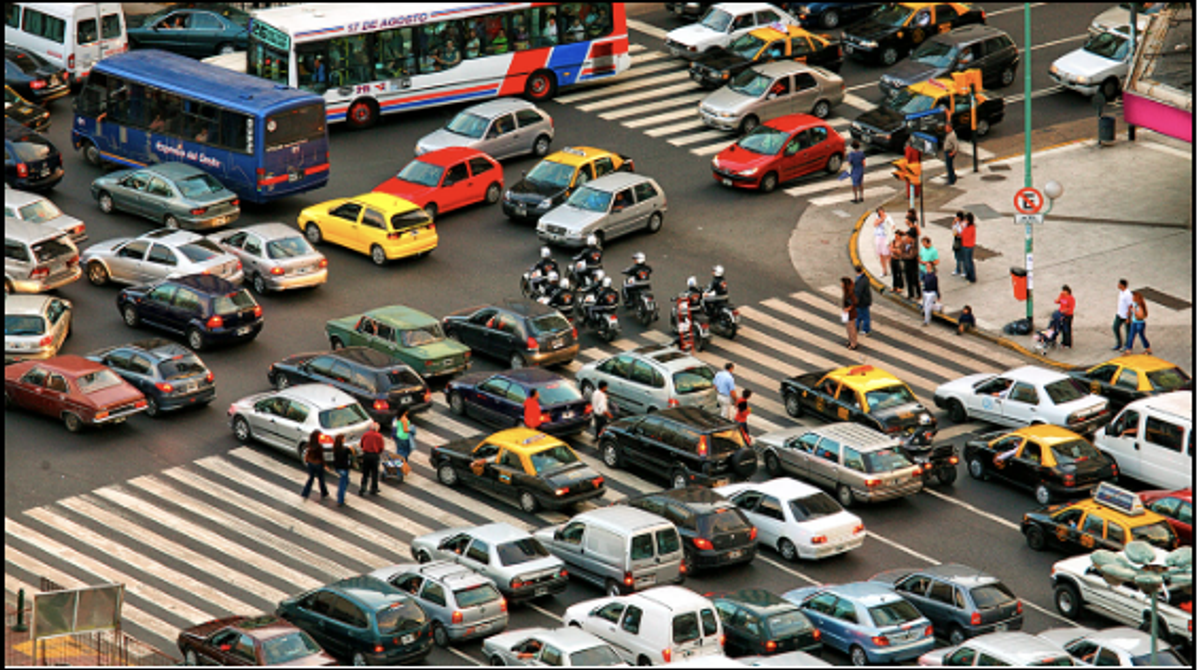
In the second lesson, we progressed into creating surveys for students to ask their peers a data-collecting question using a selection of answers. The students would then tally their students' answers in the corresponding answer options. Students would have pre-selected three to five answer options before recording student responses.
Most students used the questions:
What is your favourite ice cream flavour?
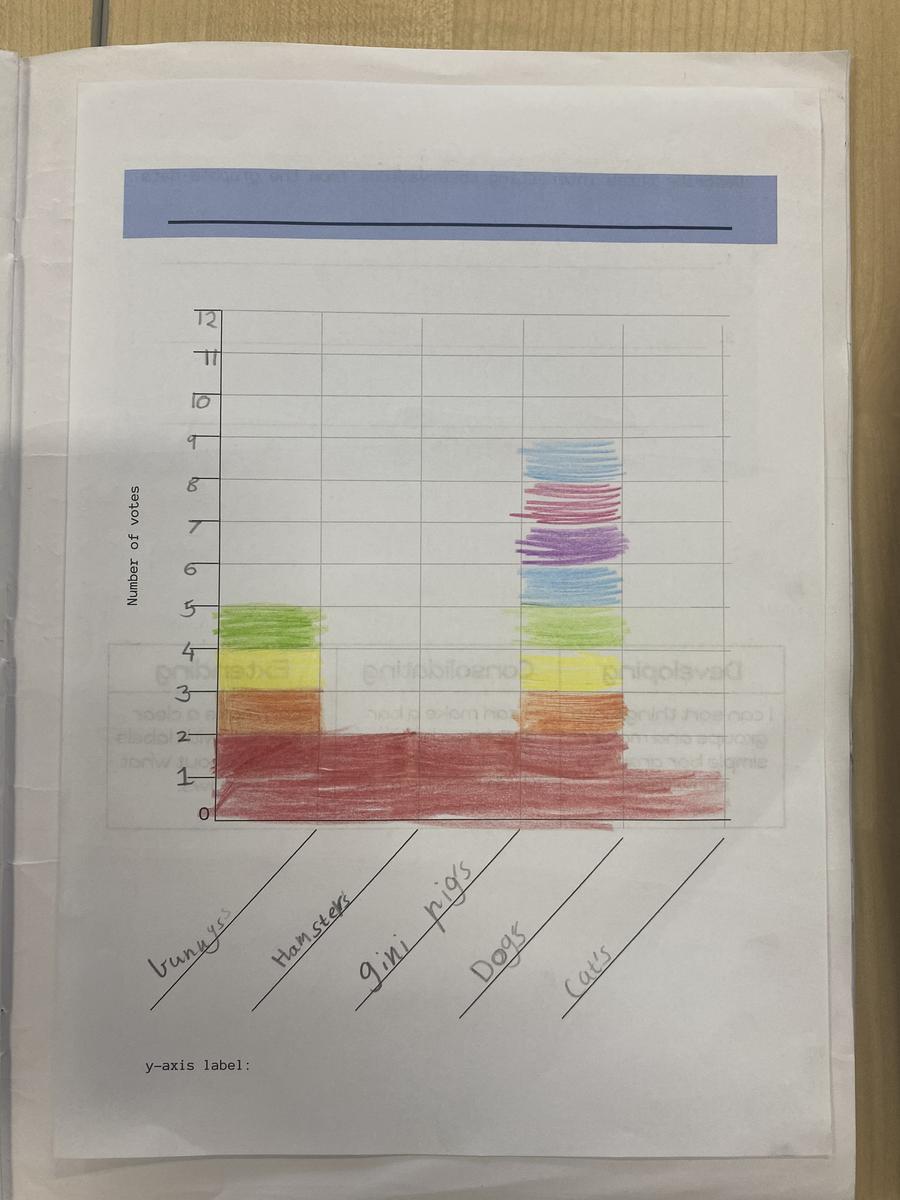
What pet do you have?
What is your favourite colour?
Extending prompt: Creating their own question.
This Anchor chart was used to guide students in the process of surveying and tallying their answers.
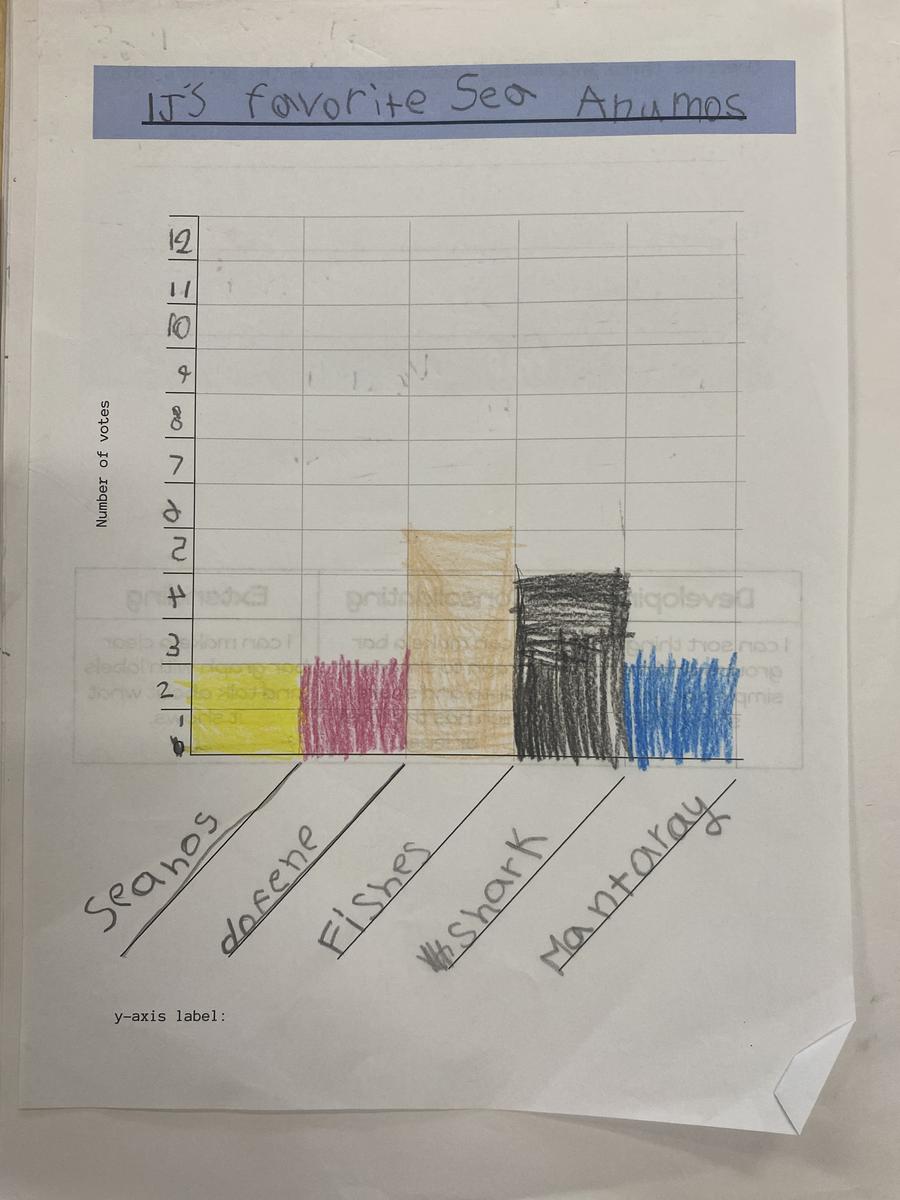
The third lesson is where the teachers guided the students into organising their survey tally marks into a bar graph
Learning Intention: To represent collected data.
Fluency: This week's fluency focused on the students practising their skip-counting skills (2s, 5s, 10s). We utilised different materials for students to continue applying their skip-counting skills.
Whole:
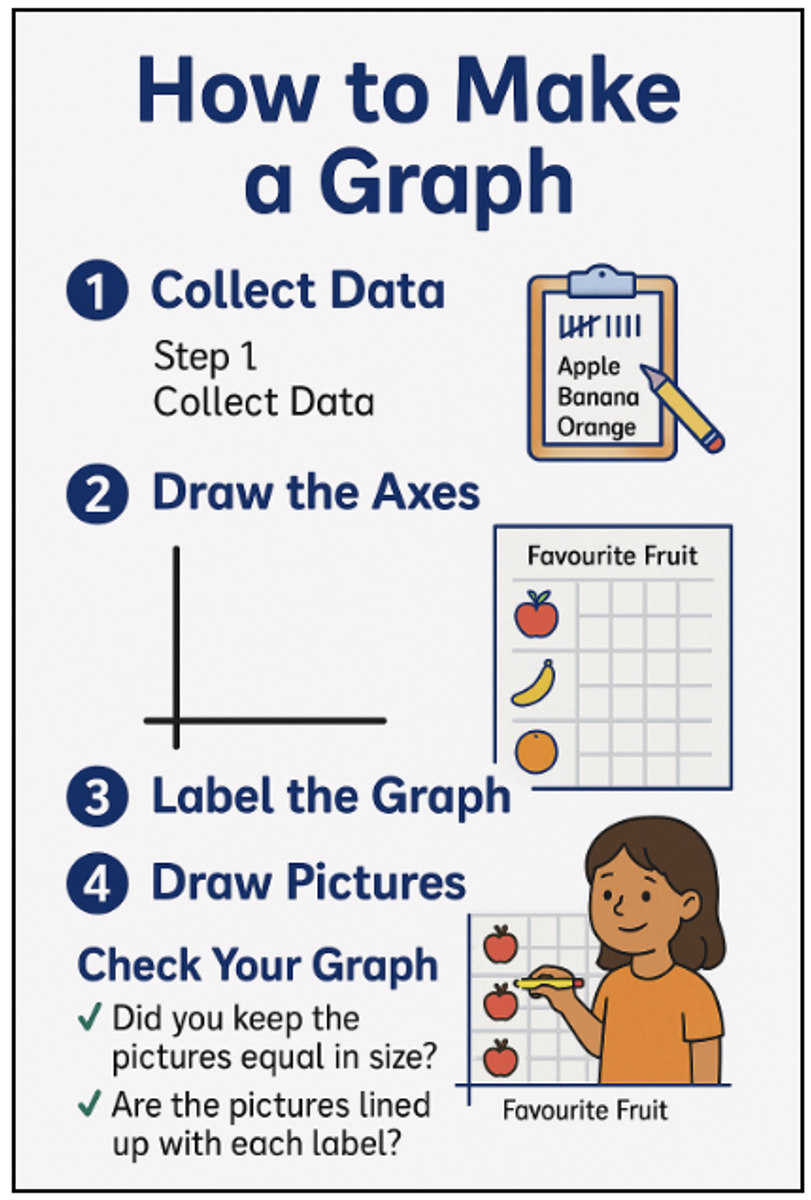
We presented the steps on how to create one and the rules you need to follow when creating a bar graph.
We use the anchor chart below to clearly illustrate the steps for students to follow easily.
Small:
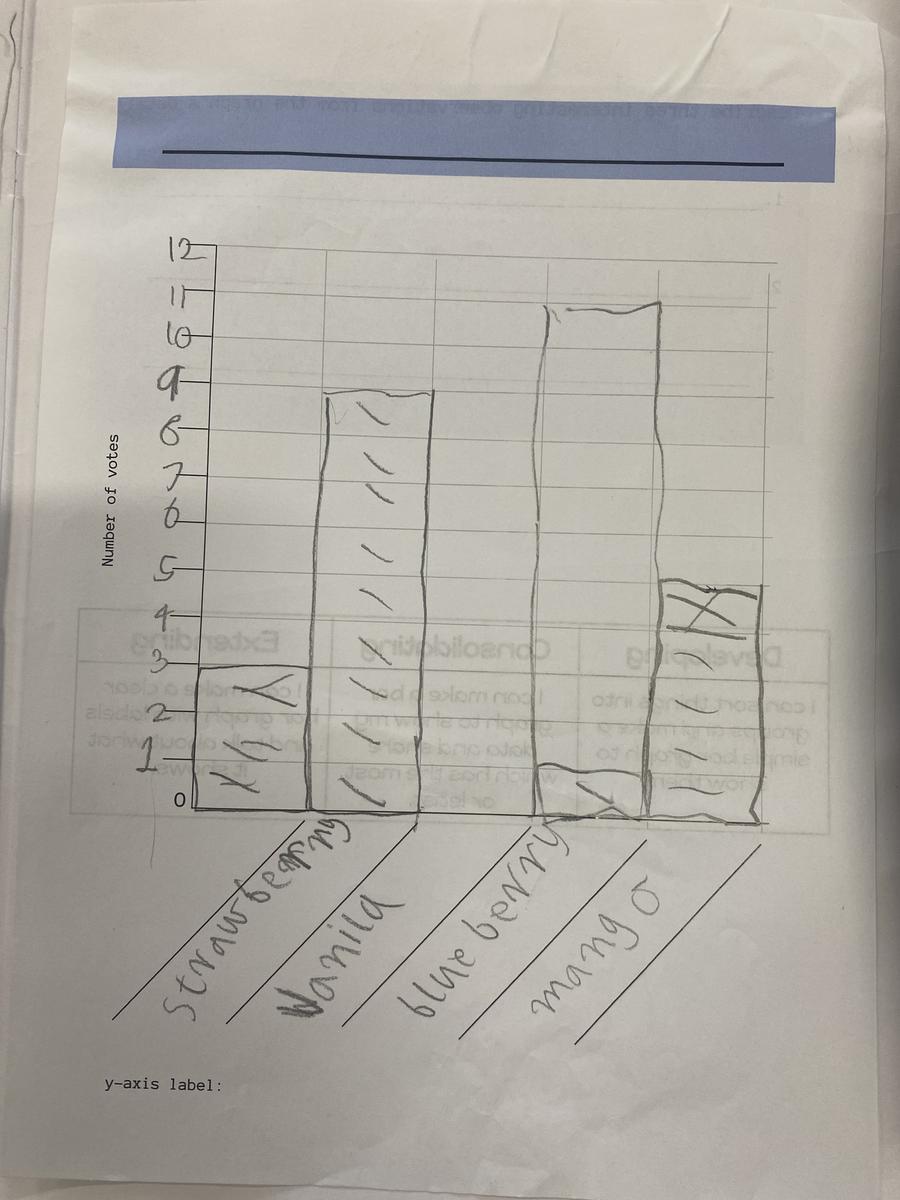
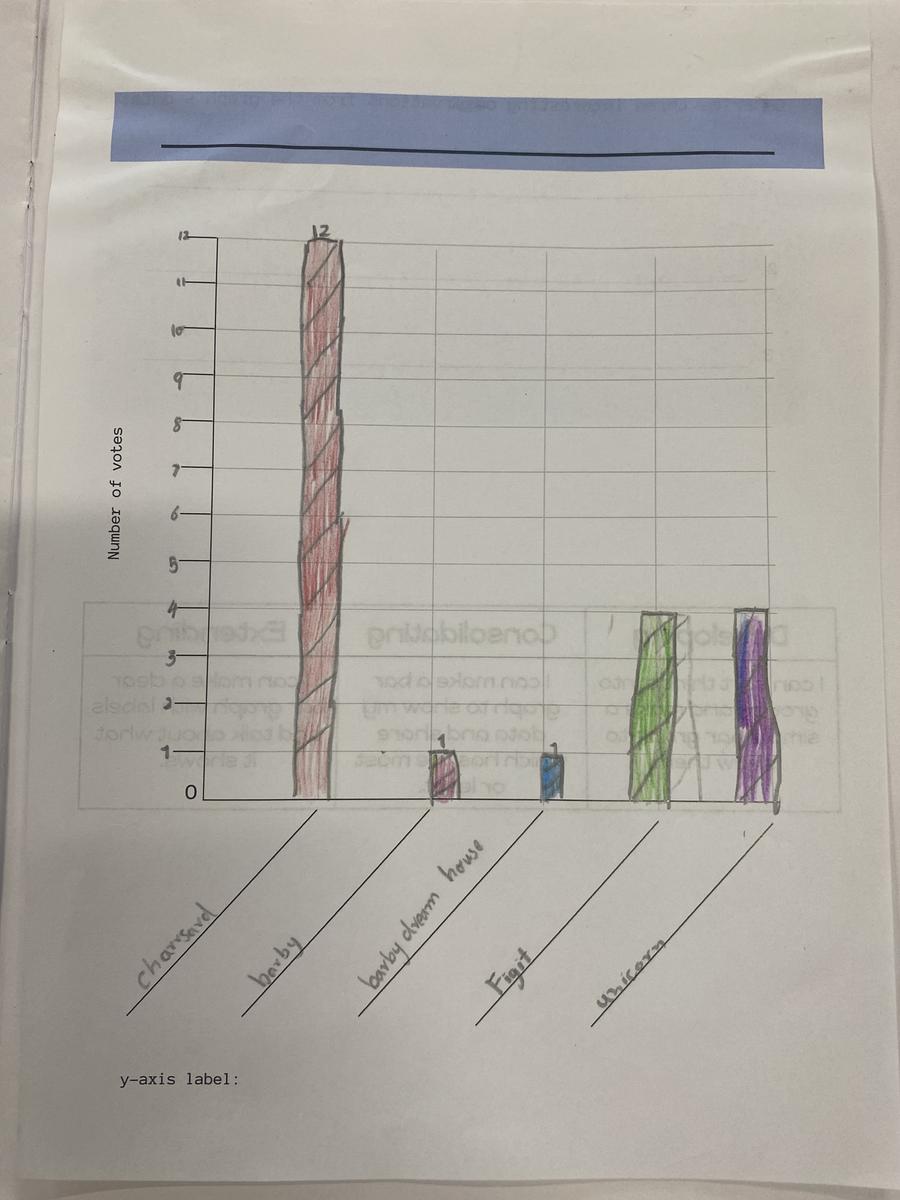
Students proceeded to fill and label their own bar graphs by organising their tally marks from their surveys and transferring them to a bar graph. Students were instructed to use the bar graph template. The template had the axis all marked up as well as the boxes outlined for the students to colour in their amount on the bar graph.
Prompts for Learning Task:
Reflection:
Students gathered on the floor to share their bar graphs. We used the prompts below to assess students' understanding of what they have organised in their bar graphs.
Reflection Prompts:
How you might like to continue learning at home:
A great way to continue this exploration of data collecting and graphs at home is to get the students to create their own surveys for the family to try, so they can practice creating clear survey questions, and record tallies!
Kind regards,
Stef, Jarryd and Rosanna
The Year 1 Team
stephanie.lampard@education.vic.gov.au
rosanna.caruso@education.vic.gov.au
jarryd.lamb@education.vic.gov.au