
Prep Bulletin

A snapshot into Maths
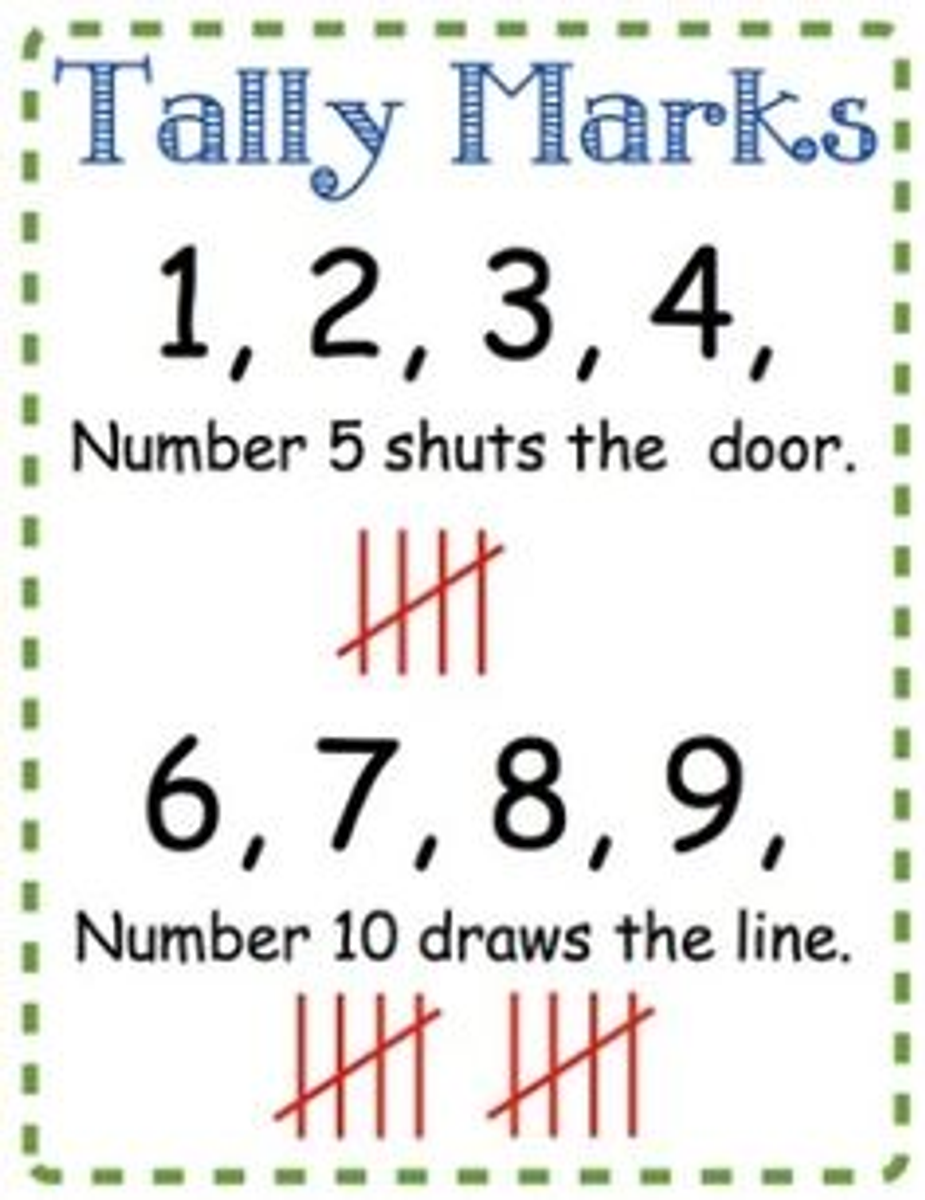
Learning Intention: To collect data by asking a question, recording it using tally marks, and showing our results in a graph.
Learning Experience Overview: In this learning experience, students developed their skills in asking questions to collect data and record information. They practised counting accurately using tally marks, organising information, and representing data in a graph.
Fluency
This week, our fluency game focused on building students’ automaticity in counting forwards and backwards from different starting points. Each maths lesson included a different challenge:
1. Class Countdown
We counted backwards together as a class, starting from 10 (or sometimes 20) down to 0. We used our fingers, a number line and counting down like a rocket ship blasting off to support students’ understanding
2. Missing Number Challenge
A counting back sequence was written on the board with one number missing (e.g. 10, 9, __, 7, 6...). Students had to figure out the missing number and explain how they knew.
3. Quick Partner Share
In pairs, students practiced counting backwards from 10, then challenged each other to try from different starting numbers, such as 15 or 8.
Whole:
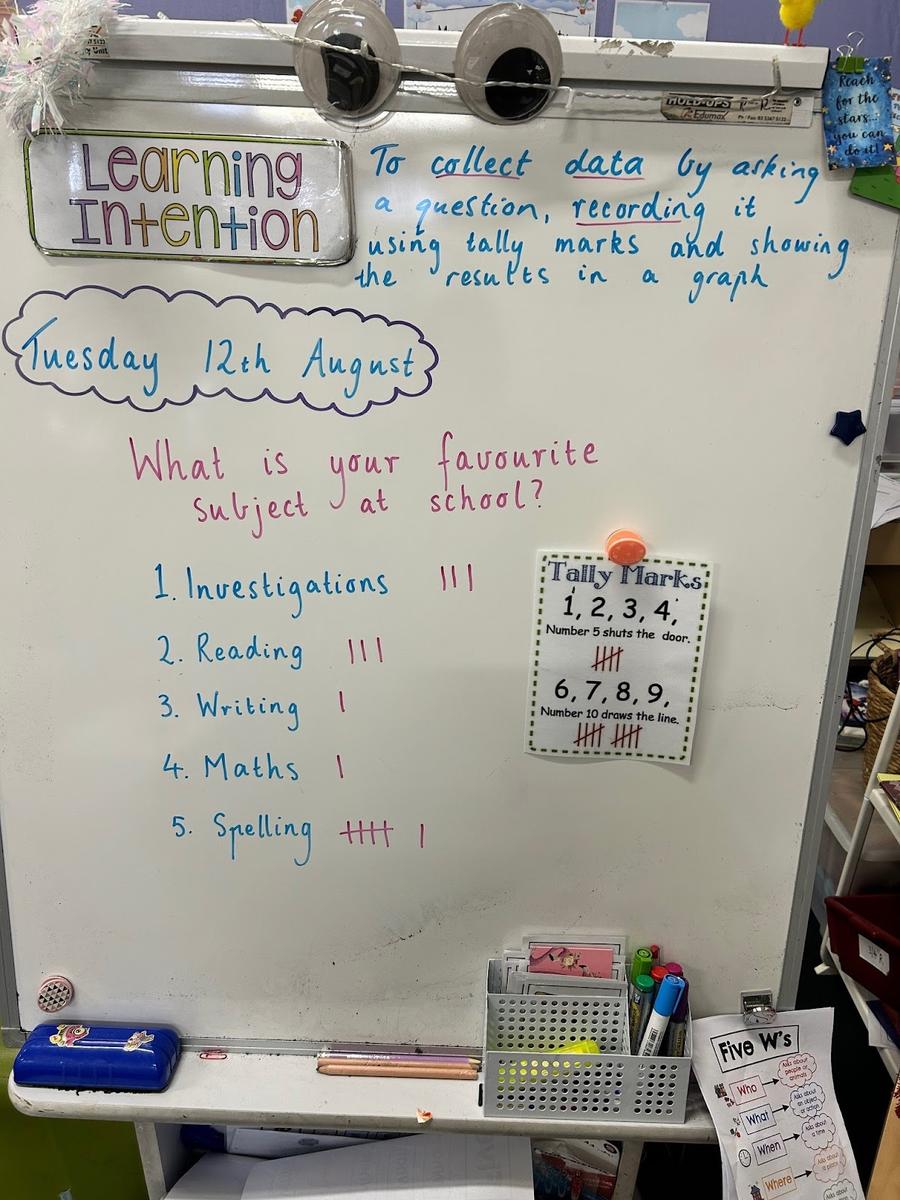
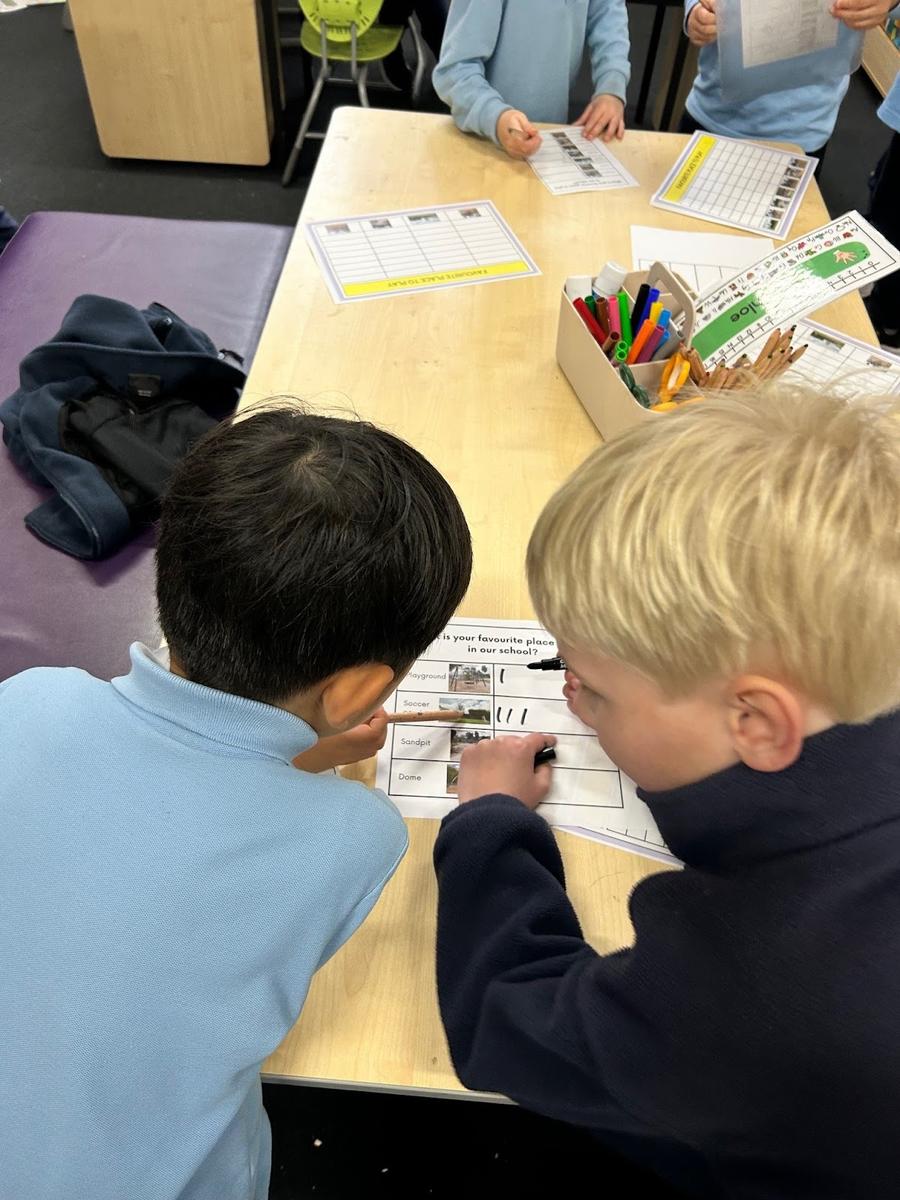
The teacher modelled the activity by asking students ‘What is your favourite subject at school?’ and recording the responses using tally marks. Using the anchor chart, the teacher demonstrated how to record data using tally marks for easier counting. Together, we discussed the results and looked at which subject had the most votes and which had the fewest. Students were encouraged to explain their reasoning.
Small:
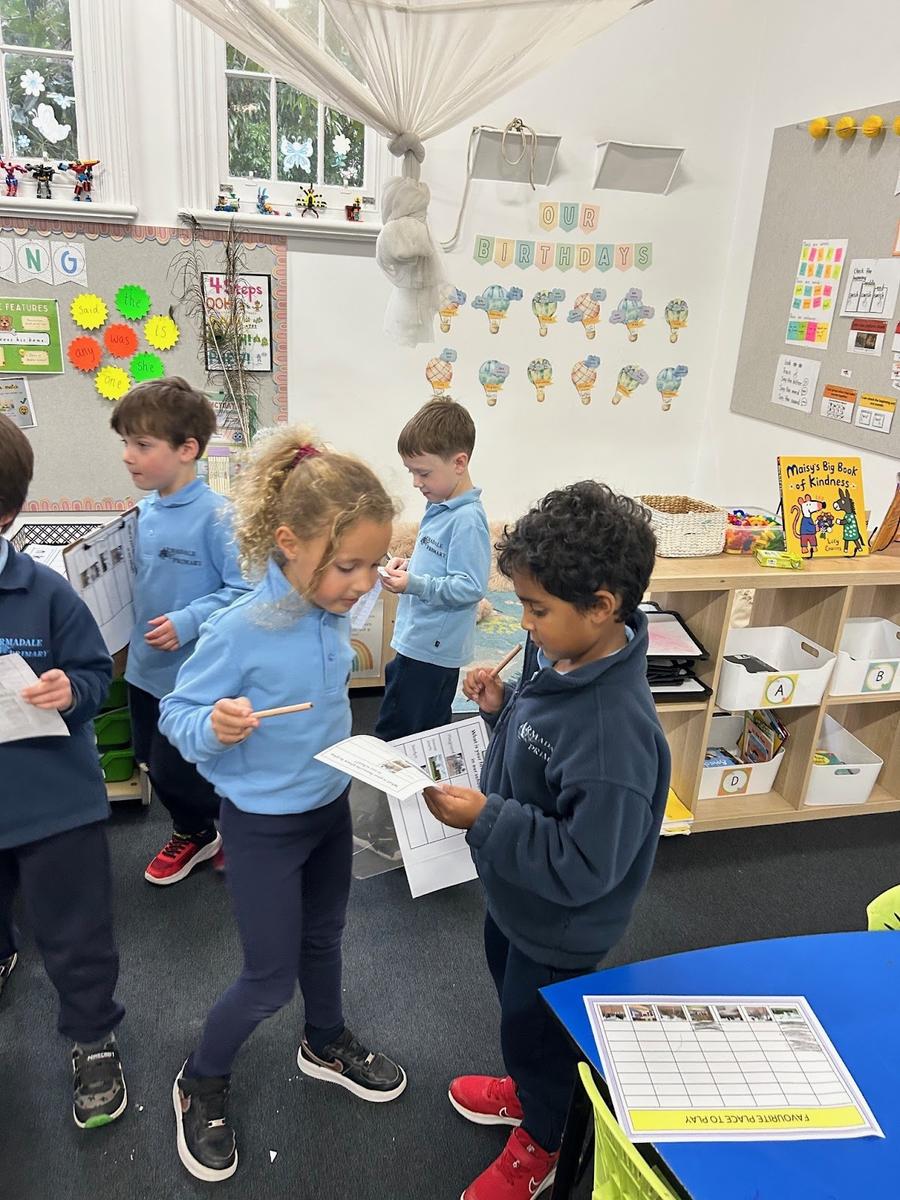
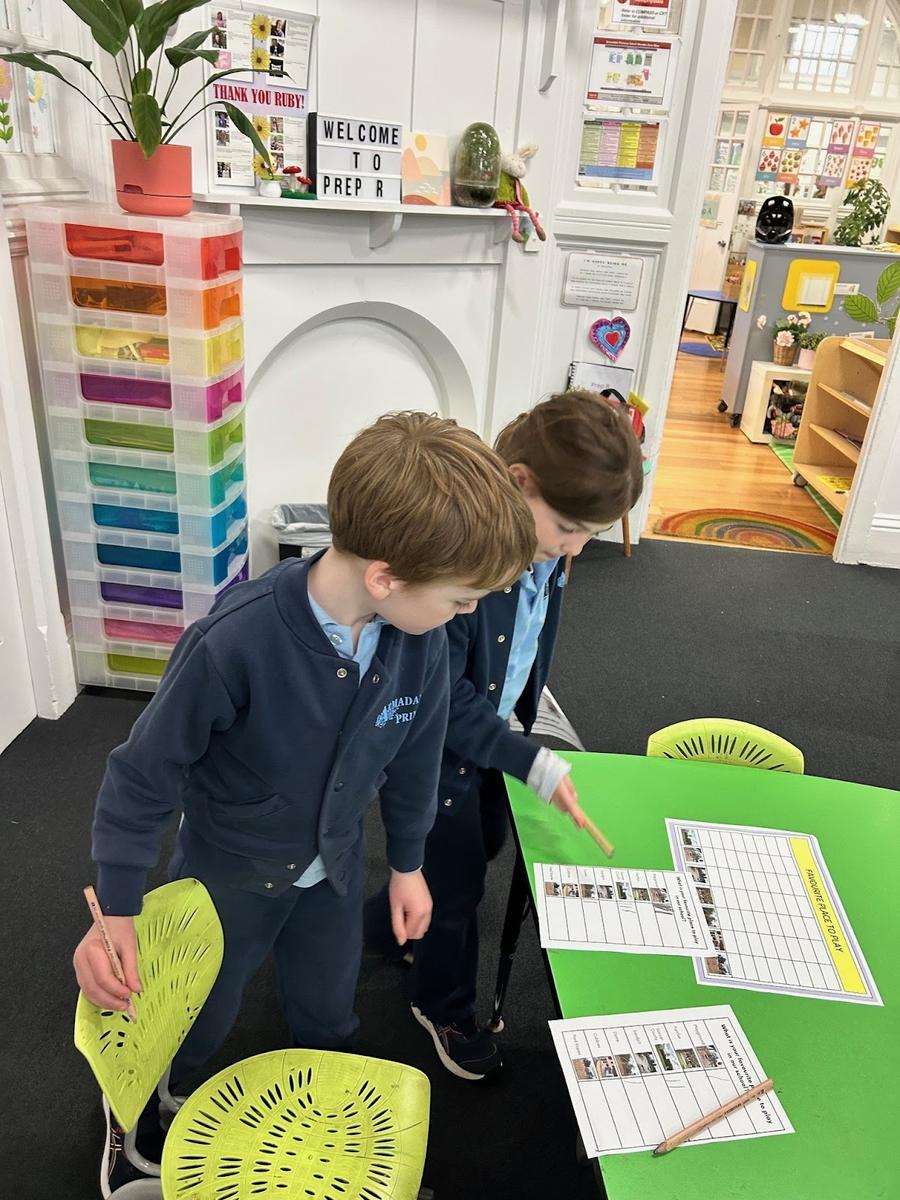
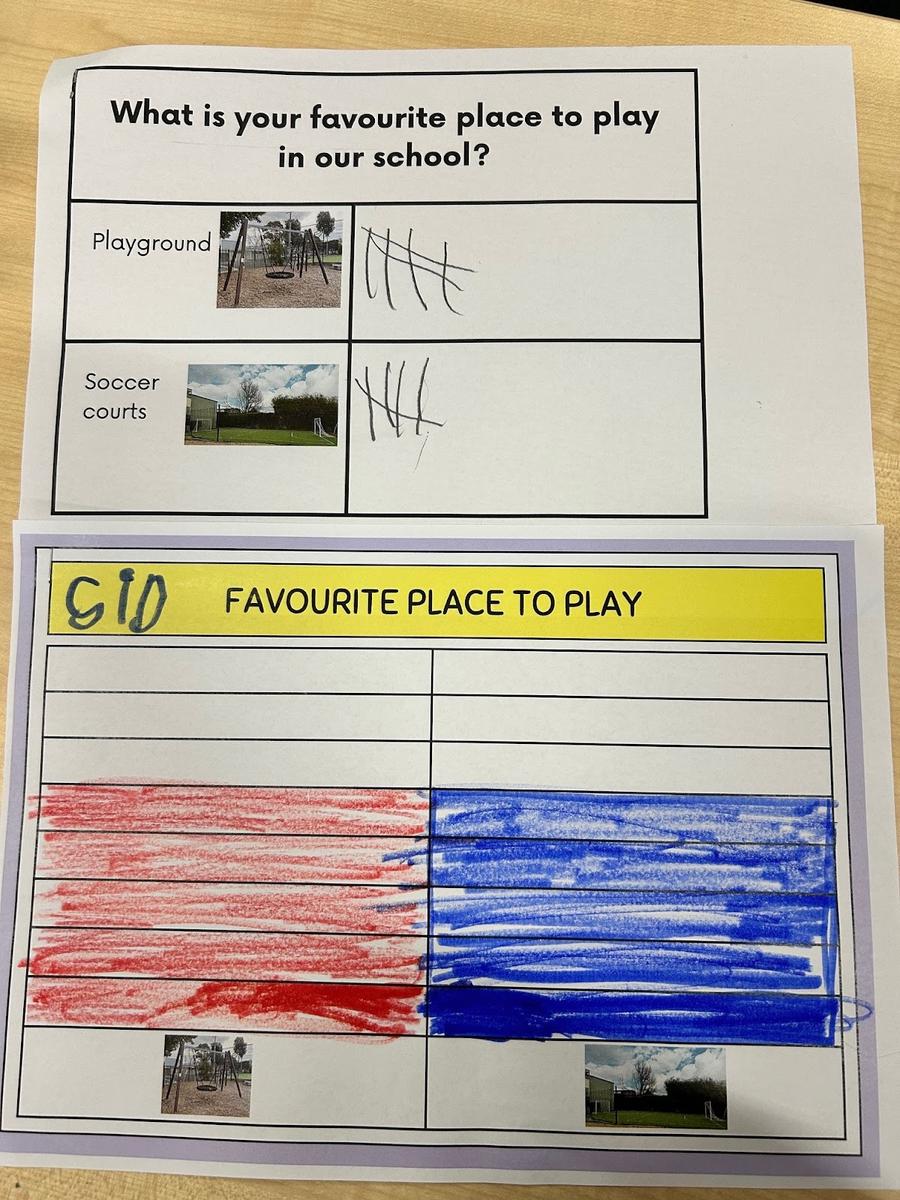
Students participated in the activity by surveying their class to find out ‘What is your favourite place to play at school?’ This question supports students to explore the different play areas within our school community, linking to our Big Idea, ‘My school is a community that has changed over time because of us.’ After recording their answers using tally marks, they represented their data in a bar graph.
Enabling:
Students surveyed their class with 2 different options to choose from.
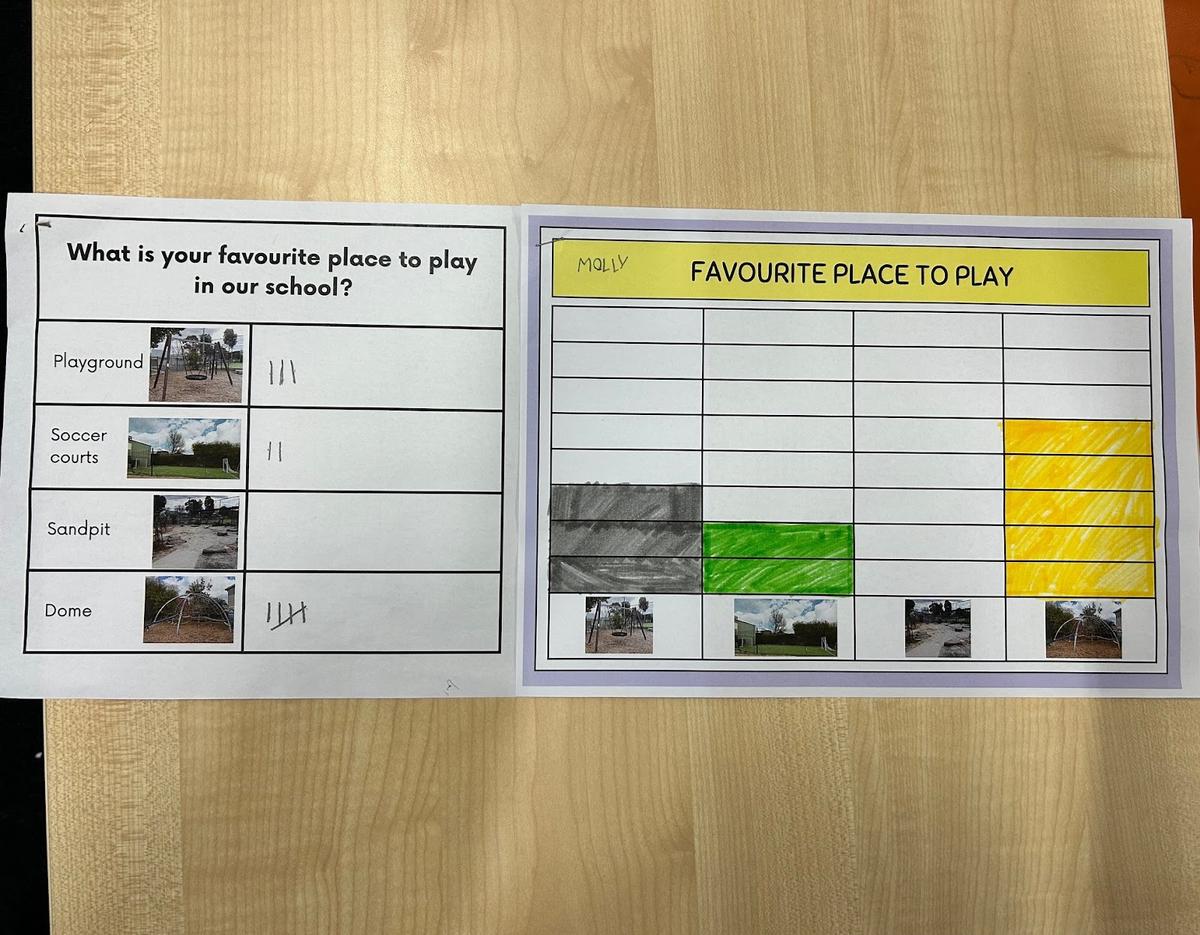
Explore:
Students surveyed their class with 4 different options to choose from.
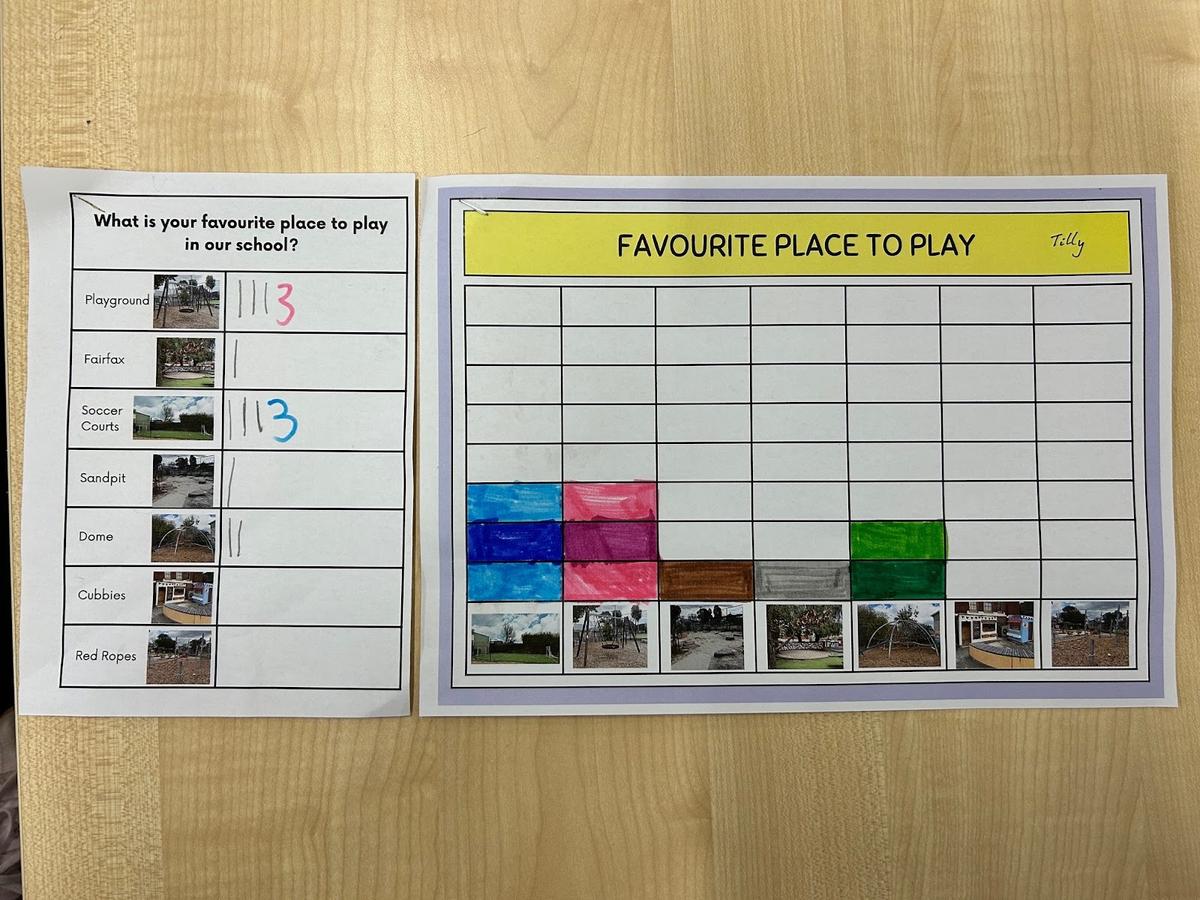
Extending:
Students surveyed their class with 7 different options to choose from.
Whole:
The class came together to discuss their findings. We explored the data represented in their graphs, identifying the most popular play areas to the least popular. Students practiced interpreting graphs by explaining how the height of each bar shows the number of votes each option received.
In this learning experience, students are working towards:
- Collecting and recording data using tally marks
- Organising and recording data through bar graphs
- Interpreting data to identify patterns and answer questions
- Communicating findings and using evidence from graphs
What you can do now to continue the learning at home from this experience:
- Support your child to complete this week's homework task to revisit these concepts
- Encourage your child to notice and talk about data in everyday life, such as people’s favourite foods or colours
- Practice asking simple questions and recording information
- Explore different ways to show information, such as drawing pictures or making simple charts and graphs
- Encourage your child to explain what their graph shows and to compare the different options
Warm Regards,
Alyssa, Ruby and Julian
Prep Team
Alyssa.Thermos@education.vic.gov.au