Hello from 6P

Interpreting Graphs – 6P
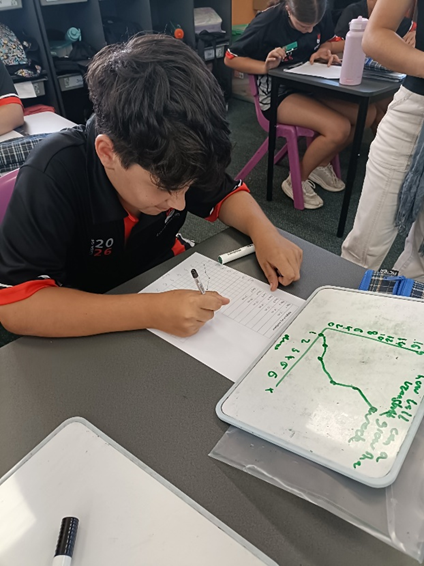
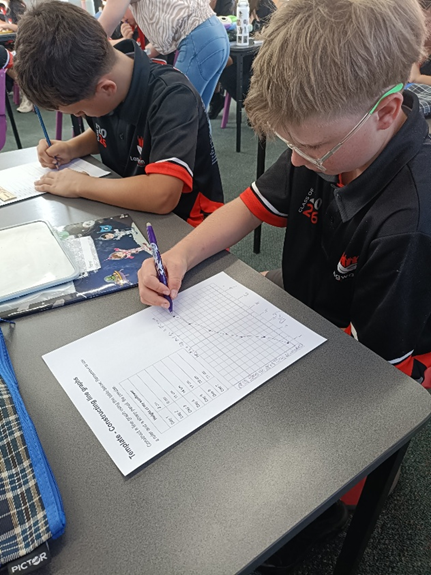
This week in 6P, students have been diving into the world of graphs and data. They have been learning to read and interpret a variety of graphs, including column graphs and side-by-side column graphs, and understanding what each part of a graph represents from titles and labels to scales and categories. It’s been exciting to see students confidently explore how information is displayed and what it means.
Students have also been applying their statistical skills by identifying the mode and range in different sets of data. They’ve been comparing results, spotting trends, and discussing what the numbers reveal. These activities have helped them see how data can tell a story and support their reasoning in everyday situations.
They’ve been asking questions, explaining their thinking, and learning to communicate their findings clearly. It’s been a fantastic week of critical thinking, collaboration, and discovering the power of graphs!