Principal Report

I am going to dedicate this month’s newsletter article to outlining the school’s improvement process as I feel like feedback suggests that this is something that we haven’t explained well to the wider community. Schools are very complex places, as I am sure everyone realises, and there are many things to address across the various year levels and subject areas and these are all happening all at once. There are also many stakeholders involved in school improvement, including the Department of Education, the Region and Network, the staff, students and parents as well as other organisations that either contribute to the school or to which the school contributes.
Recent commentary in the media would lead people to think that schools are not doing well across Australia and Victoria and much of this is being fuelled by politicians and journalists in response to the recent release of the NAPLAN data. It is important for schools and leaders in schools (i.e. me) to clearly explain that a lot of what is being discussed is not accurate and is being conflated to push various agendas (not all of which are being made clear to us). When we look at the latest NAPLAN results, there is no ‘crisis’ emerging in student achievement, in fact Victoria’s NAPLAN data shows that we are performing above all other jurisdictions in most areas of the testing and in some areas, such as Reading, Victoria’s results actually show improvement on last year, despite the nation result showing decline in all year levels except Year 9.
At the school level, our NAPLAN results show improvement across all areas of the testing on last year’s results. We acknowledge though that there is still some way to go to achieve the sort of results that we are wanting but we can see that things are starting to shift, which is encouraging. Our biggest area that we need to focus on across the college is the emphasis on growth. This means that despite where students are ‘at’ when they begin a new subject or year level, that they make enough progress across the year or semester. This then ensures that all students, regardless of their level of achievement or ability, can achieve their very best. In terms of the various testing areas, our writing results have been particularly pleasing this year and our numeracy results are where we acknowledge we need to do more. As a mathematics teacher and leader, myself, this is something that I am deeply committed to doing.
School improvement is not all about NAPLAN, however. In fact, I would argue that some of the other measures of school improvement are so much more important than how students perform on a test set by someone who knows nothing about them on one day of the year every two years. I would argue that how a student feels about being at school, how safe they feel and how connected and secure they feel are far more important indicators of success. How much support students feel that they are receiving to achieve what they define success to be (and I am yet to meet a young person who feels that scoring well on NAPLAN is anything that they aspire to), or when they are experiencing challenges and difficulties is crucial for their ongoing development across cognitive and socio-emotional areas and so crucial for learning as well. And so, here at Heathmont, we pay a lot of attention to the data sets that give us more insight into this including some of the surveys that the Department of Education push out, but also data that we have developed here at the school. The following is a summary of some of the main data sources that we use to tell us what students are thinking and feeling about their time here at the school:
From the Department
The Attitudes to School Survey (AToSS) is delivered each year to all students across the college. This year, our data shows some improvements on last year but these are minimal and we are working to find out more (outlined below).
At the school level
We have a number of ways in which we get information from students about their experiences including:
- School wide student feedback survey. Across all classes, teachers are using a survey tool to collect feedback from students about their experience of the classroom and the teacher’s instructional techniques. This survey has been developed by our very own Mr Geoff Matheson based on feedback that a team of teachers that he led last year have collected from students about the types of teacher behaviours that they think help them to learn best and feel most comfortable in the classroom. Teachers use the results of these surveys in their Professional Learning Communities to reflect on their practice and to develop strategies for improvement.
- Student focus groups. The coordination team are currently arranging to conduct student focus groups around the AToSS data which we have now received and analysed to find out more about what students are wanting and thinking when they respond to this survey. The intent is to find out more about what it is that we need to do to improve things for students.
- Surveys and other feedback mechanisms that are used to get data around specific issues or subjects, so for example, Ms Ling and the Year 7 team have put out requests for feedback recently on the Year 7 class construction model that we are trialling this year with that cohort. The Year 10 Mathematics teaching team are also currently asking students what questions they have about finance to better target student interests in the planning of the next unit of work (something that they identified in the student feedback survey as needing improvement).
- Learning walks – staff have been engaging in learning walks across the college as part of their professional learning. Every teaching staff member meets each fortnight with me for a professional learning session where we discuss how we can best improve our practice and support students to develop good learning behaviours and habits. Often, as part of this process, we conduct learning walks to observe what is happening in classrooms and then use these observations to make adjustments to what we do. Recently, the staff engaged in learning walks to find out more about how laptops and devices were being used in classrooms and whether they are being used to enhance learning or if they are detracting from it. The results from this study, I discuss in a later article in this newsletter. We have also had external experts come in to the school and support us by observing classes and talking with students about their learning. An example of this is the mathematics faculty who is currently working with Leonie Anstey from the MAV who is supporting the teachers to investigate their practice and improve their teaching and student learning across the school.
In addition to the data that we get form students about their experiences, we also collect data from parents about theirs. Most recently, I have been sending out invitations to participant in the Department’s Parent Opinion Survey. This also is sent out each year and we usually don’t get much of a response (last year 39 families responded). This year I have pushed it a little harder and we have had a much better response with 80 families responding as at the time of writing this report, which is a significant increase. The responses we get from this help us to understand what your experience is like and allows us to identify areas where we can focus to help improvement. One such area that is coming through in the data is that parents do not feel as though the school supports them well to contribute to their children’s education. This is something that we would like to see change but we need more information about what this means and what it is that parents would like us to offer. I will be circulating around the campus on Parent Teacher Interview Day next week and seeking ideas from families about this in an attempt to identify potential actions we can take. We will also be including improvement of our relationship with the wider community and parents and guardians in next year’s Annual Implementation Plan so expect to hear more about this in future. If you have ideas but do not get the chance to speak with me on that day, I would also encourage you to send them straight through to me at Kerryn.sandford@education.vic.gov.au.
So how are we tracking?
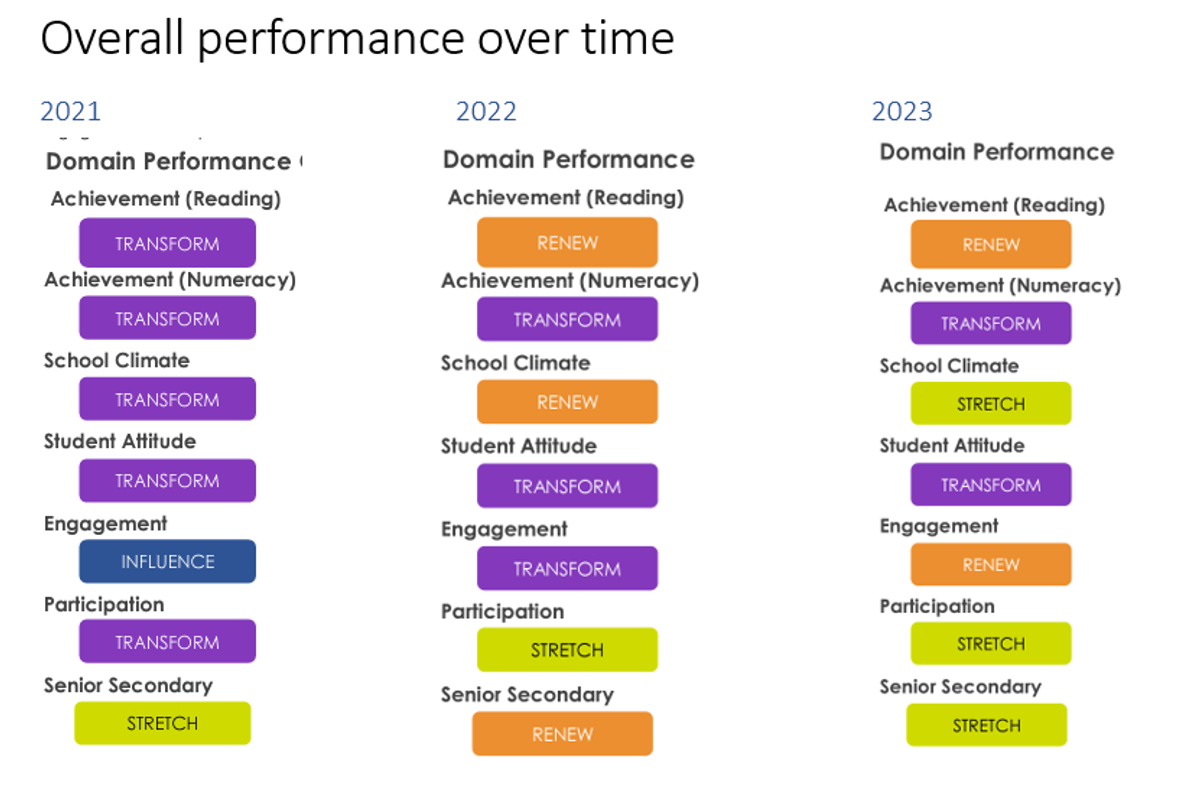
Each year, we receive a ‘report card’ from the Department on how the school is doing against several measures including those outlined above. When we underwent our review in 2022, the school was considered to be at the lowest level of attainment for schools across most levels. In the two years since, that has changed. This year’s data has not yet been released (we expect it towards the end of this term) but my analysis of the data that has been received is that we have further improved against each area, based on last year’s data. The following graphic outlines this improvement. Whilst we are not where we want to be YET (essentially, we are aiming for the blue across all areas – this is the top band of achievement) we are making good progress.
Further information will be published at a public meeting in term 4 where I will be presenting our data report card to the school community. If this is something that interests you and you would like to further contribute, I would encourage you to come along and ask questions or provide some ideas. I will be publishing details early in Term 4 so please keep an eye out for this.
My next principal report may be coming to you from somewhere in Central Australia as I will be attending our Year 10 Central Australia tour. If not, it will be written by the Assistant Principal team.
Kerryn Sandford
College Principal