Visual Arts & Technologies
Head of Visual Arts - Mr Michael Kapadia
Head of Technologies - Mr Peter Steele

Visual Arts & Technologies
Head of Visual Arts - Mr Michael Kapadia
Head of Technologies - Mr Peter Steele

Article by Michael Robertson, Technologies Teacher
Over the past few months, our Year 12 students have been hard at work completing their School-Assessed Tasks (SATs) for both Software Development and Data Analytics, leading to some incredible results!
These projects saw students put the Problem Solving Methodology (PSM) into action, applying the four key stages of, Analysis, Design, Development, and Evaluation to create innovative digital solutions.
Software Development
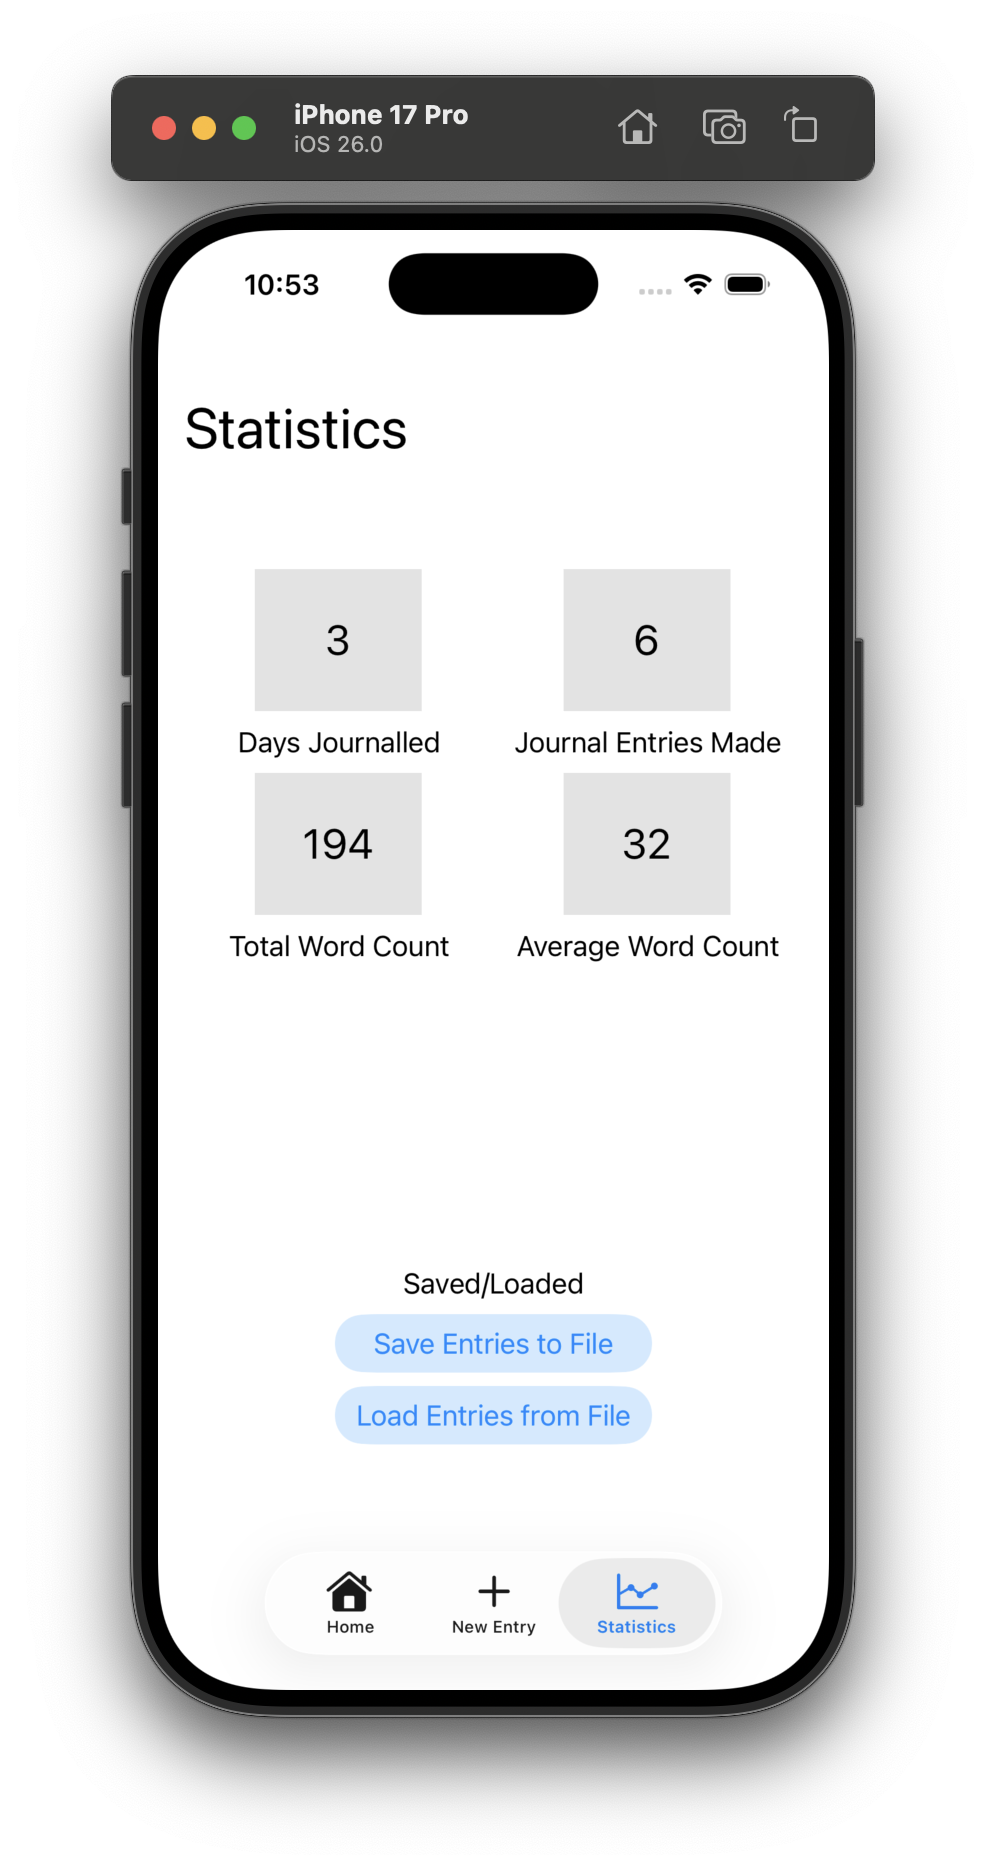
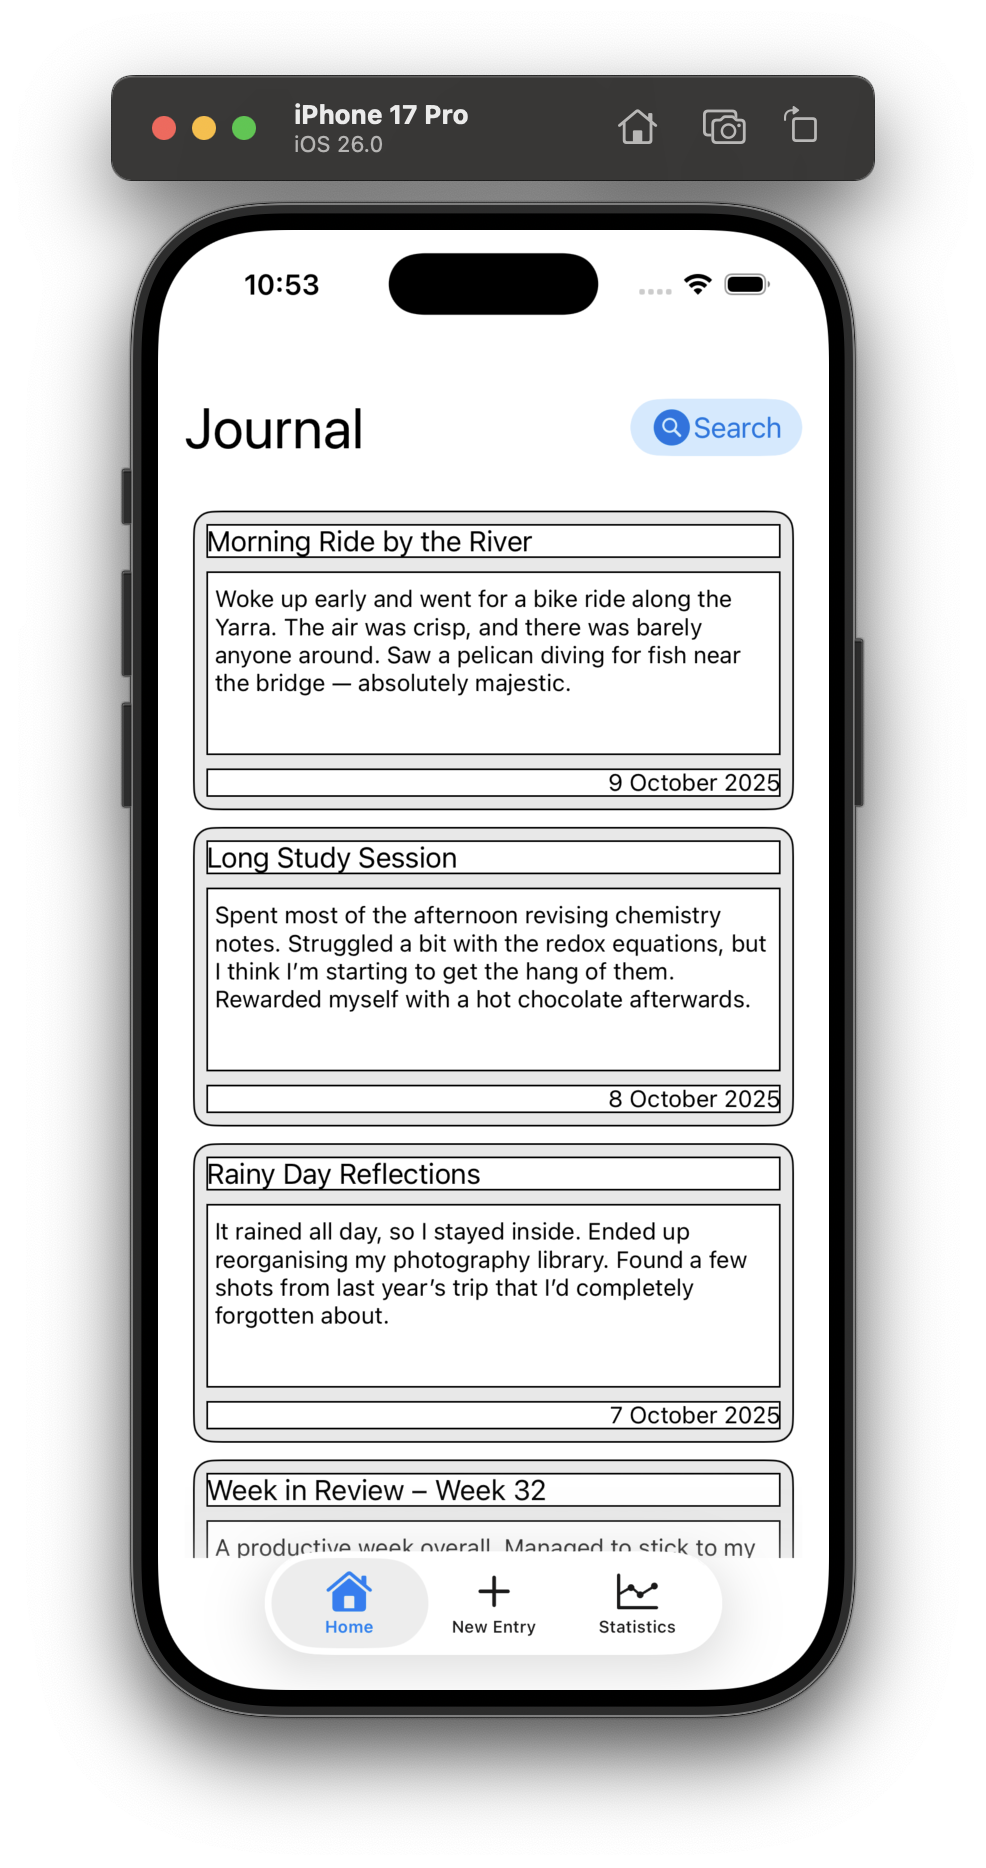
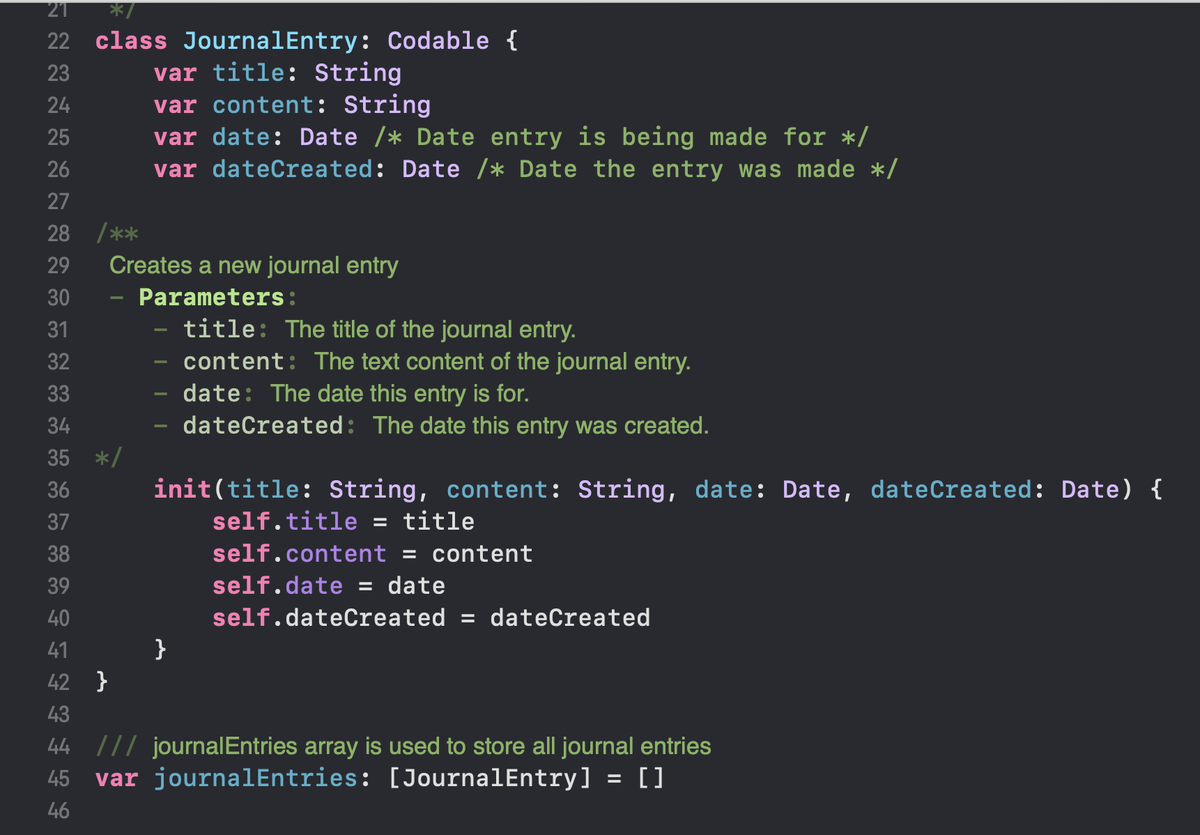
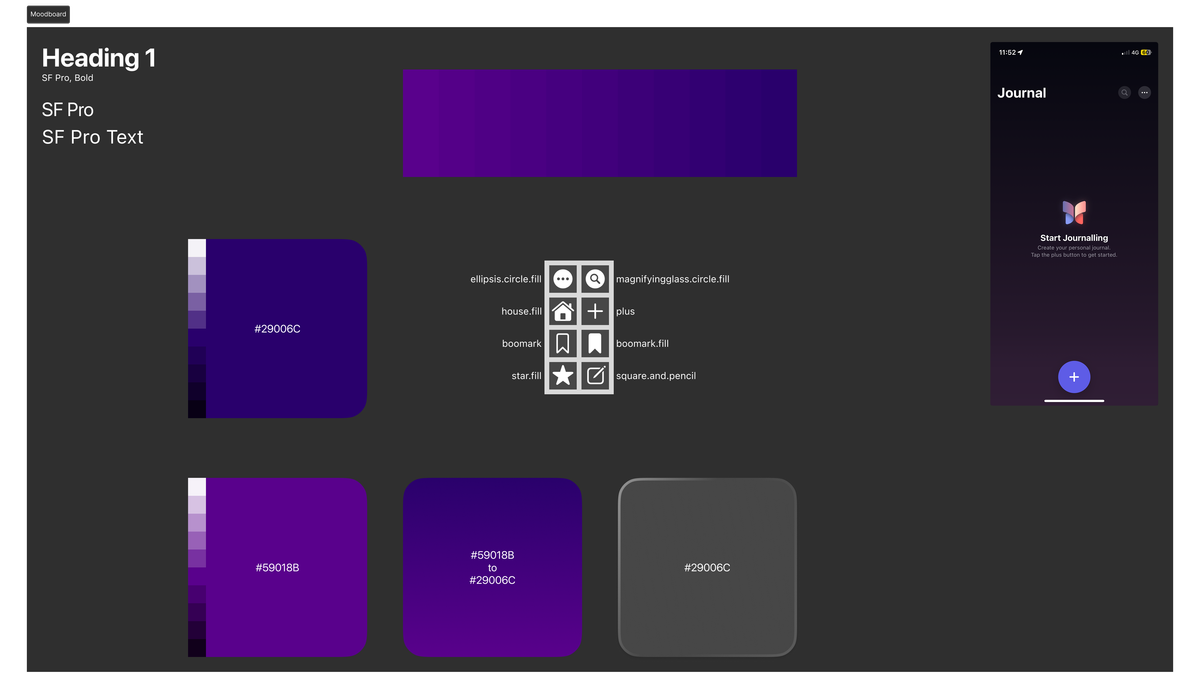
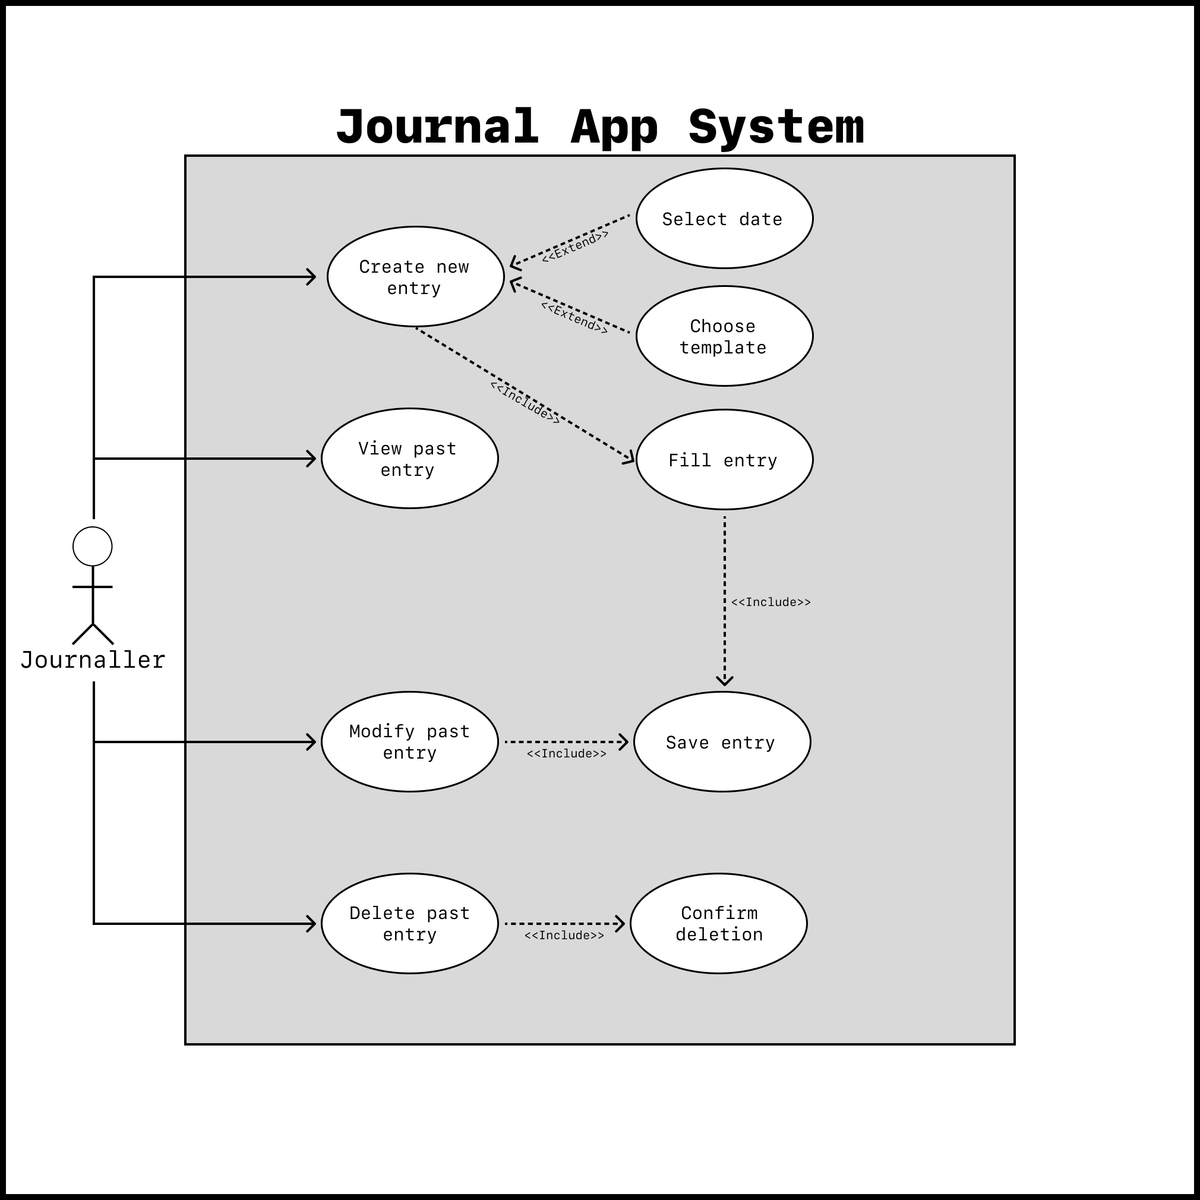
In Software Development, students took on the role of developers, each working with a client with a problem to develop a digital solution in the form of an iOS or macOS app through the programming language Swift.
The process began with planning through Gantt charts, followed by interviews and data gathering to fully understand their client’s needs. Students then analysed their findings to define the project’s requirements and began designing detailed storyboards, pseudocode, and data dictionaries to map out how their solution would look and function.
Then came the hard (and fun!) part, development! Students brought their designs to life through lines (and lines!) of code, before thoroughly testing and refining their programs. Each project concluded with an evaluation, including beta testing with clients and users, and a final reflection on both their product and process.
Project solutions included:
A journalling application for creating reflective journals with summaries
A team management application for organising players and fixtures
A health and fitness tracker to monitor wellbeing and exercise goals
A LEGO inventory management system for collectors to catalogue and track their builds
Data Analytics
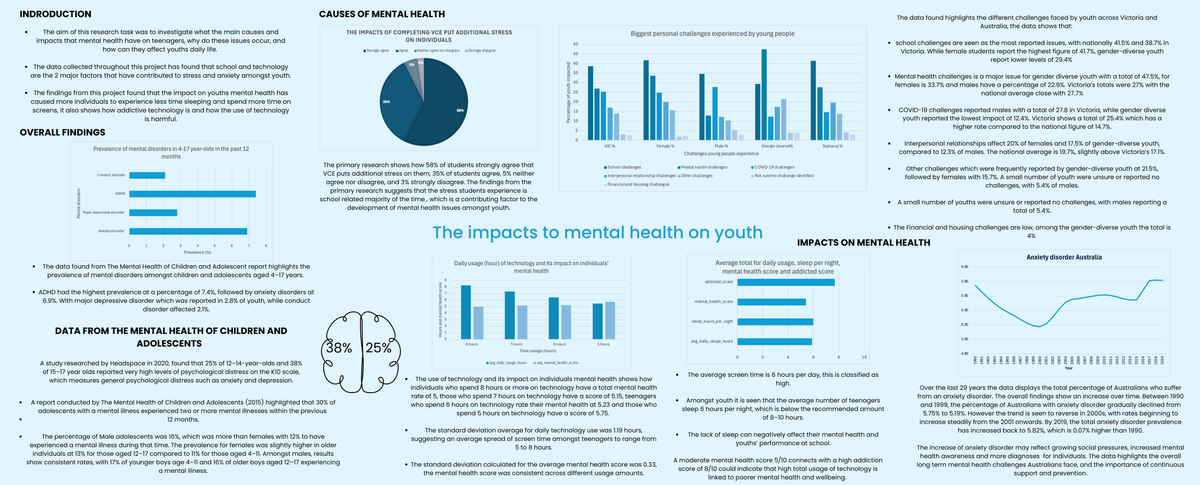
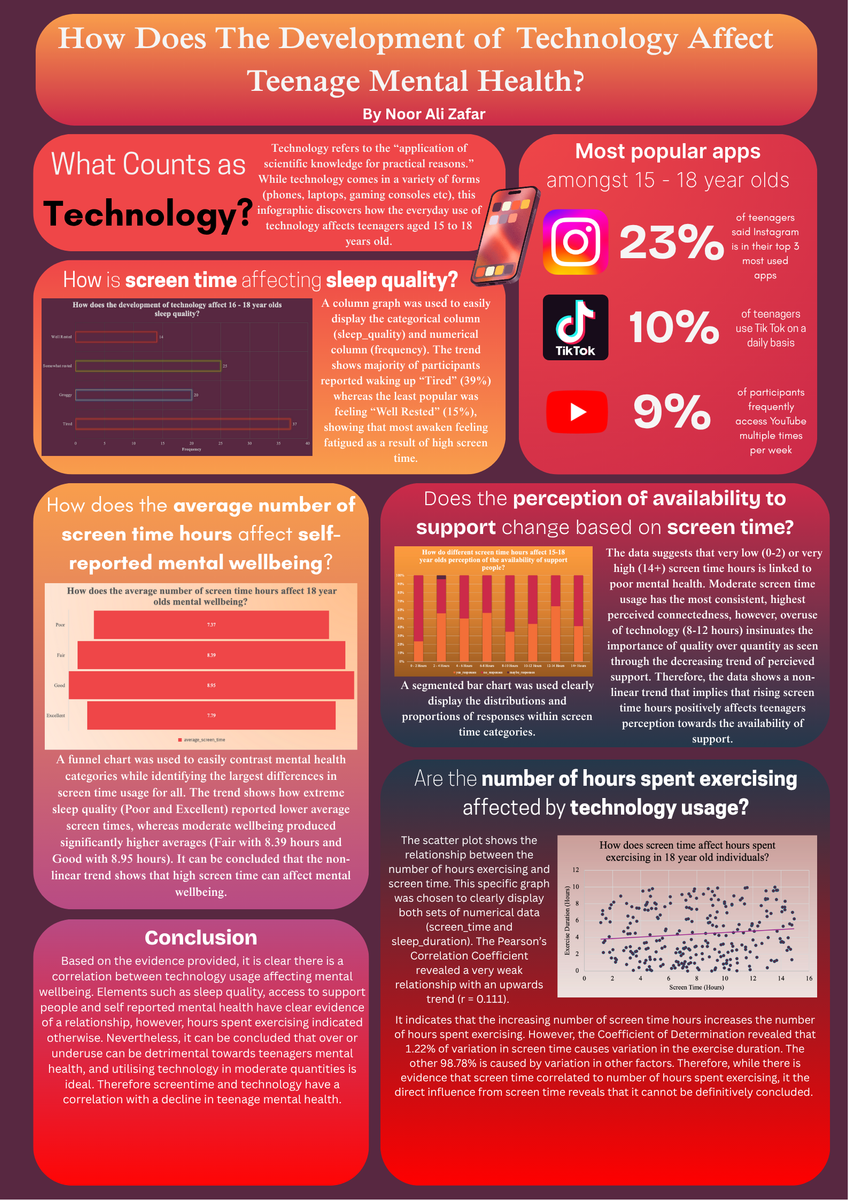
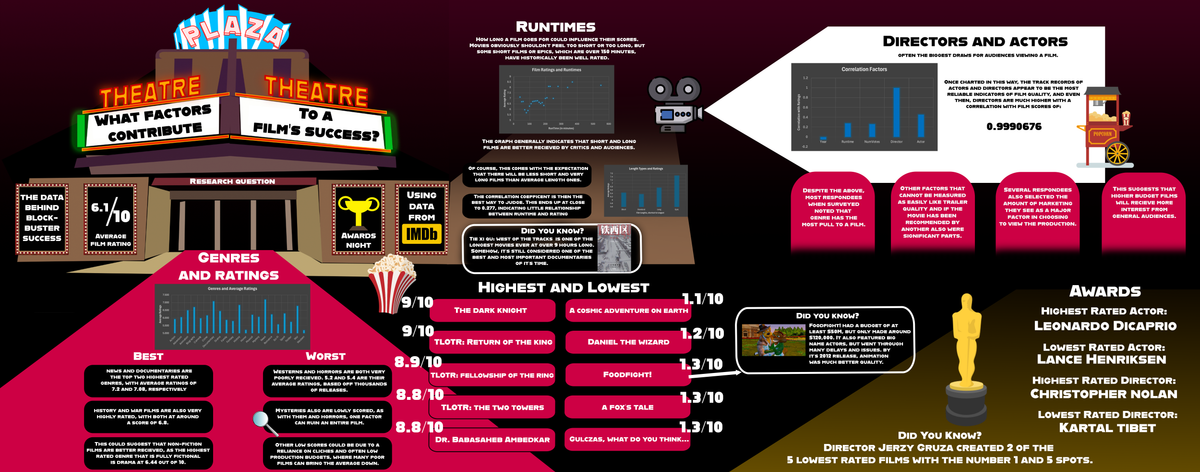
Meanwhile, our Data Analytics students set to answer a research question by exploring complex data sets to uncover insights and tell compelling stories through visualisation. Their task was to design and develop either a static infographic or a dynamic visualisation (interactive display) that showed their findings in an informative and summative manner.
Students began by brainstorming areas of interest and refining their inquiry questions through research. They then developed project plans and Gantt charts, defined requirements, and began gathering and preparing data from surveys, interviews, and secondary sources.
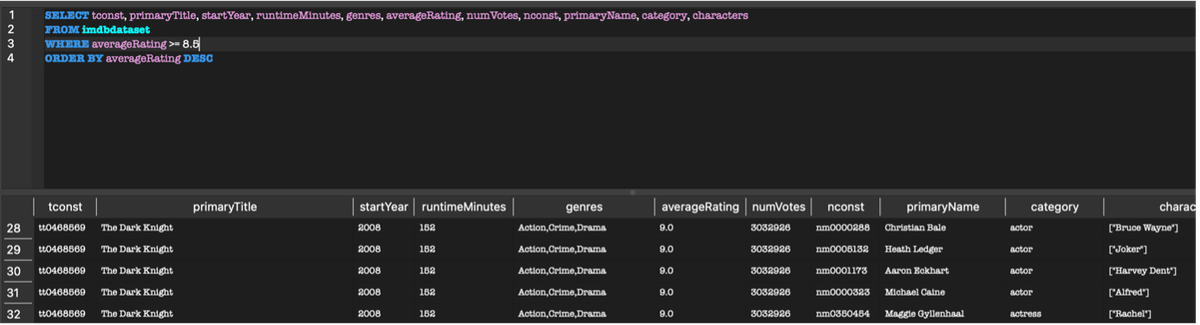
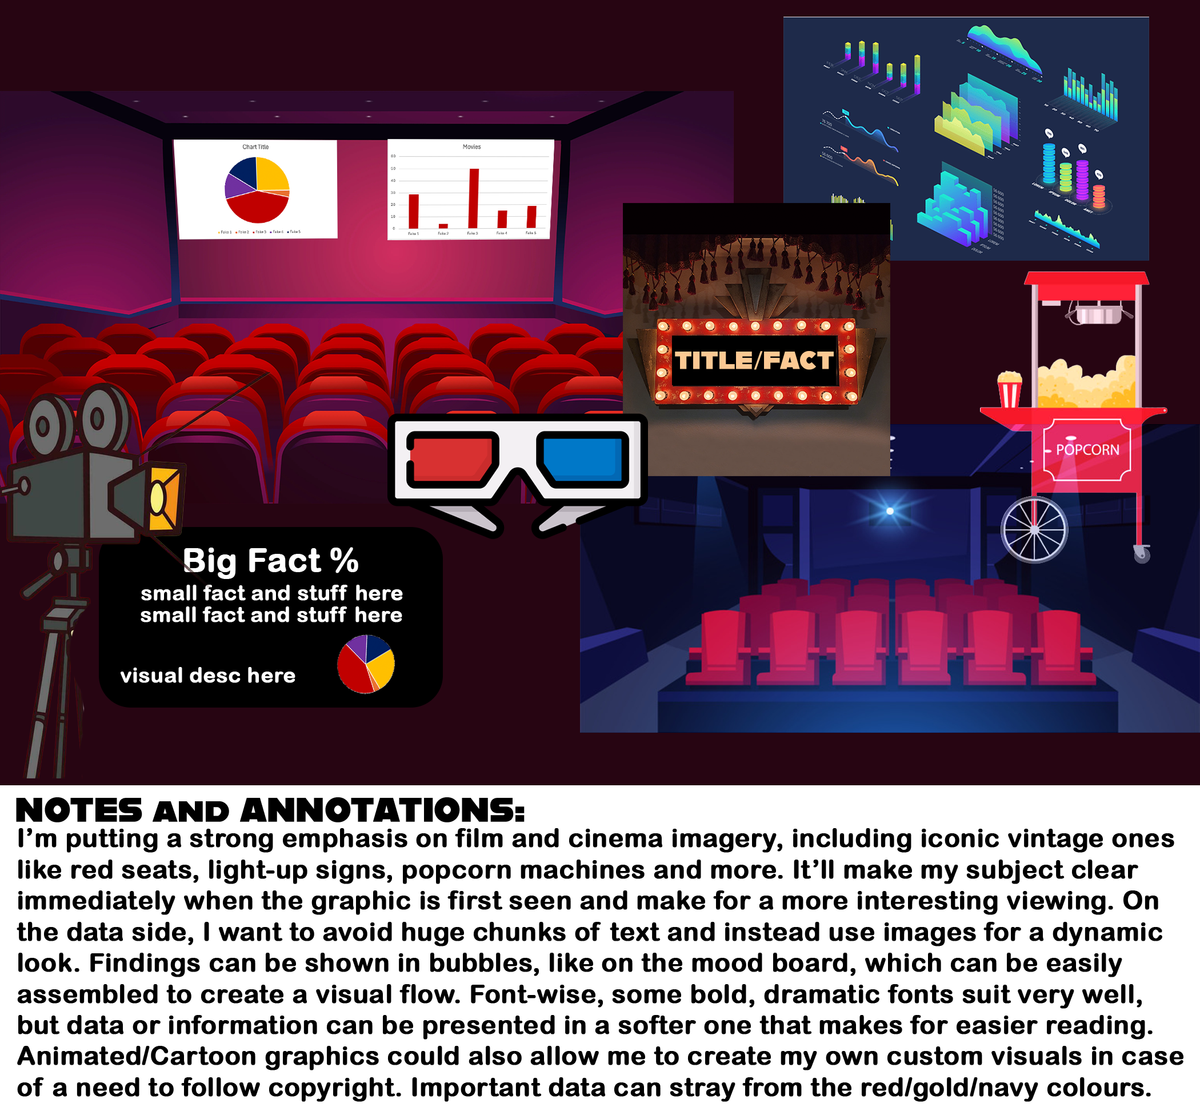
Their designs included annotated mock-ups, query designs, and IPO (Input-Process-Output) charts, all helping to visualise and plan both how they would store and manipulate data to then display this data clearly and effectively. The development phase involved developing SQL to store, manipulate and extract data for calculation and analysis. All of these (incredibly deep and large!) datasets and calculations then are summarised and shown through engaging visuals to communicate their findings. Each project concluded with a user evaluation to test how effective and efficient the visualisation was in answering the question.
Research topics included:
How do different factors contribute to a film’s success?
What is the preferred form of transport among commuters, and how is it influenced?
How does social media use impact teenagers?
These projects were a fantastic showcase of creativity, critical thinking, and technical skill, giving students the opportunity to apply their knowledge through their projects. The process has been an excellent opportunity to undertake with amazing results being shown through hard work and innovative ideas.