Mathematics

CURRICULUM FOCUS
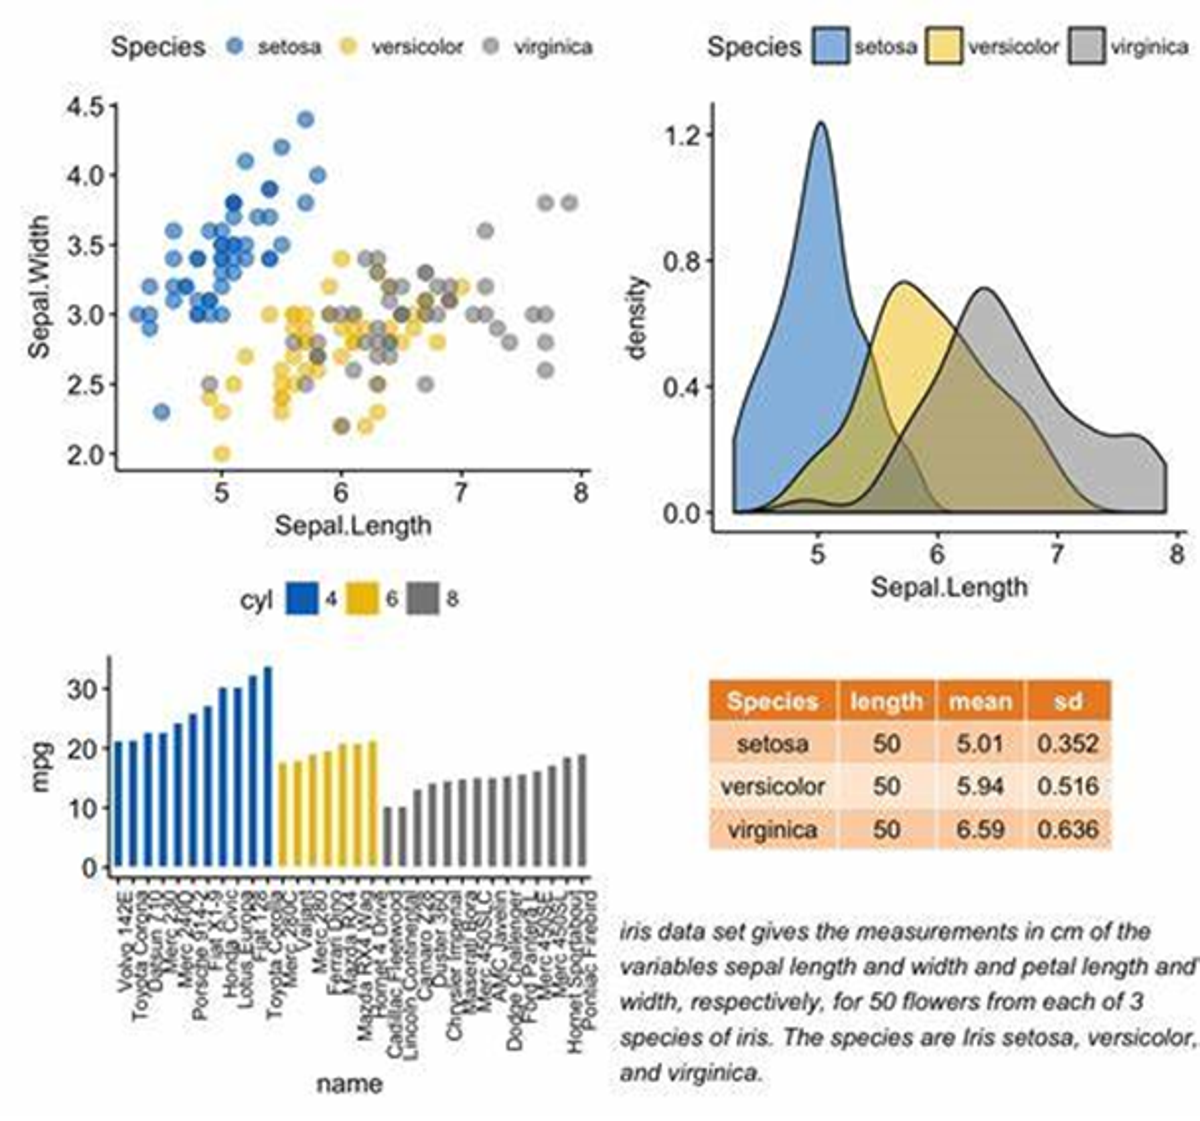
We are learning to construct, compare and analyse data displays.
VOCABULARY
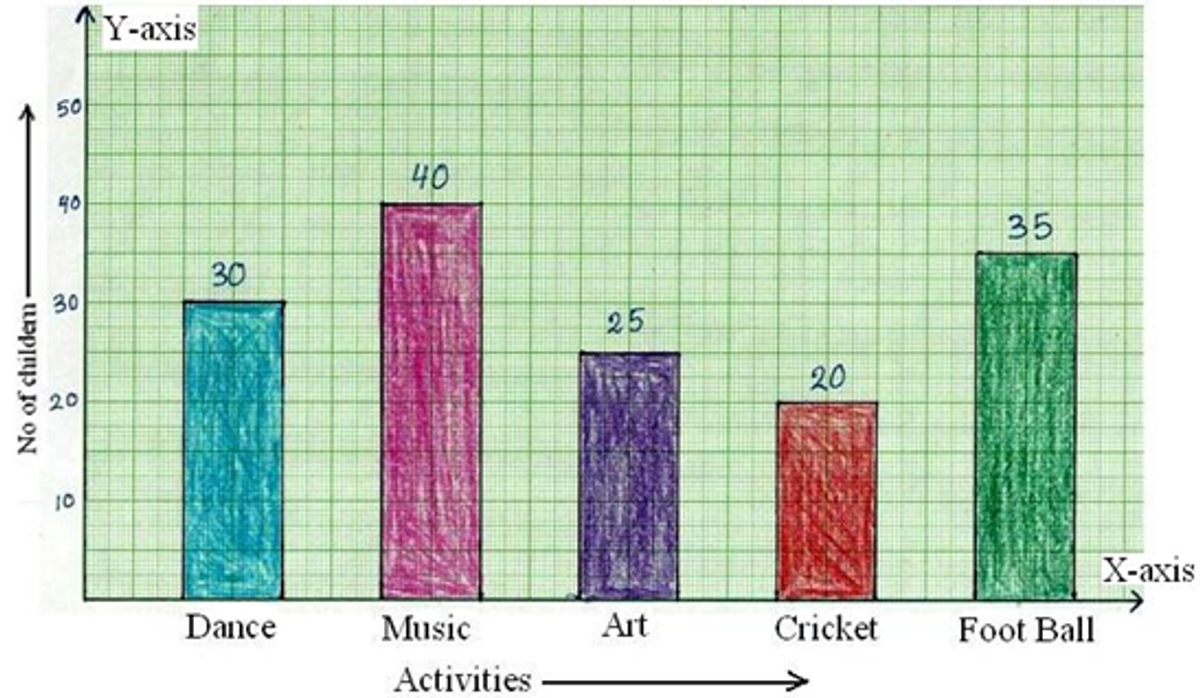
A bar graph is a specific way of representing data using rectangular bars in which the length of each bar is proportional to the value it represents. It is a graphical representation of data using bars of different heights.


