Years Three/Four News
Data Representation

Years Three/Four News
Data Representation
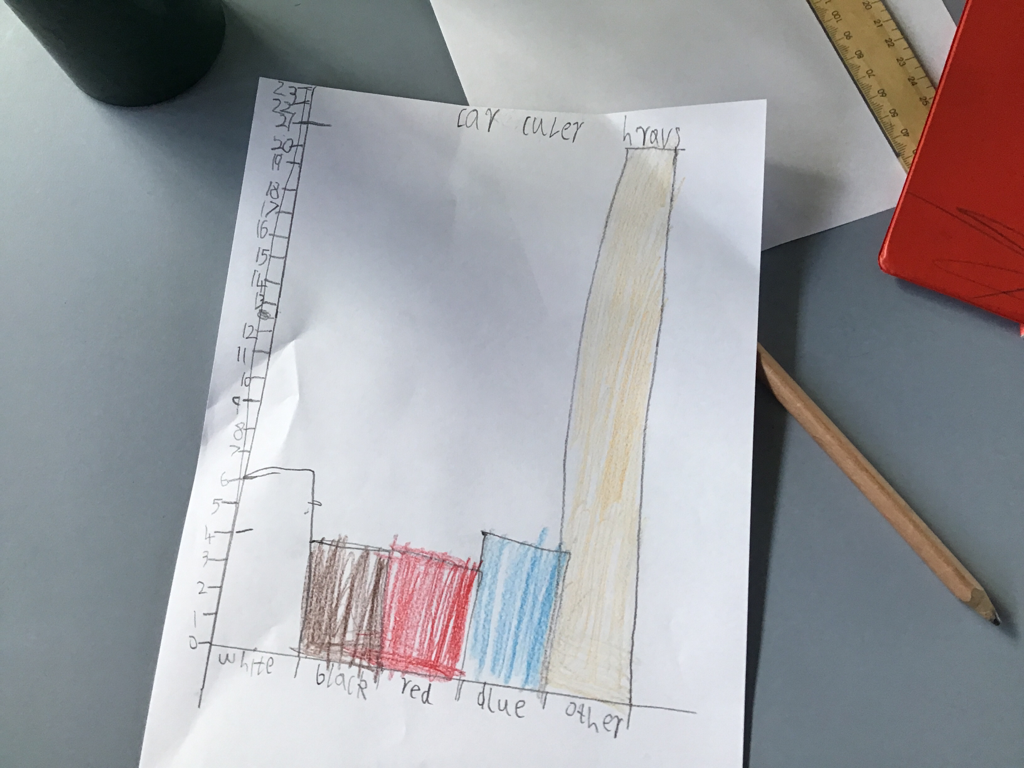
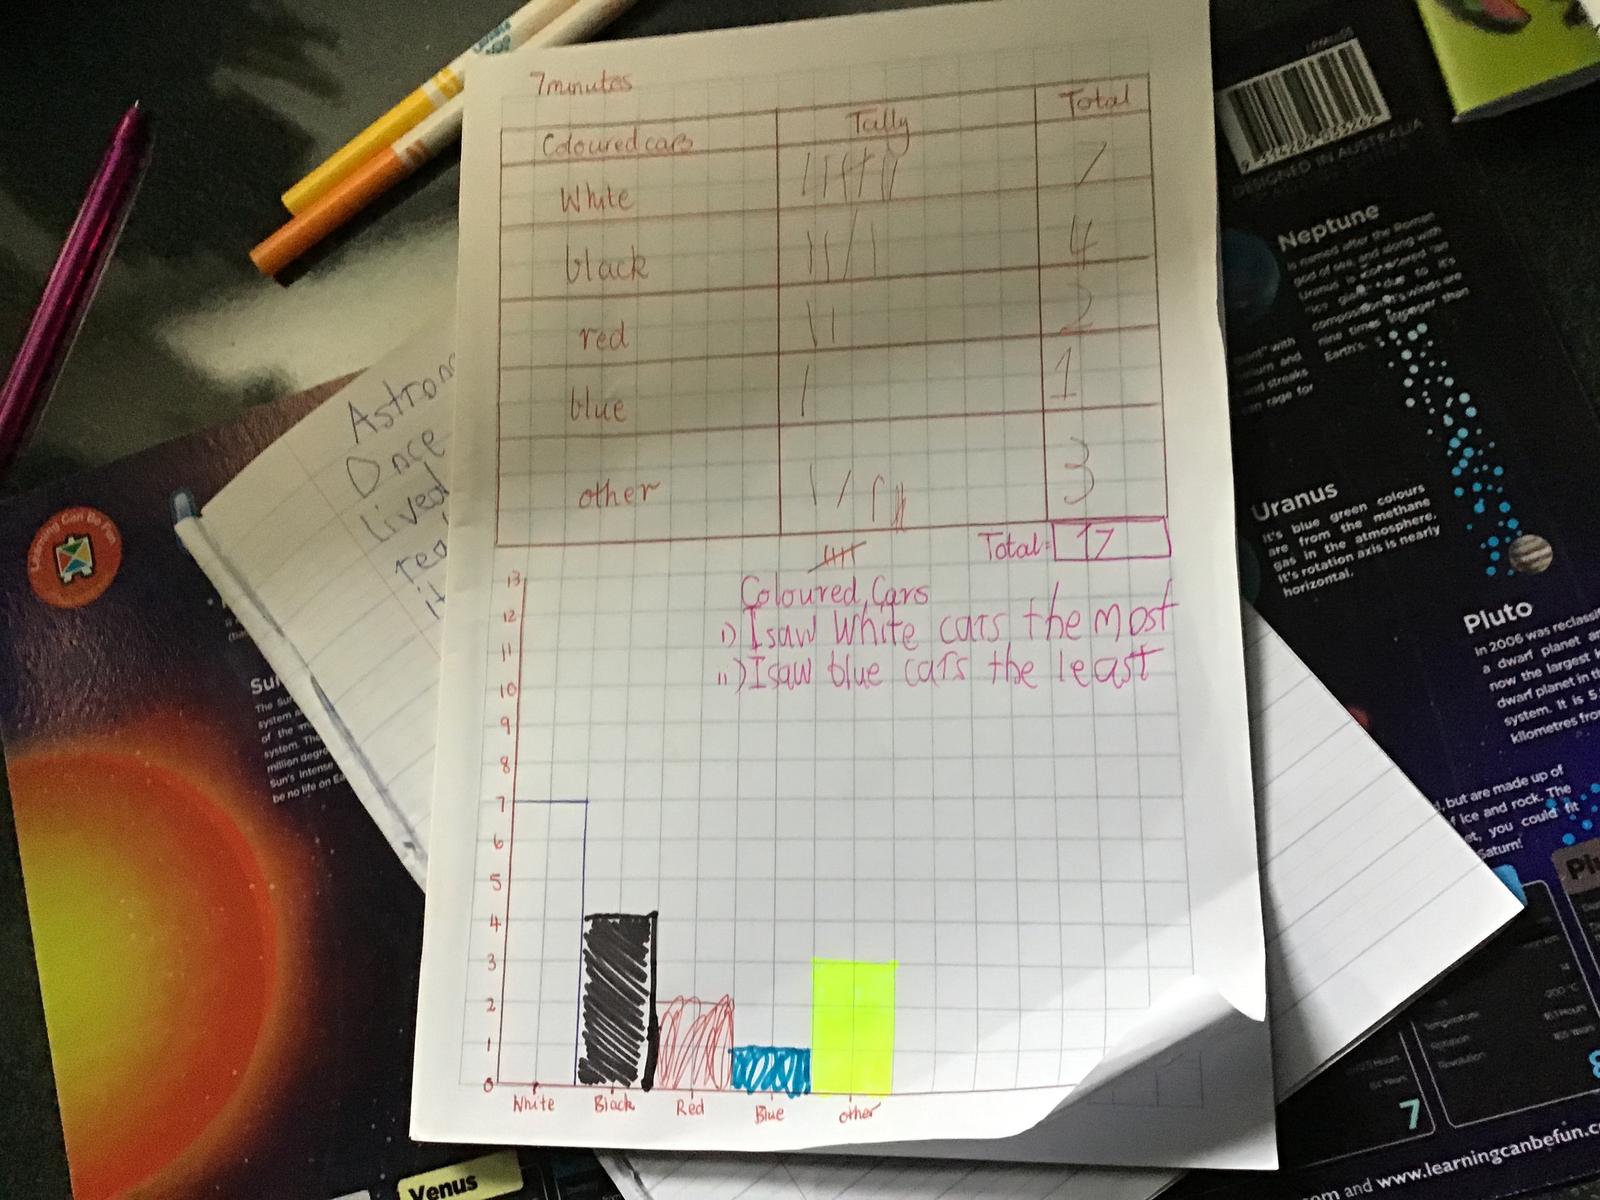
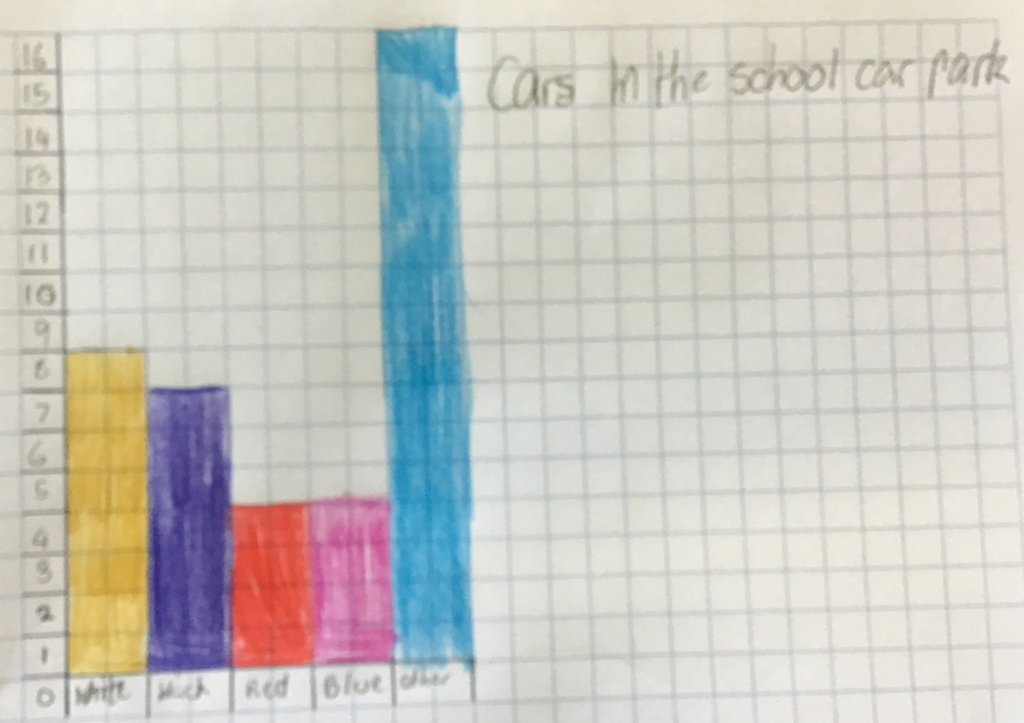
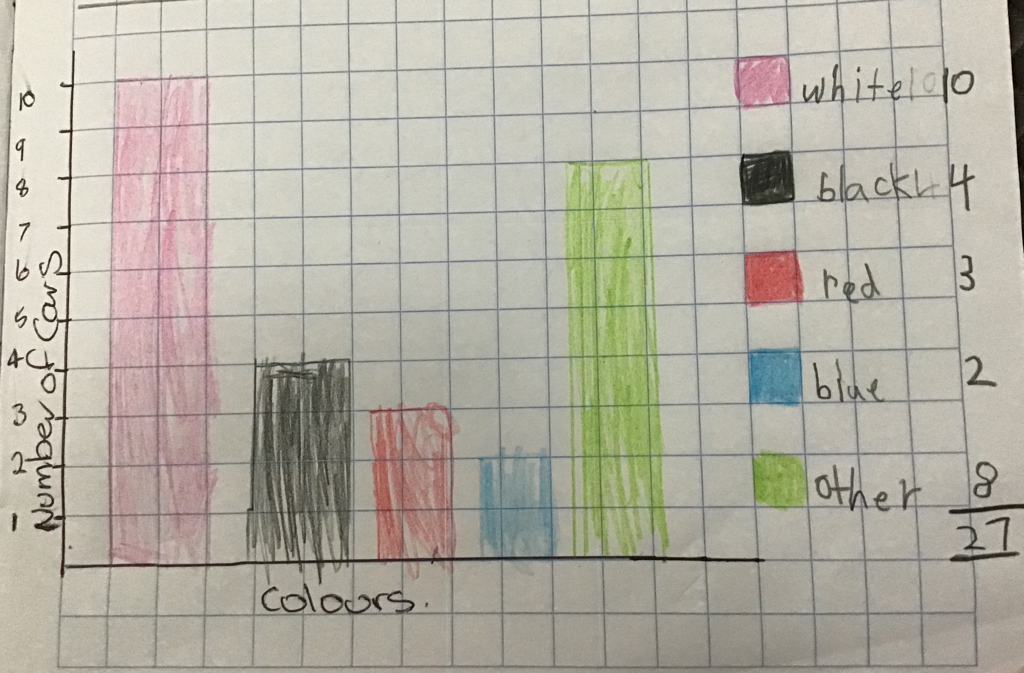
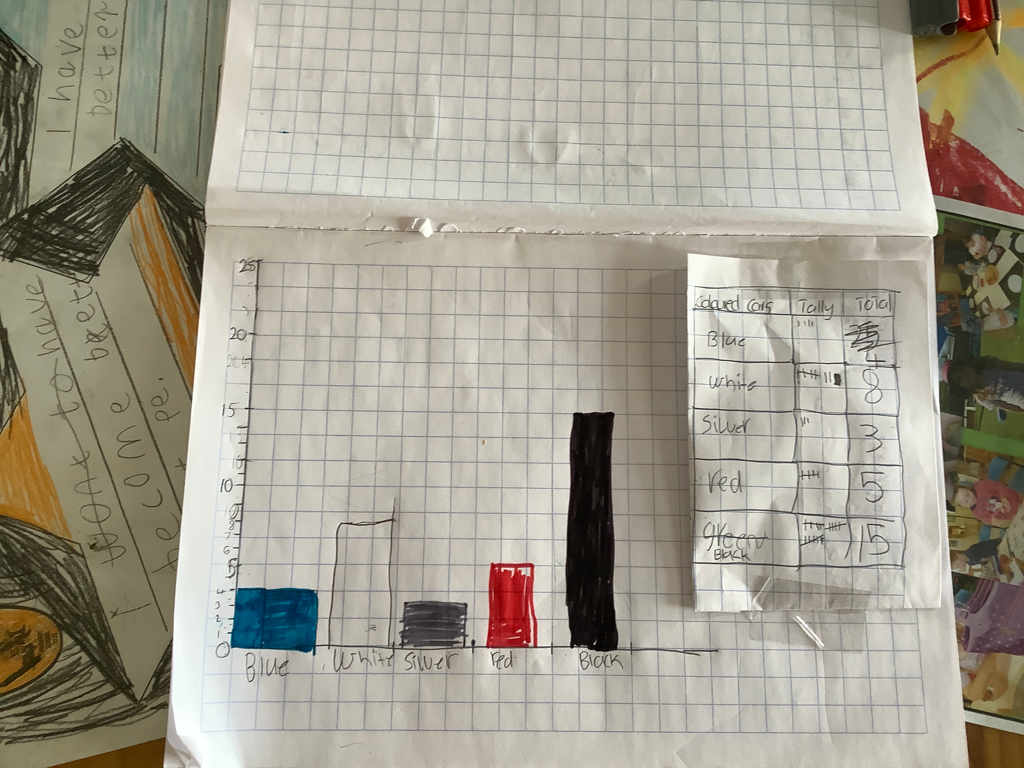
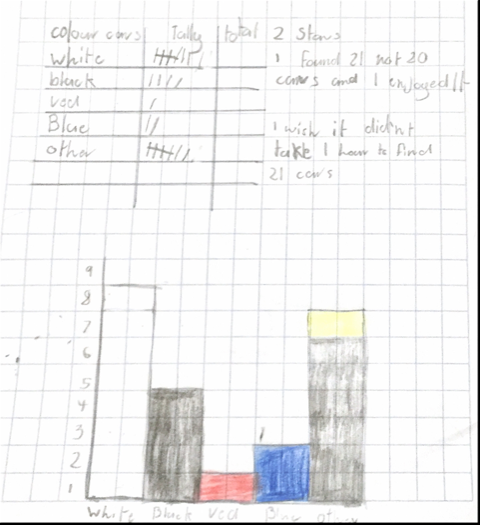
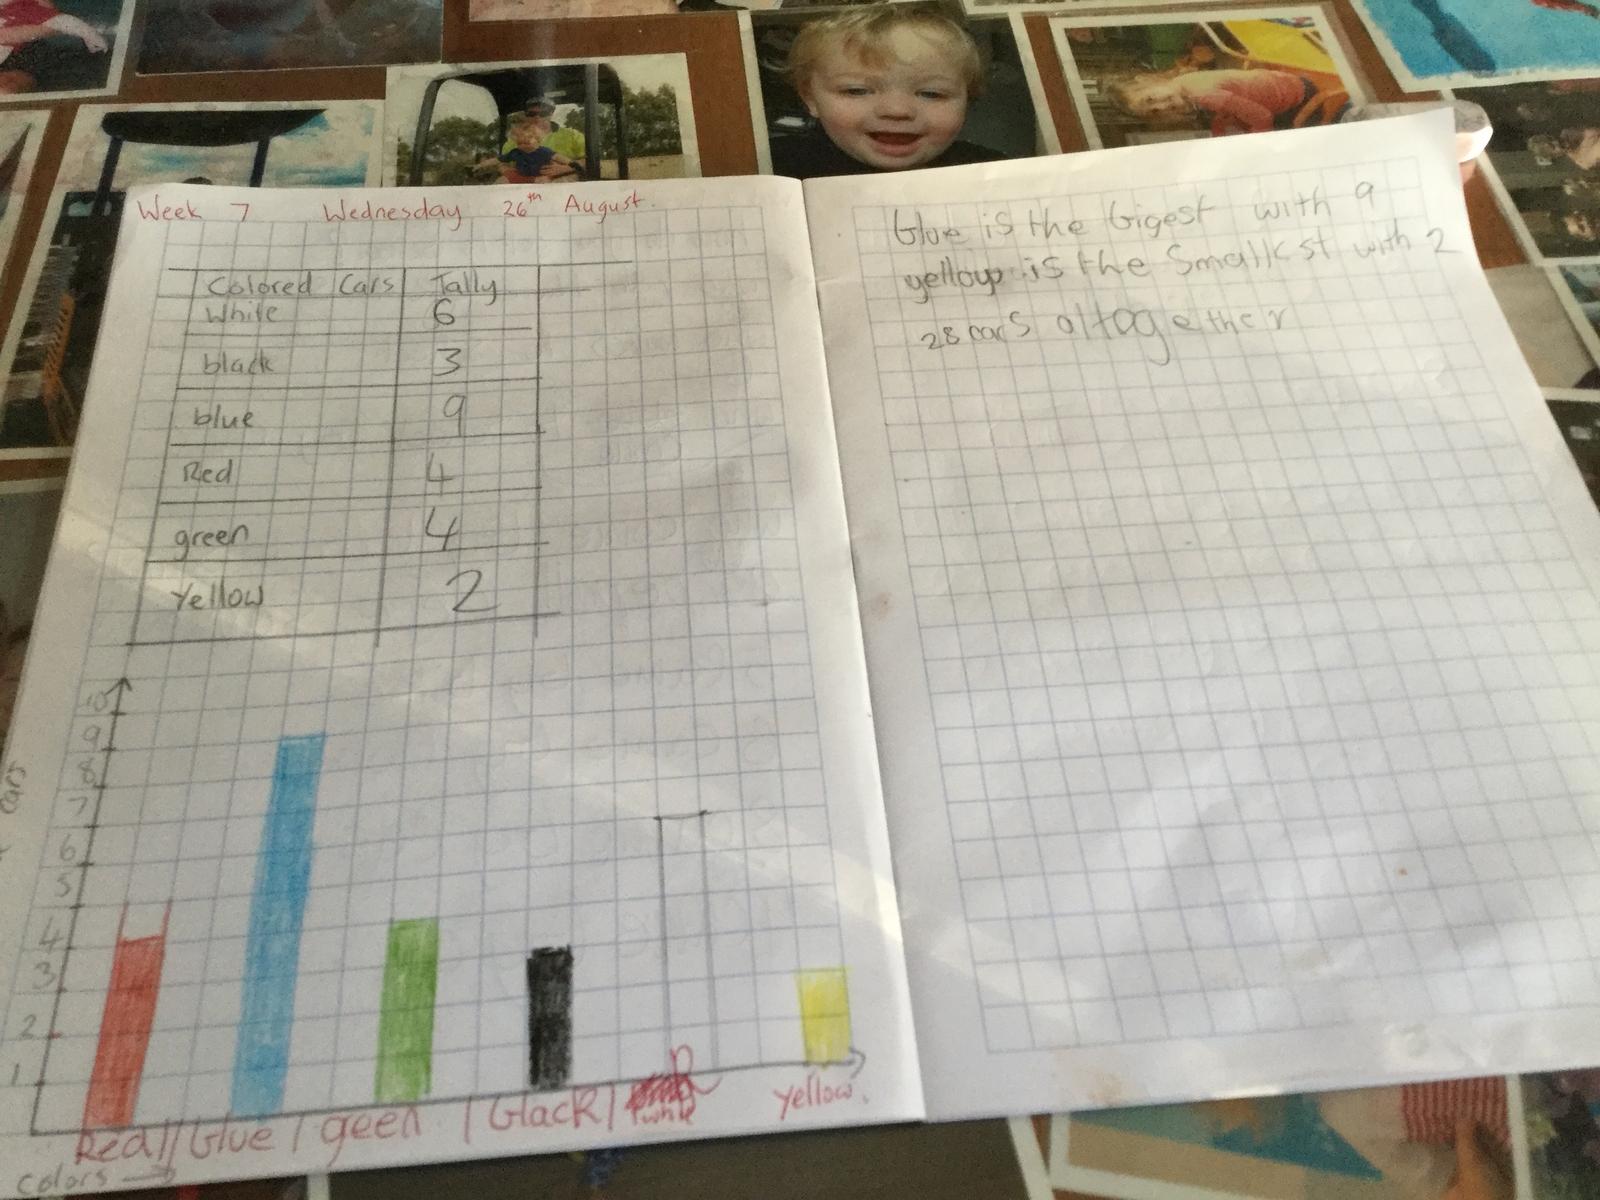
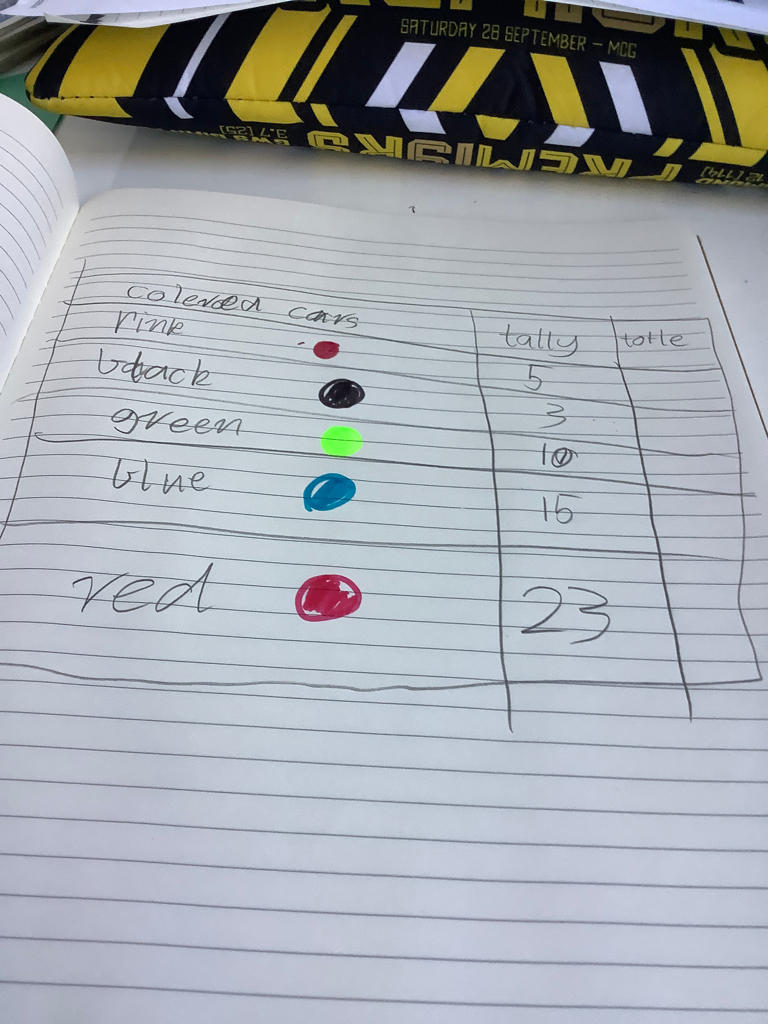
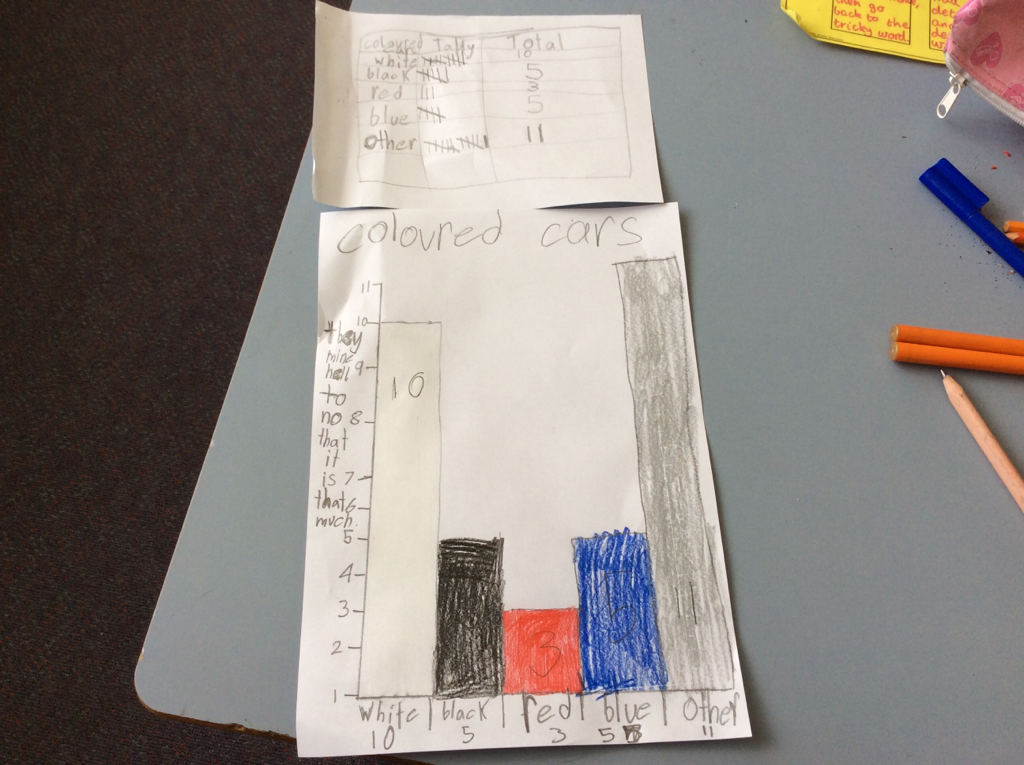
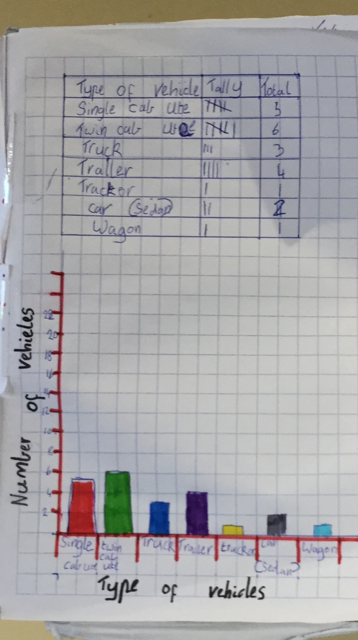

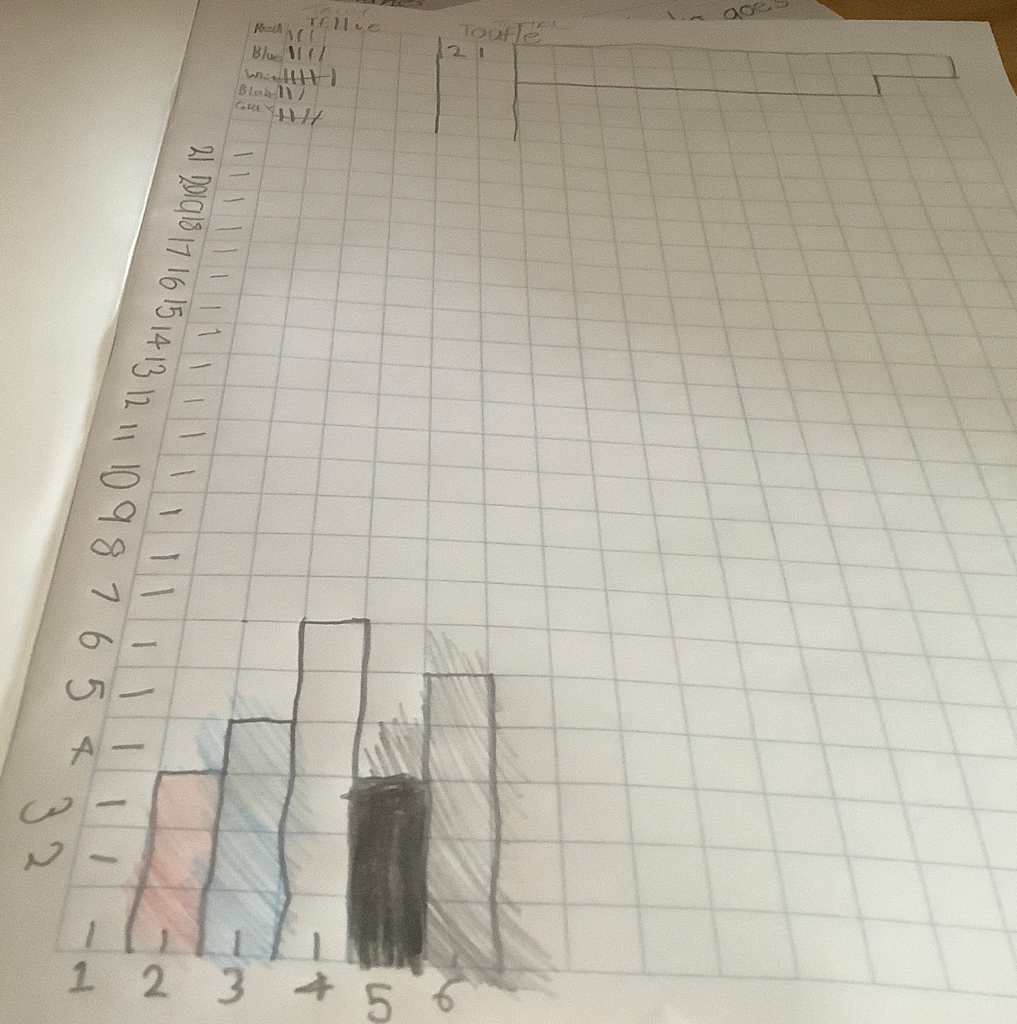
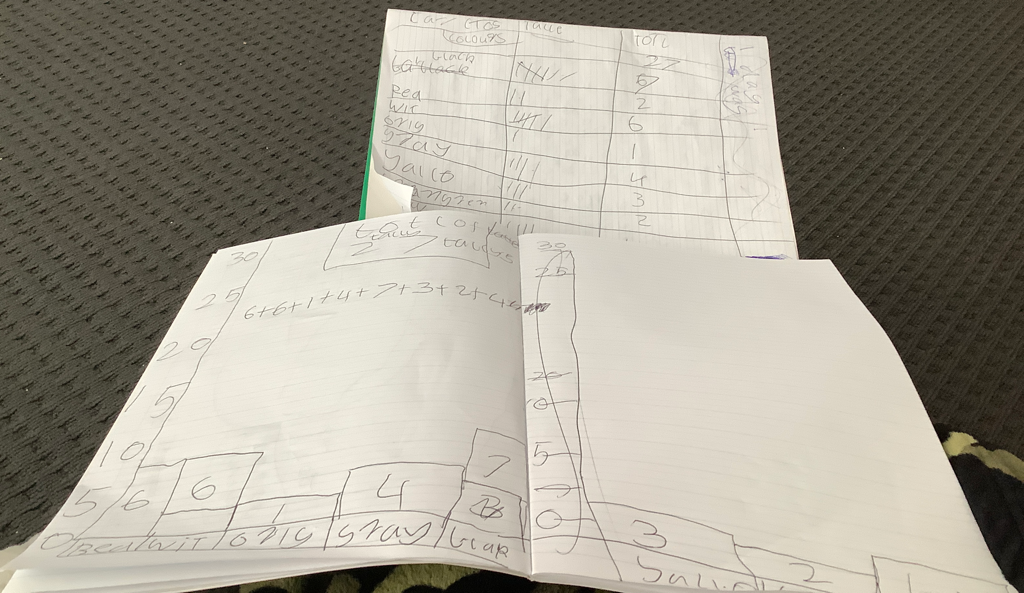
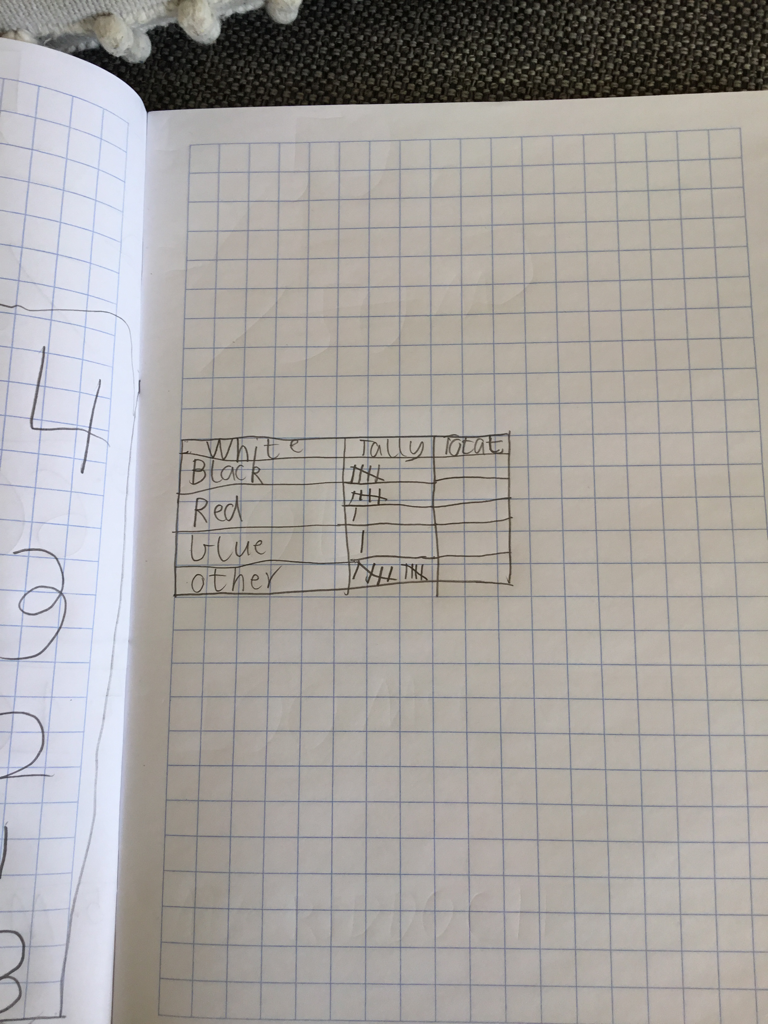
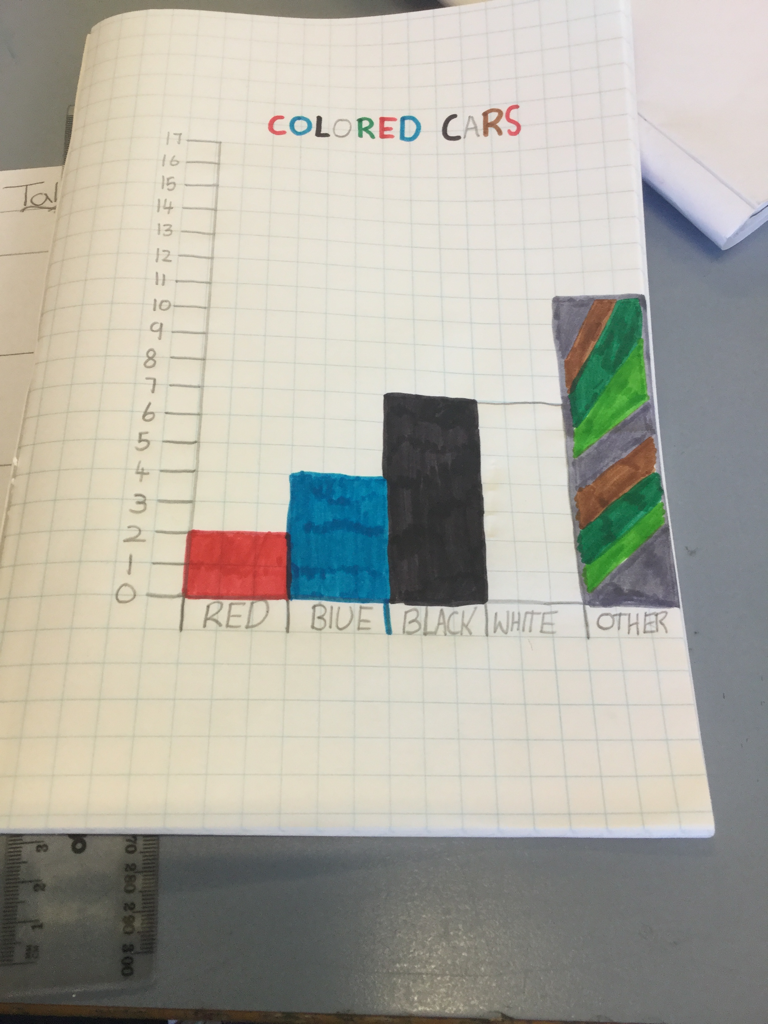
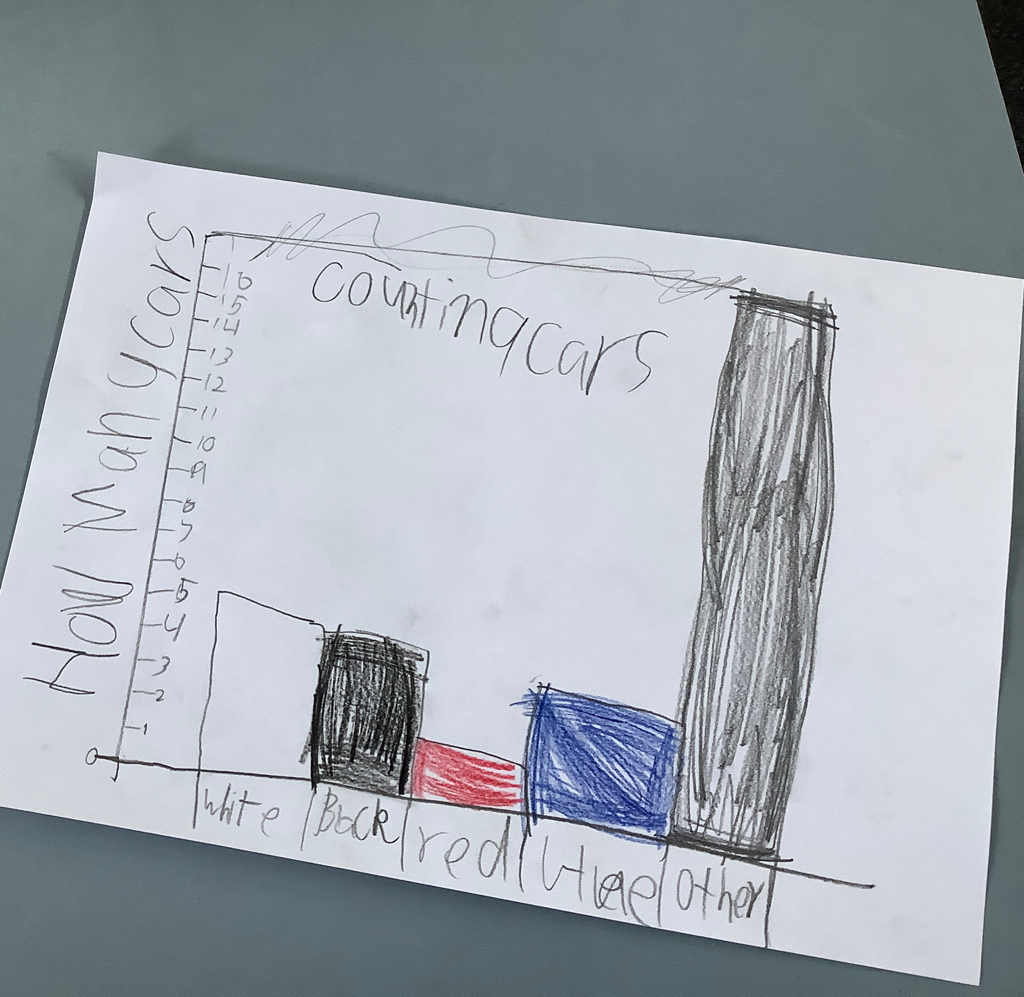
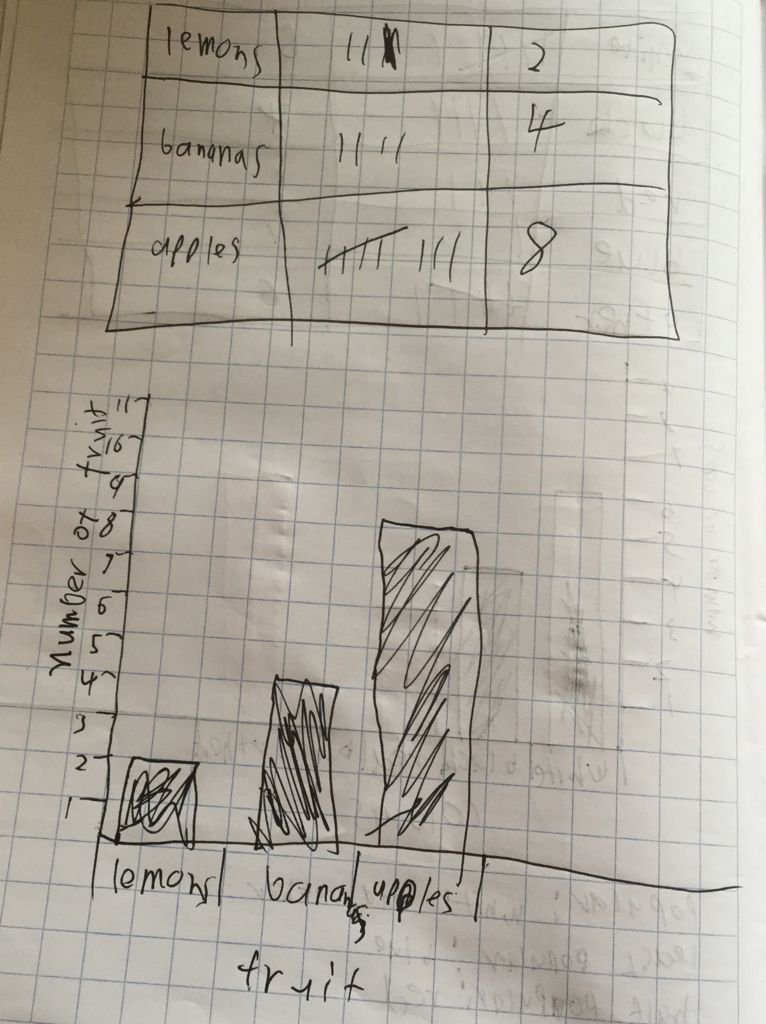
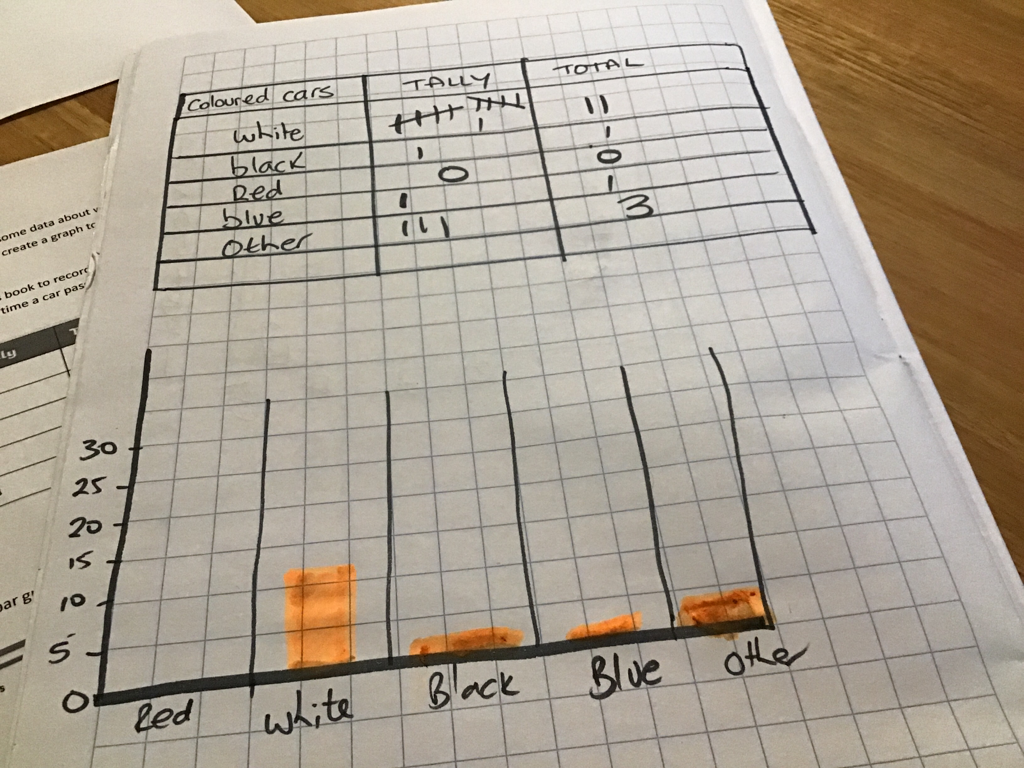
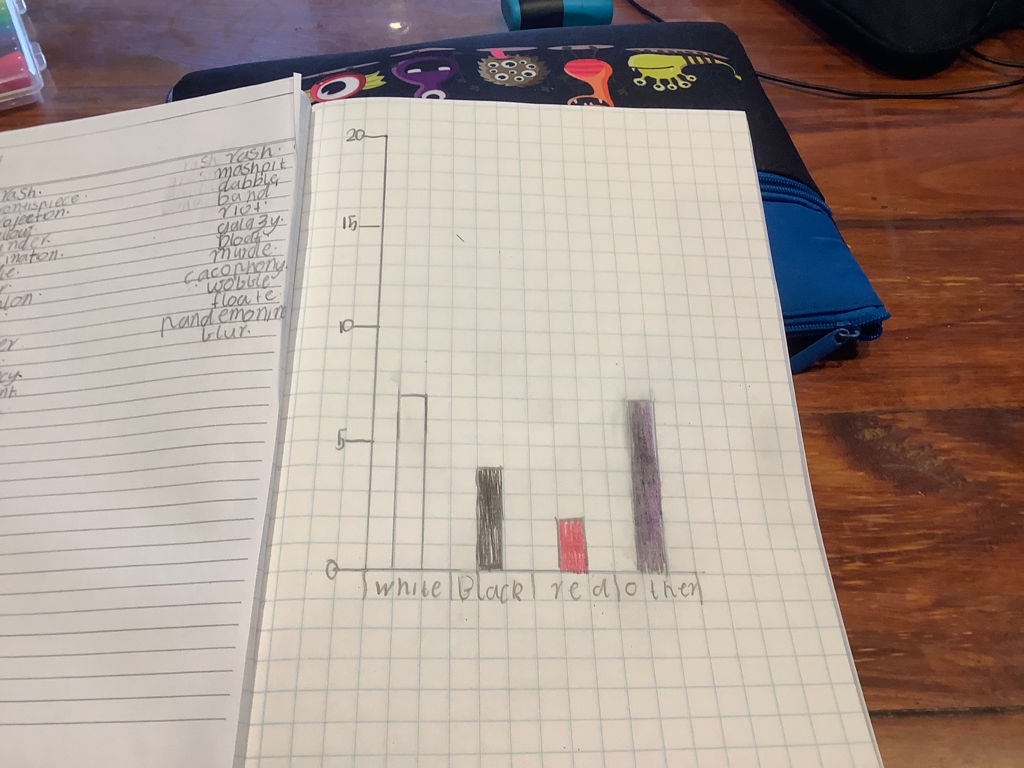
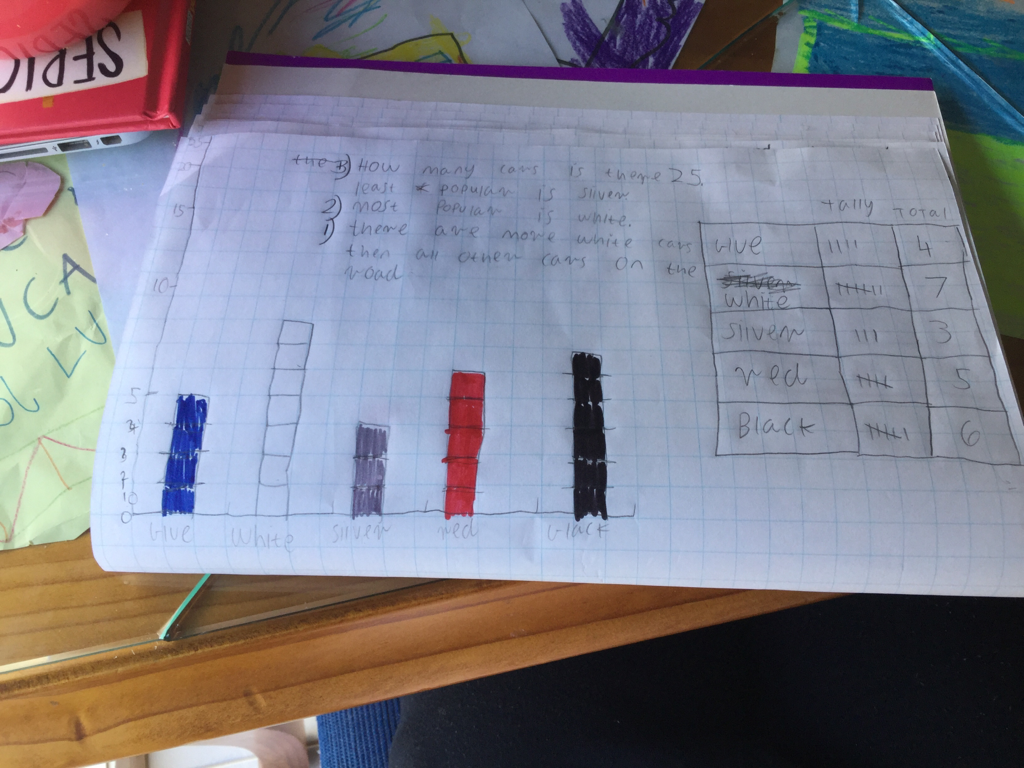

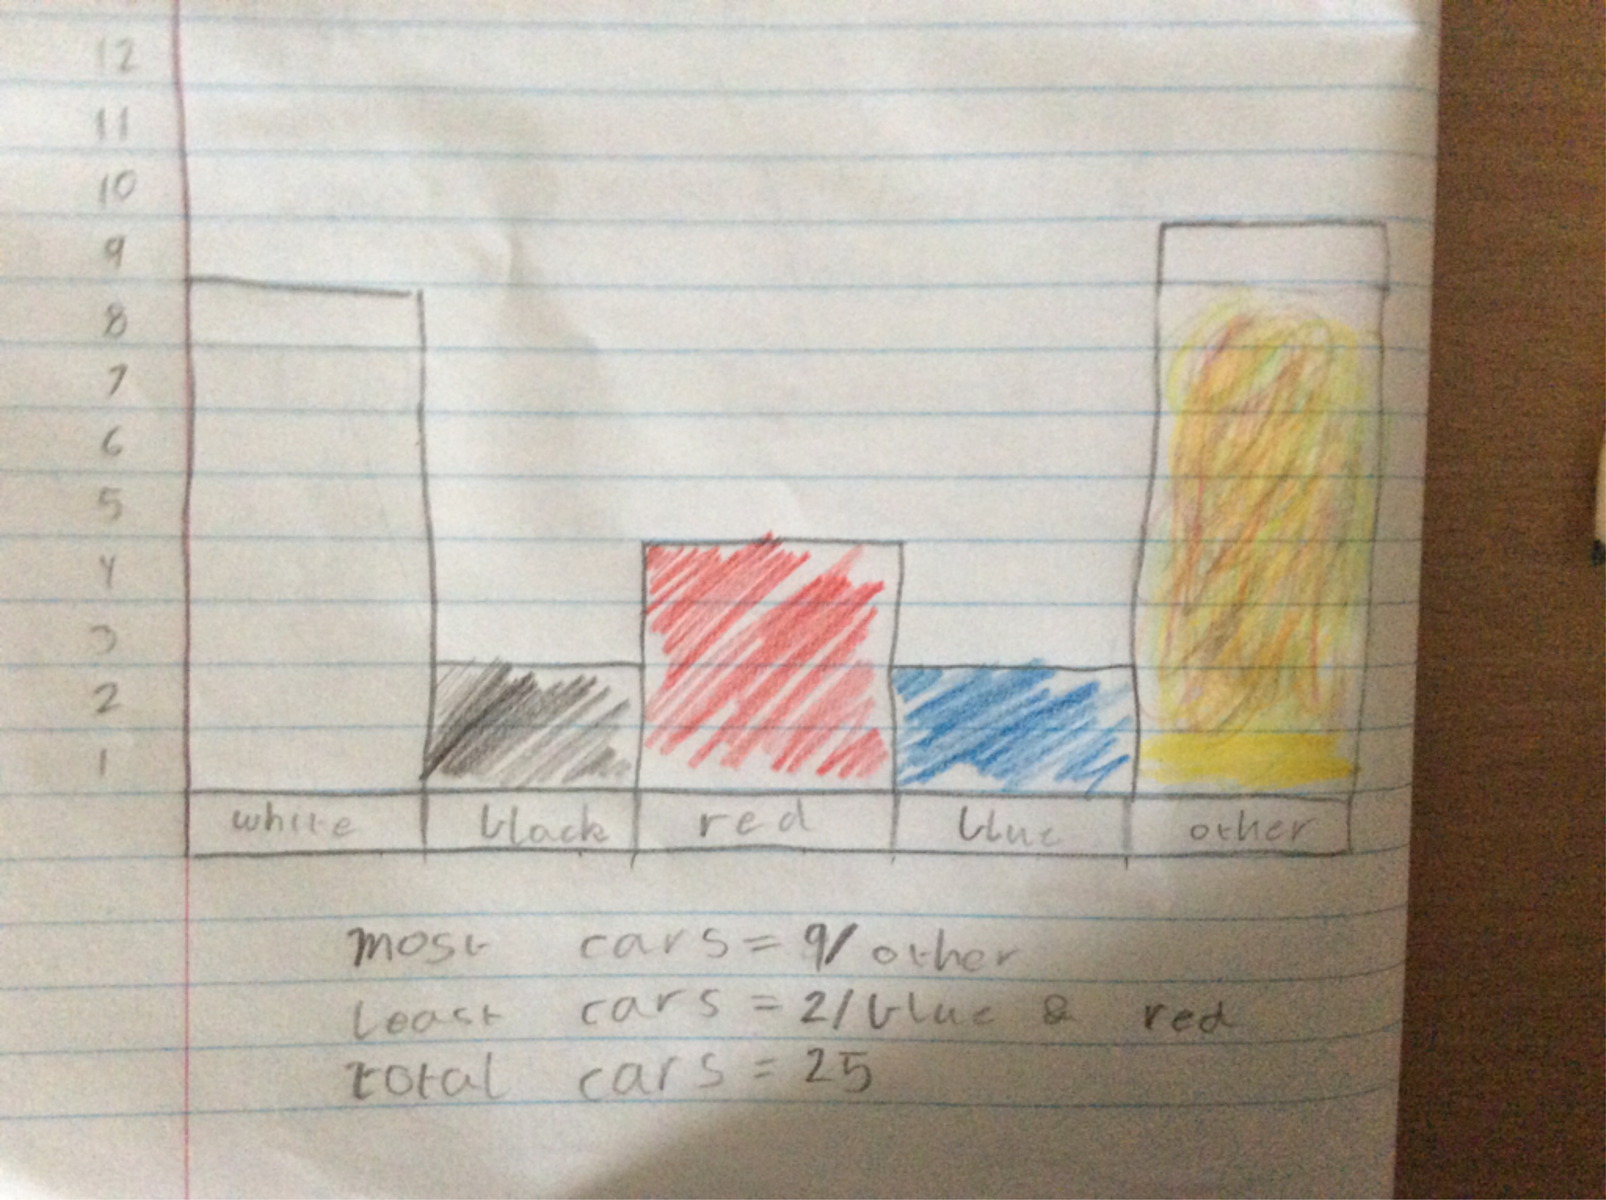
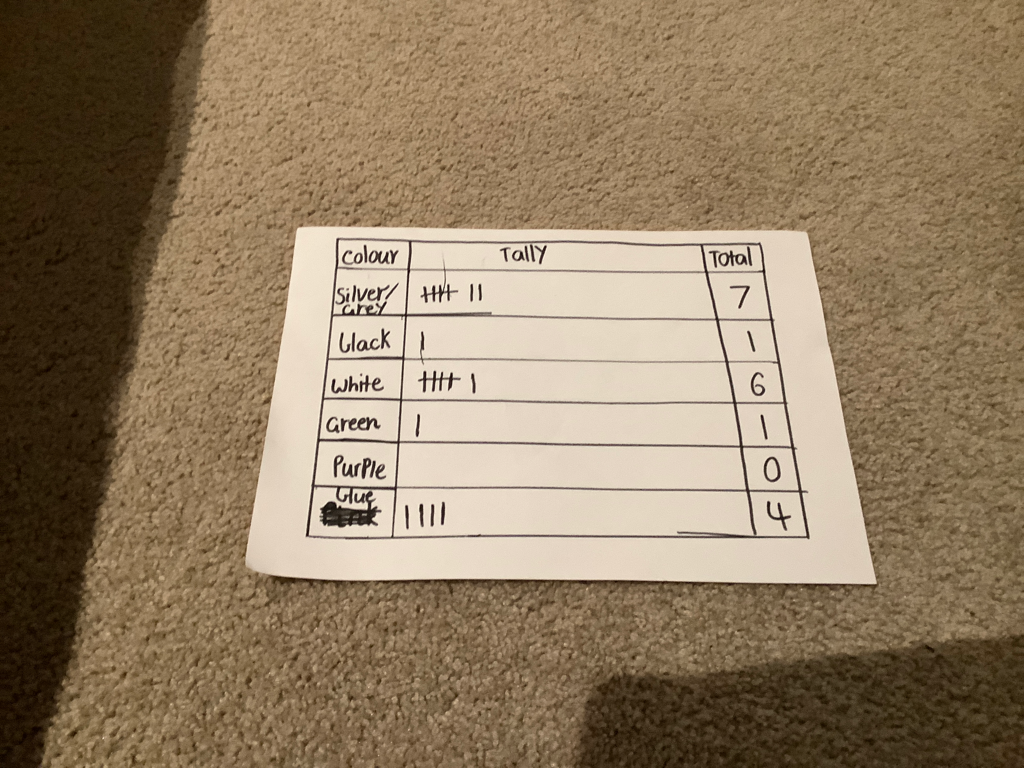
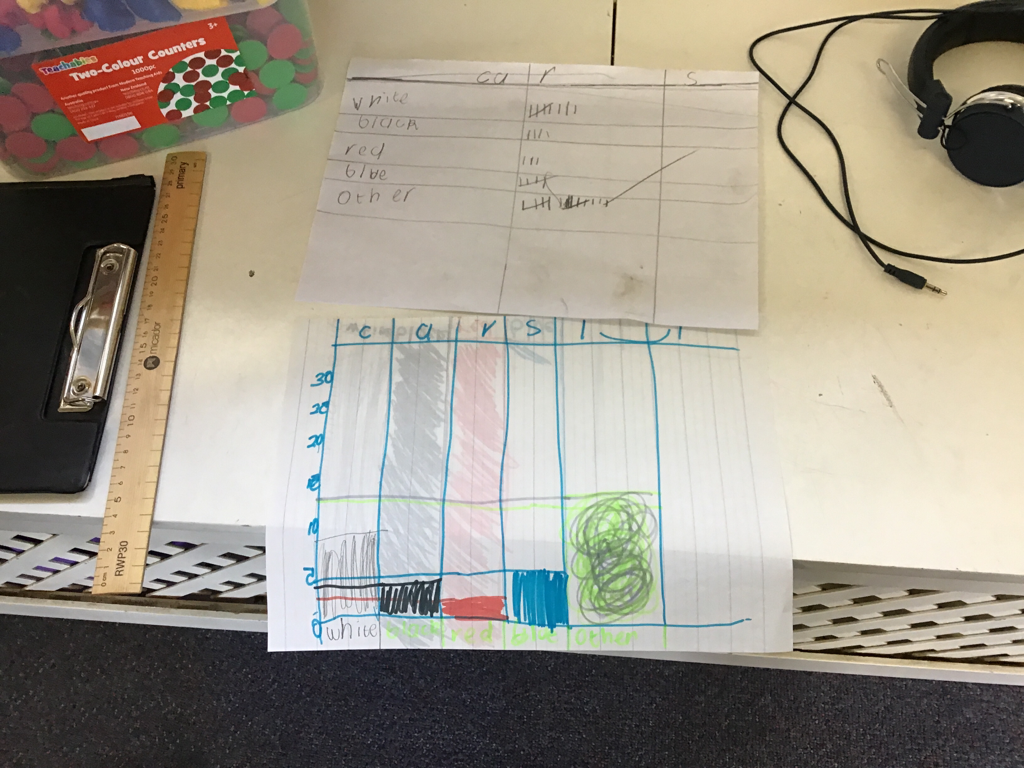
In Year Three/Four we have been learning about Data Representation. As part of a maths investigation, students needed to tally the number of different coloured cars from their neighbourhood. They then needed to create a bar graph to represent the data they had collected. A collection of examples of the bar graphs is shown above. We are so impressed with your maths thinking!