
MATHEMATICS
Statistics has been the order of the day across all year levels.
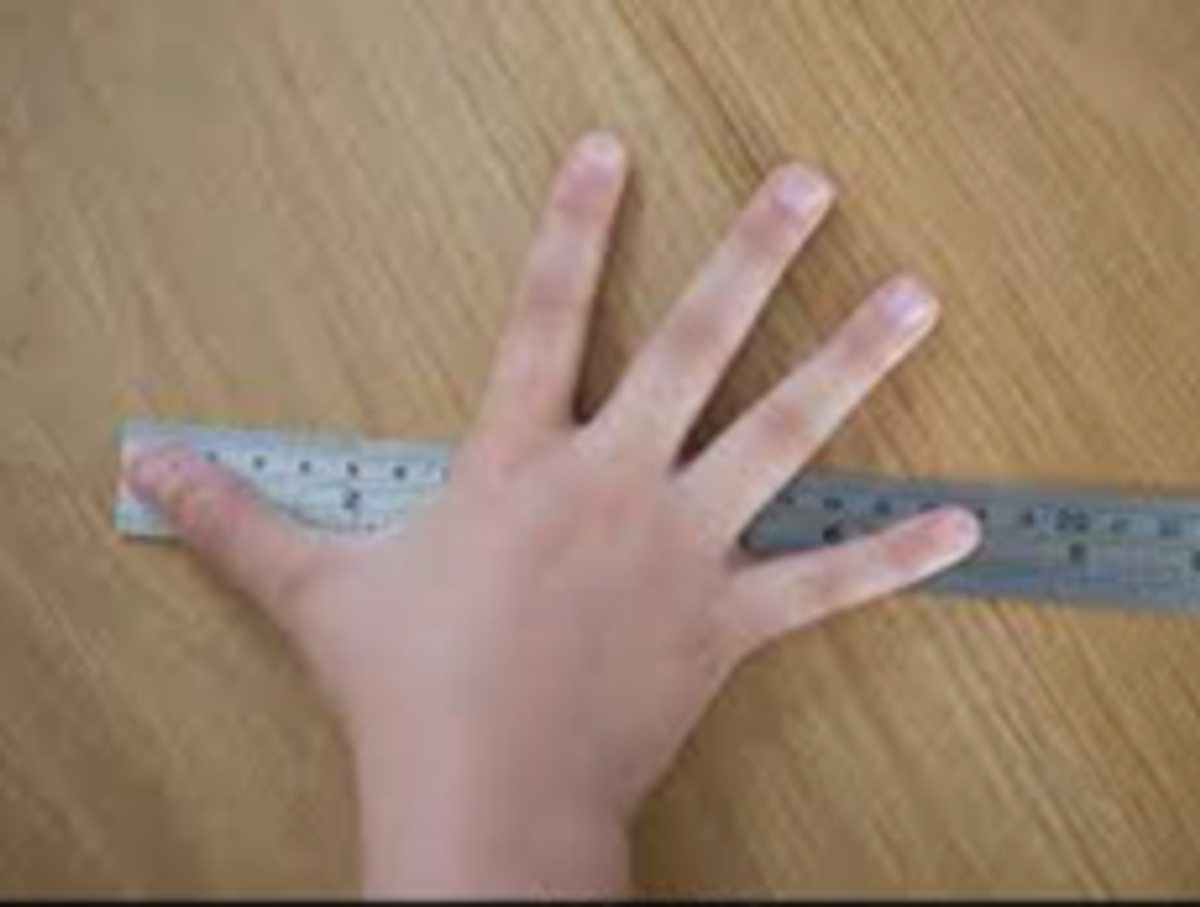
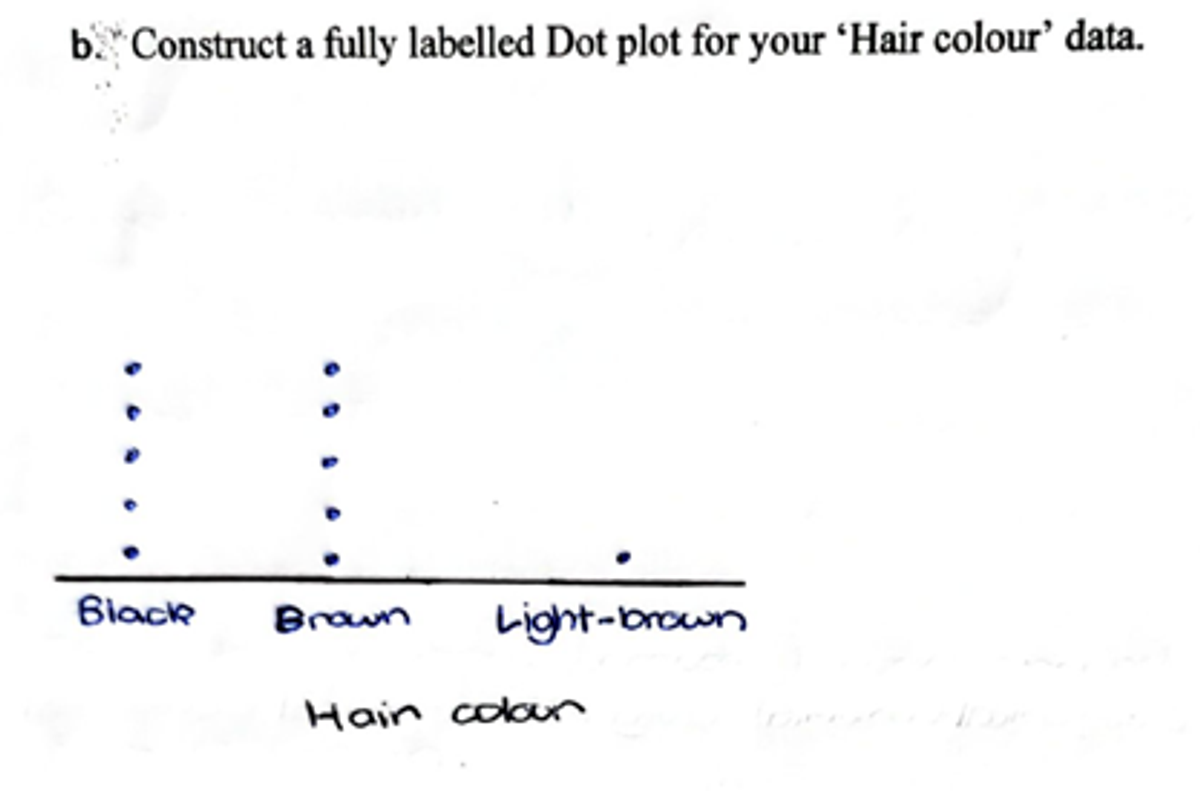
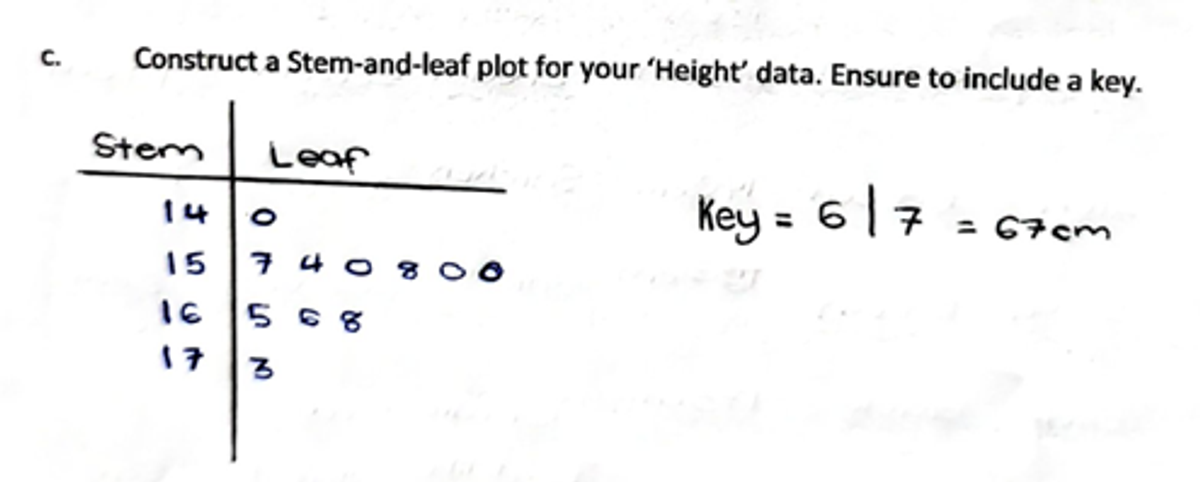
Students in year 7 compared hair colour, height, favourite chocolate, favourite sport and handspan. Students surveyed each other and discovered that no two people are alike and interestingly handspan like height varies quite a bit despite students all being in year 7.
Students were then able to select and use appropriate displays to demonstrate their findings
Year 8s created their own survey questions, following certain criteria, and surveyed each other. Some of the questions they came up with:
How many times have you travelled outside Victoria?
Who is your favourite superhero?
On average how long do you sleep each night?
What is your average screentime per day?
How many hours of music do you listen to a week?
What is your favourite gaming platform?
How many times do you eat a day including snacks?
Number of haircuts per year
How many hours of music do you listen to a week?
Students then collated their data, analysed it, developed displays and described their findings. This exercise also gave students a chance to get to know one another better.
Year 9s had the opportunity to investigate a topic of their choice and provide a report of their findings. Students chose a variety of topics such as….
Understand the sleeping patterns of teenagers
Causes of student tardiness
How much has the Earth’s surface temperature risen since 1900s?
How has the age of the homeless in Victoria varied over the last 20 years?
Incidents of youth crime in Victoria over the last 15 years
Covid rates by state
Impact of gaming on students, socially, mentally and academically
Accidents involving astronauts during space programs from Project Mercury to the Space Shuttle program.
Students included reasons for anomalies in the data and ethical considerations. Many could not believe they were doing maths! This project gave students an opportunity to see how statistics are used in the wider community and create awareness of how data impacts our daily lives.