
Mathematics
Year 7

Mathematics
Year 7
Year 7 students began the year undertaking a statistics unit called ‘What is a typical Year 7 student?’. Students collected data about themselves such as:
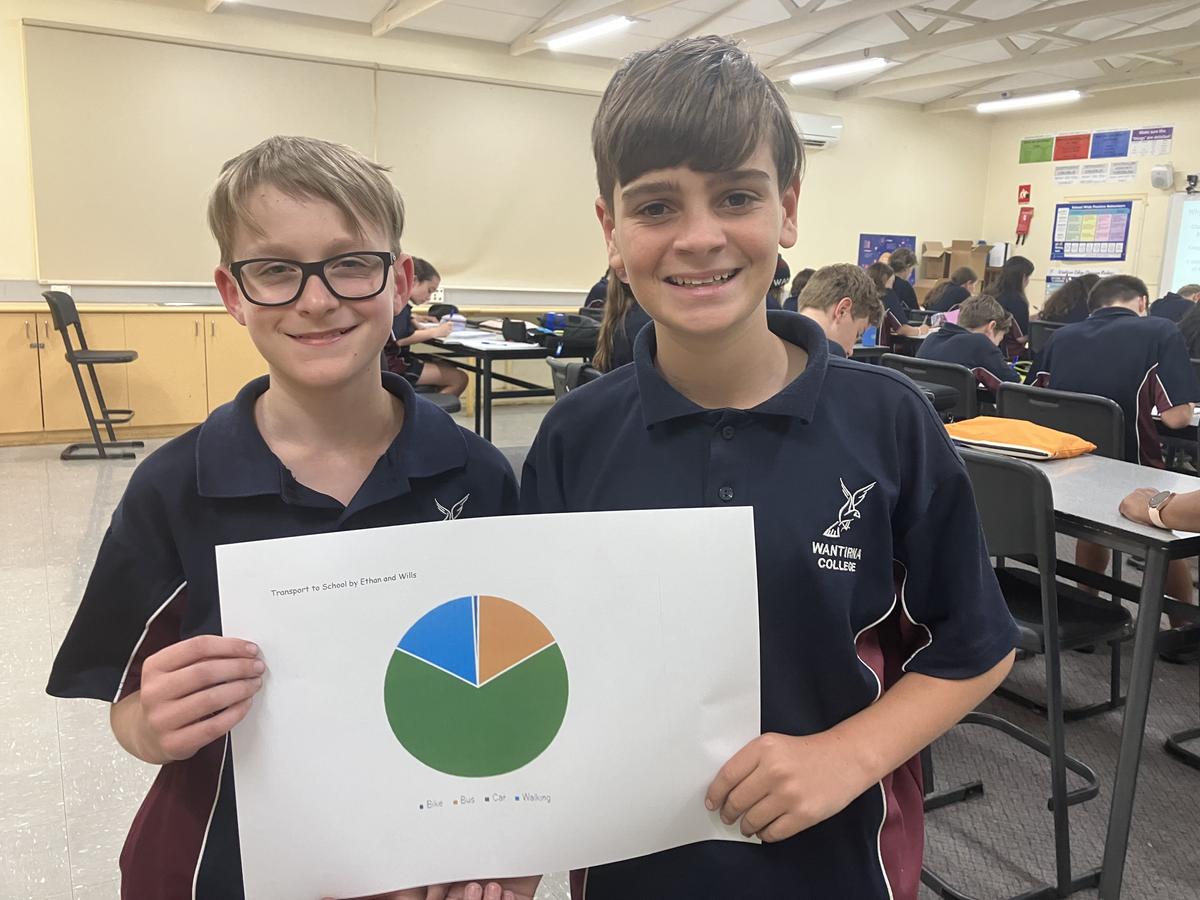
Parents may be interested to discover that the mean time spent on social media is nearly 5 hours a day, with TikTok being the most popular by far. The typical Year 7 student takes 15 minutes to travel to school and the favourite sport by far is basketball, followed by netball.

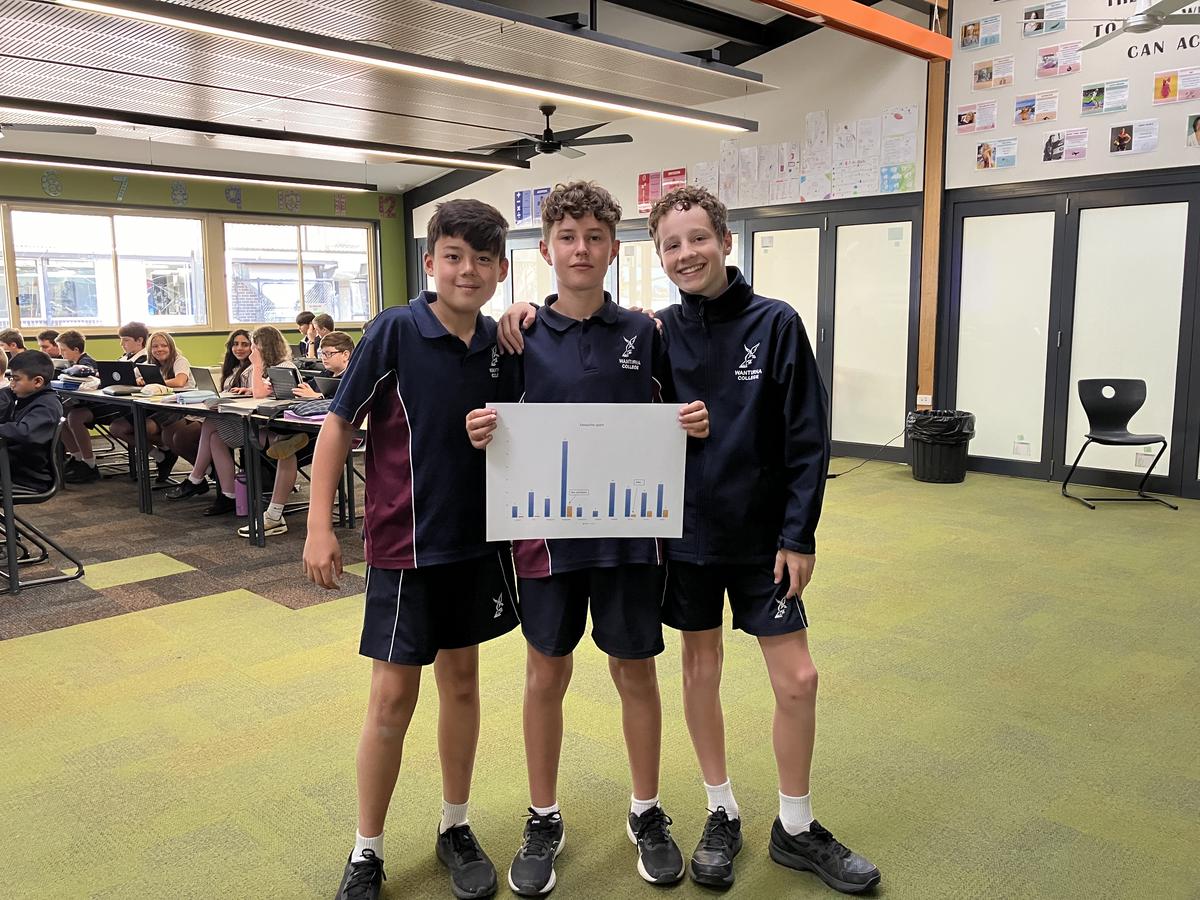
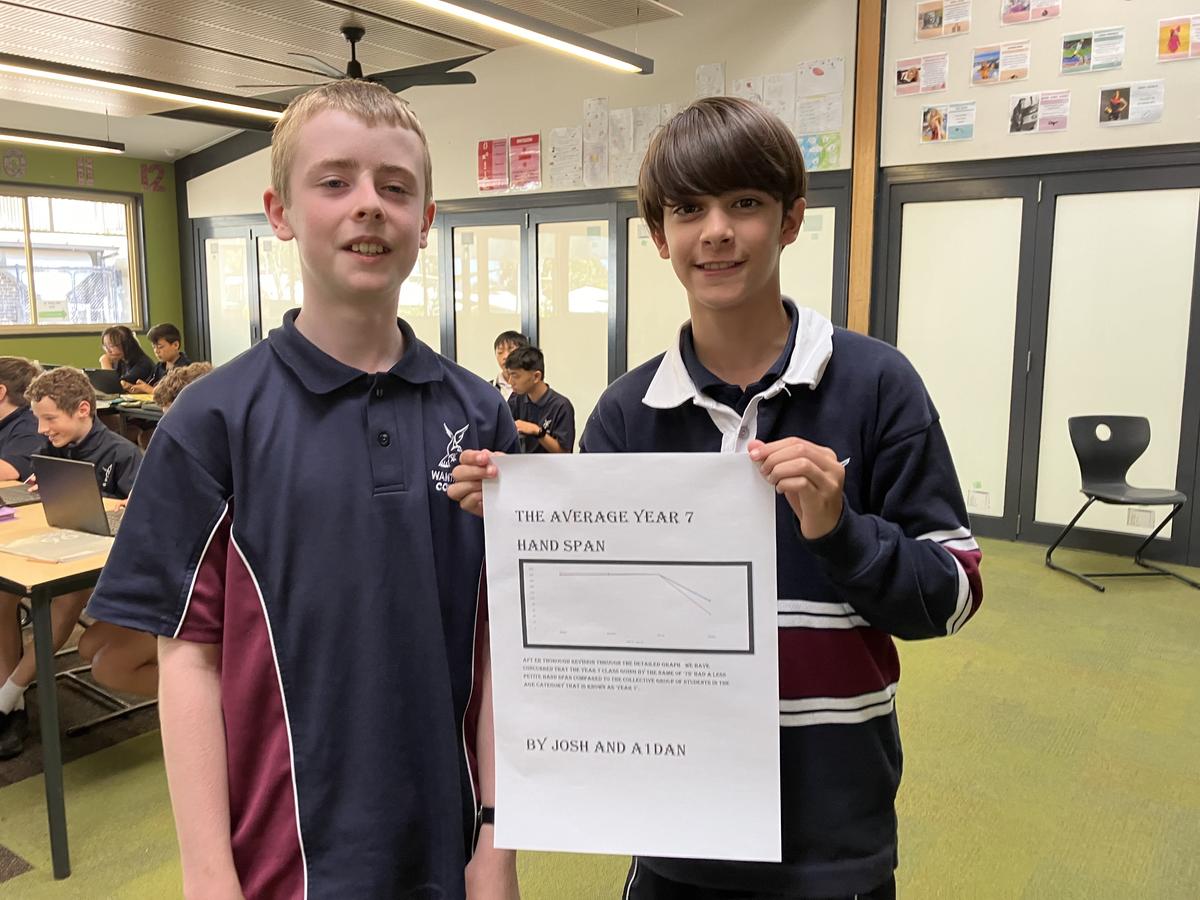
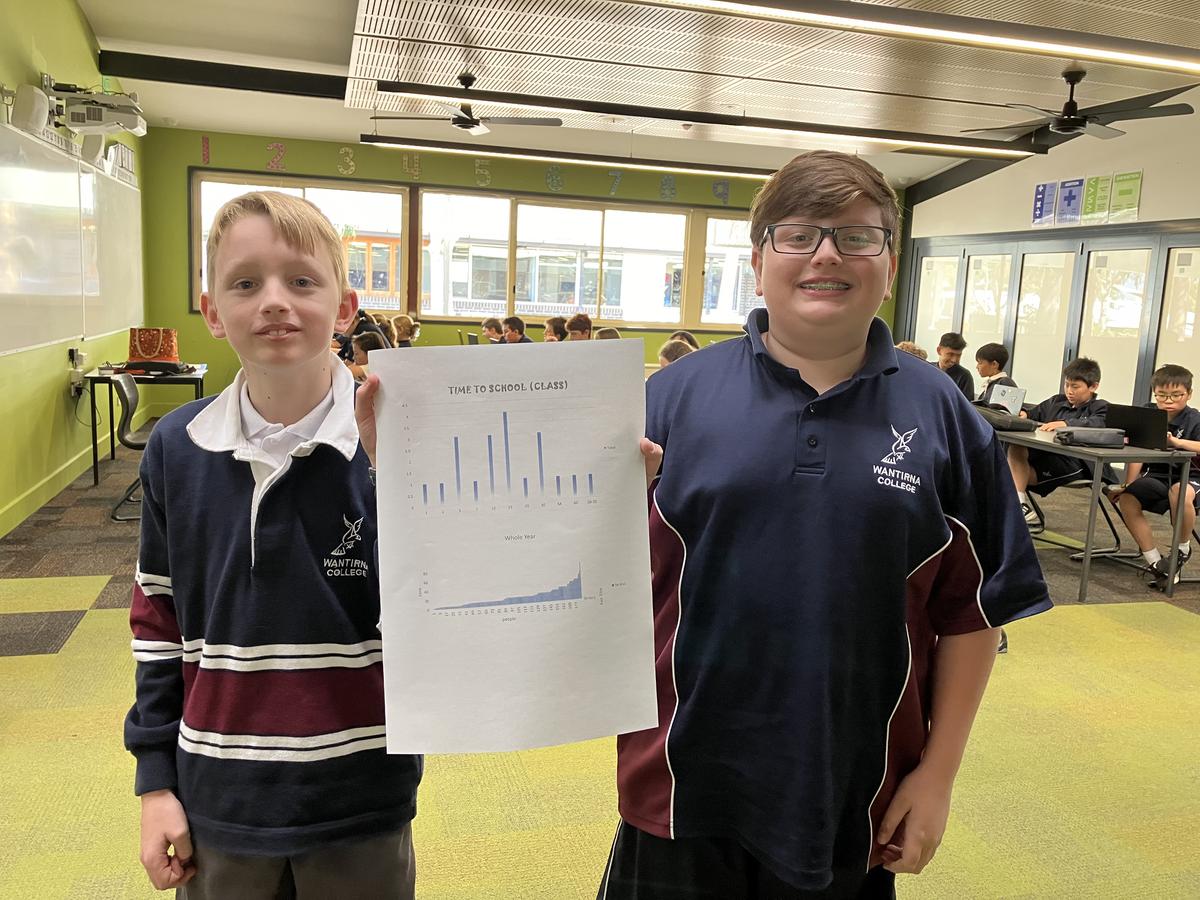
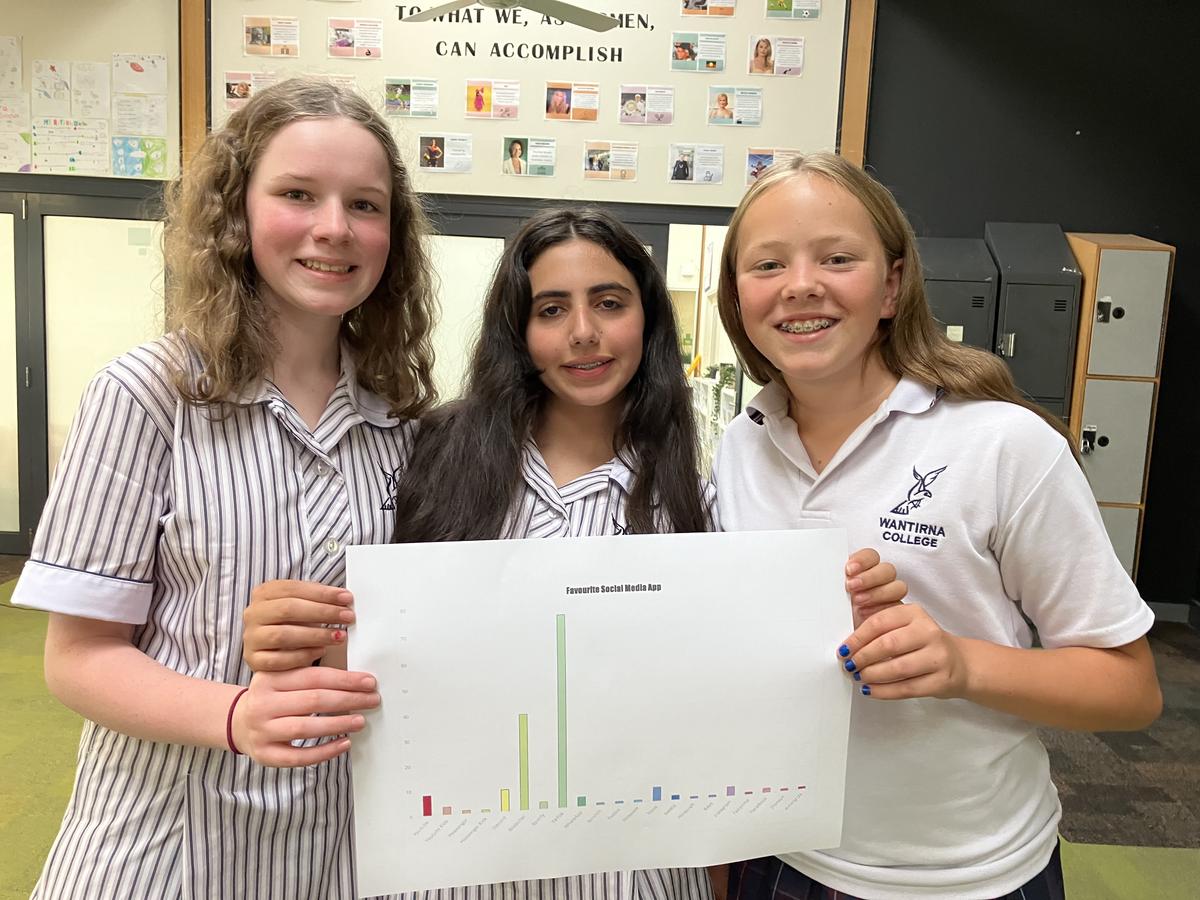
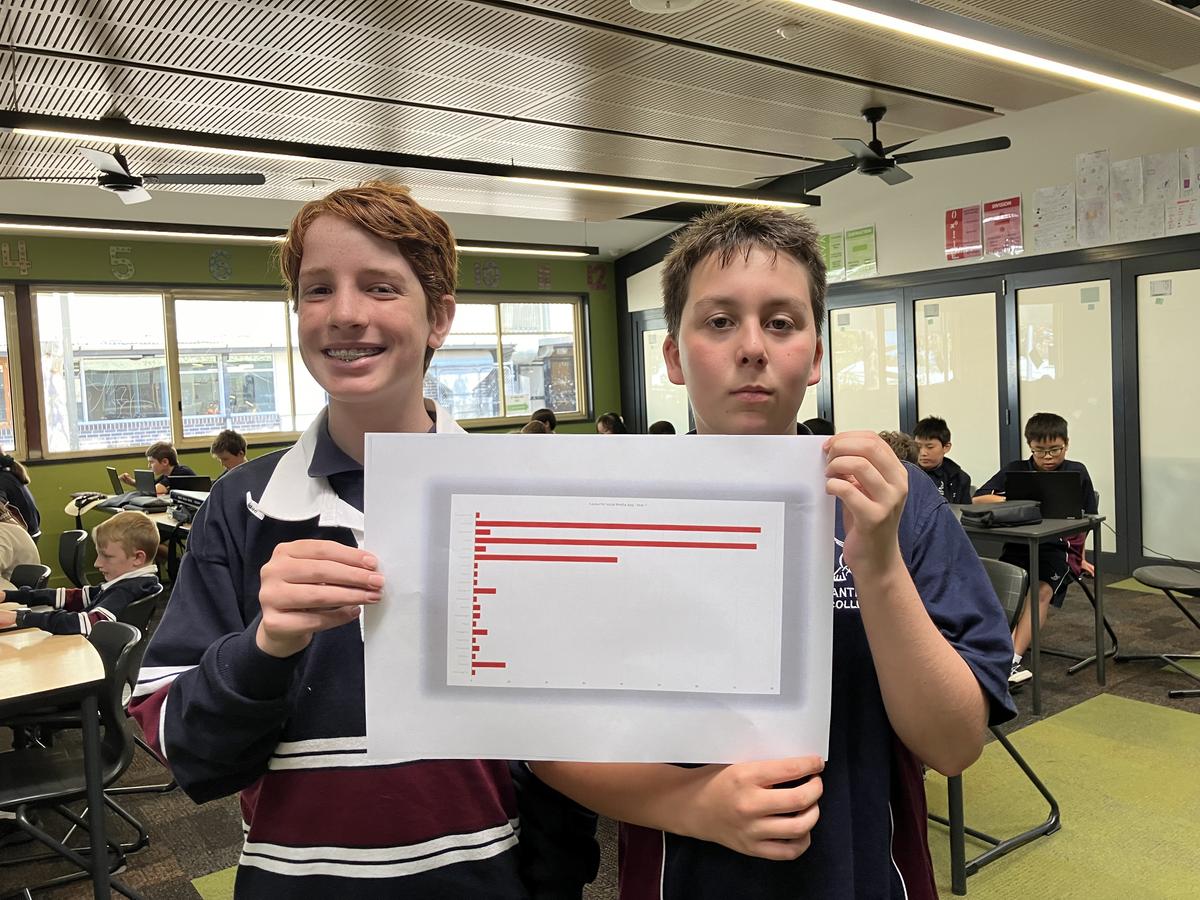

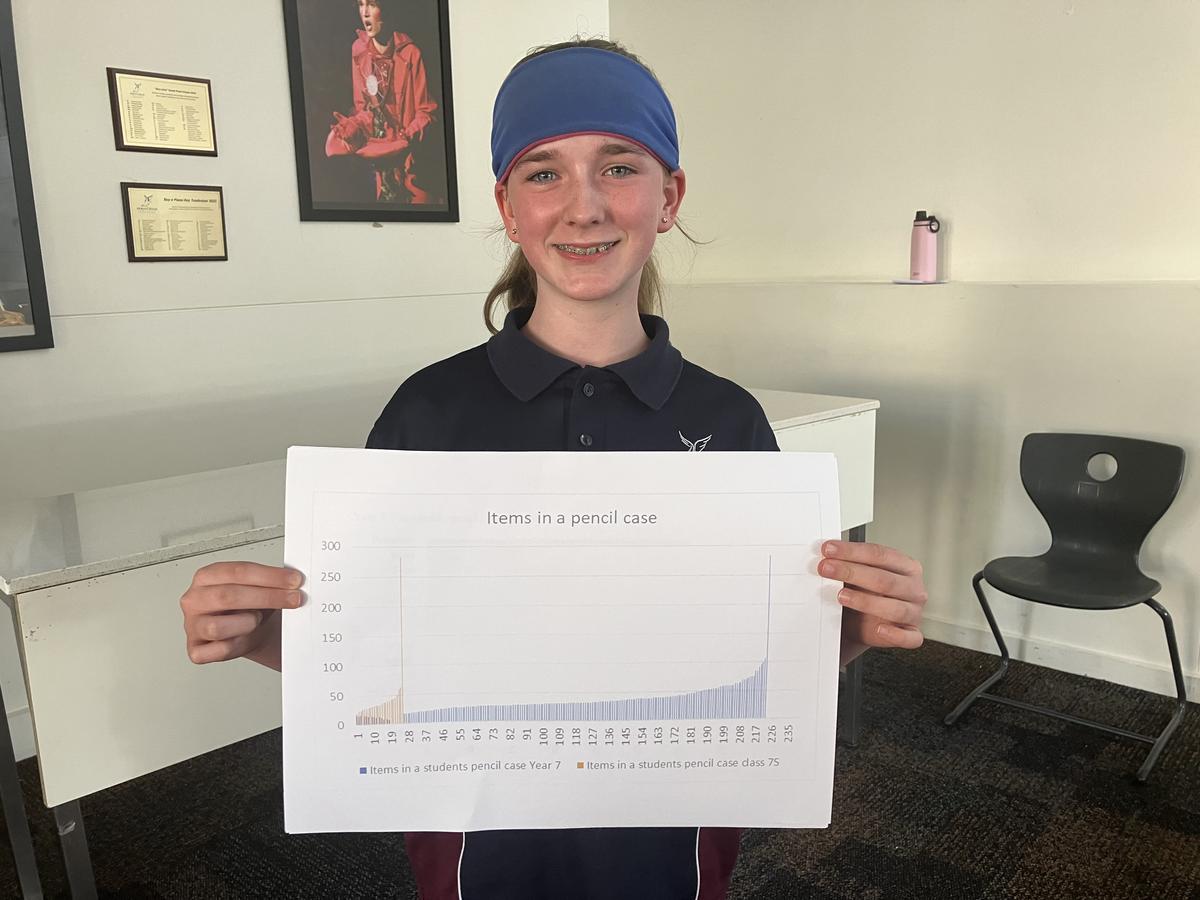
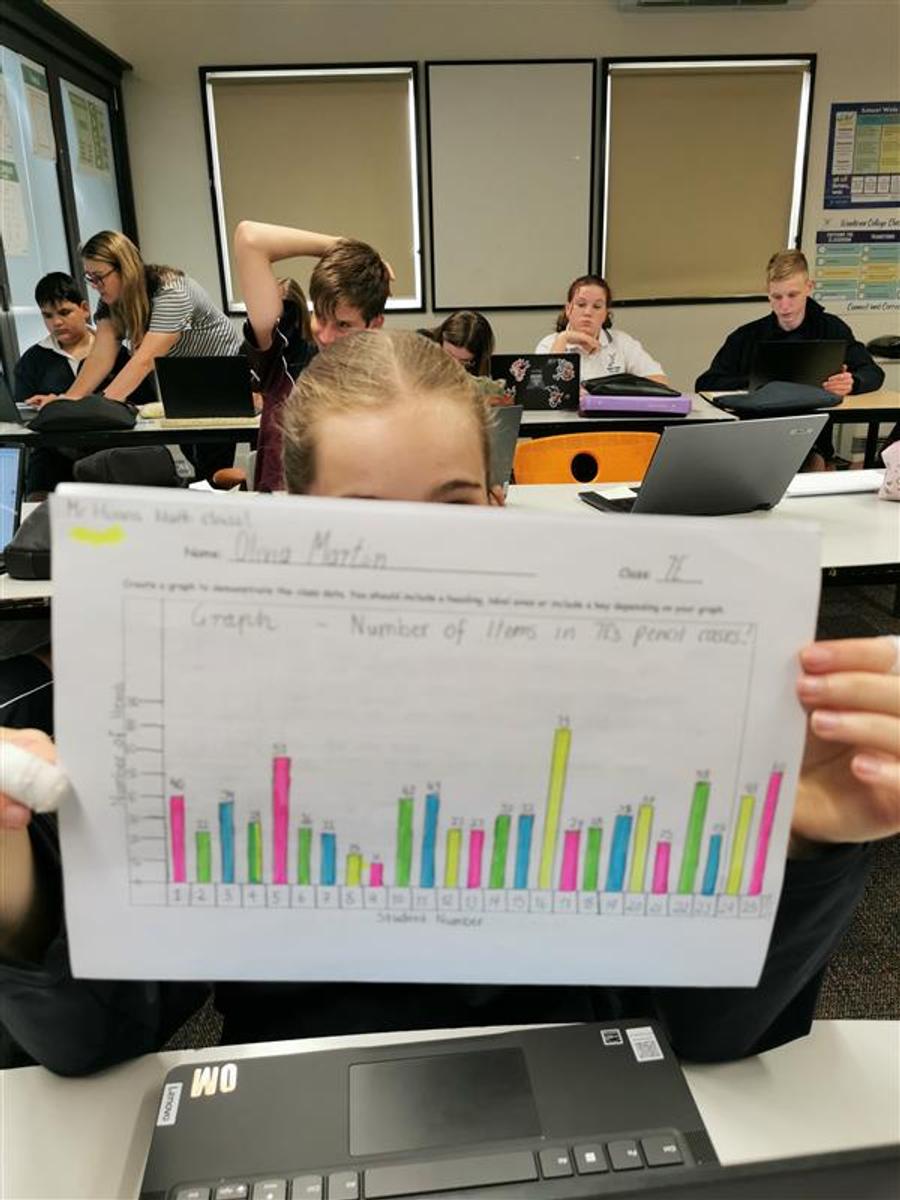
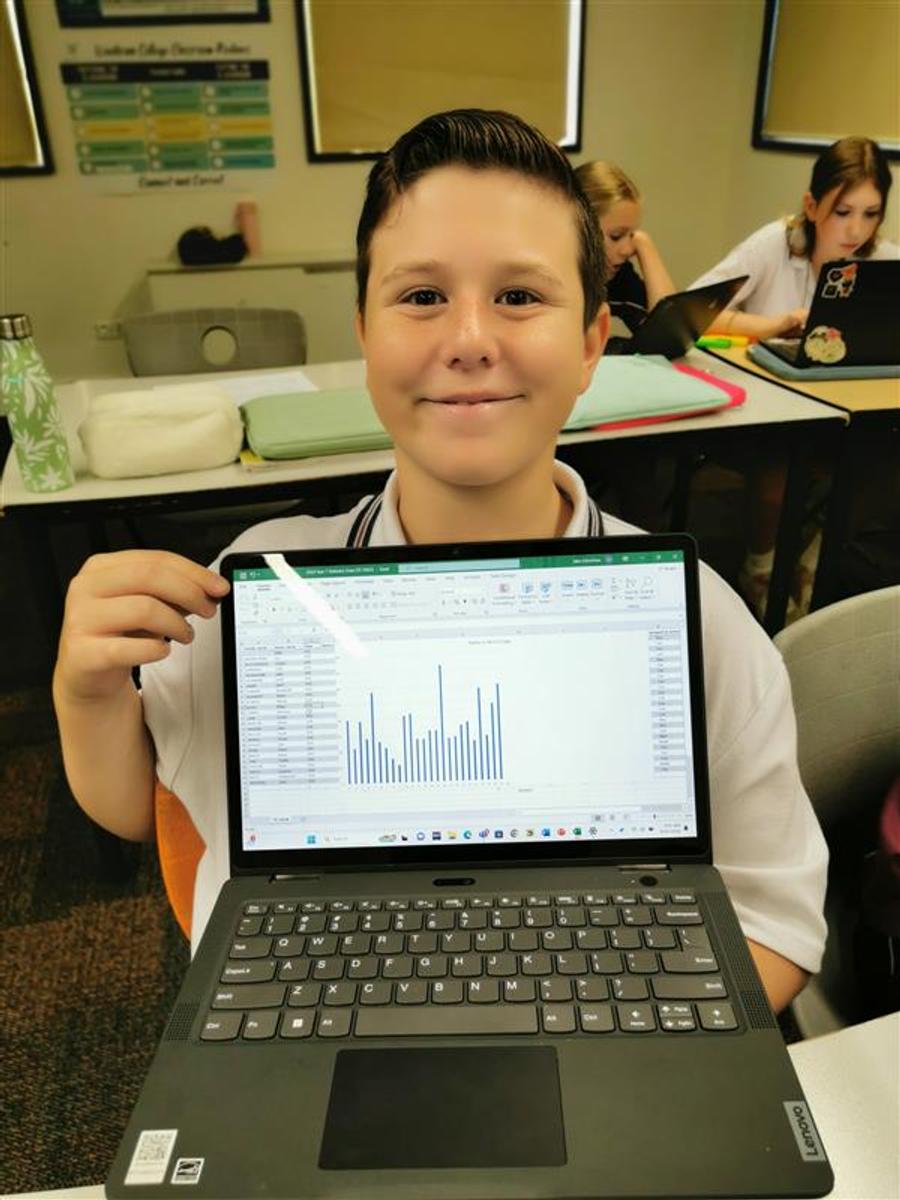
Students analysed class data and whole year data and created graphs to demonstrate the data. Many students used excel to create graphs and teachers were very impressed with their technology skills.
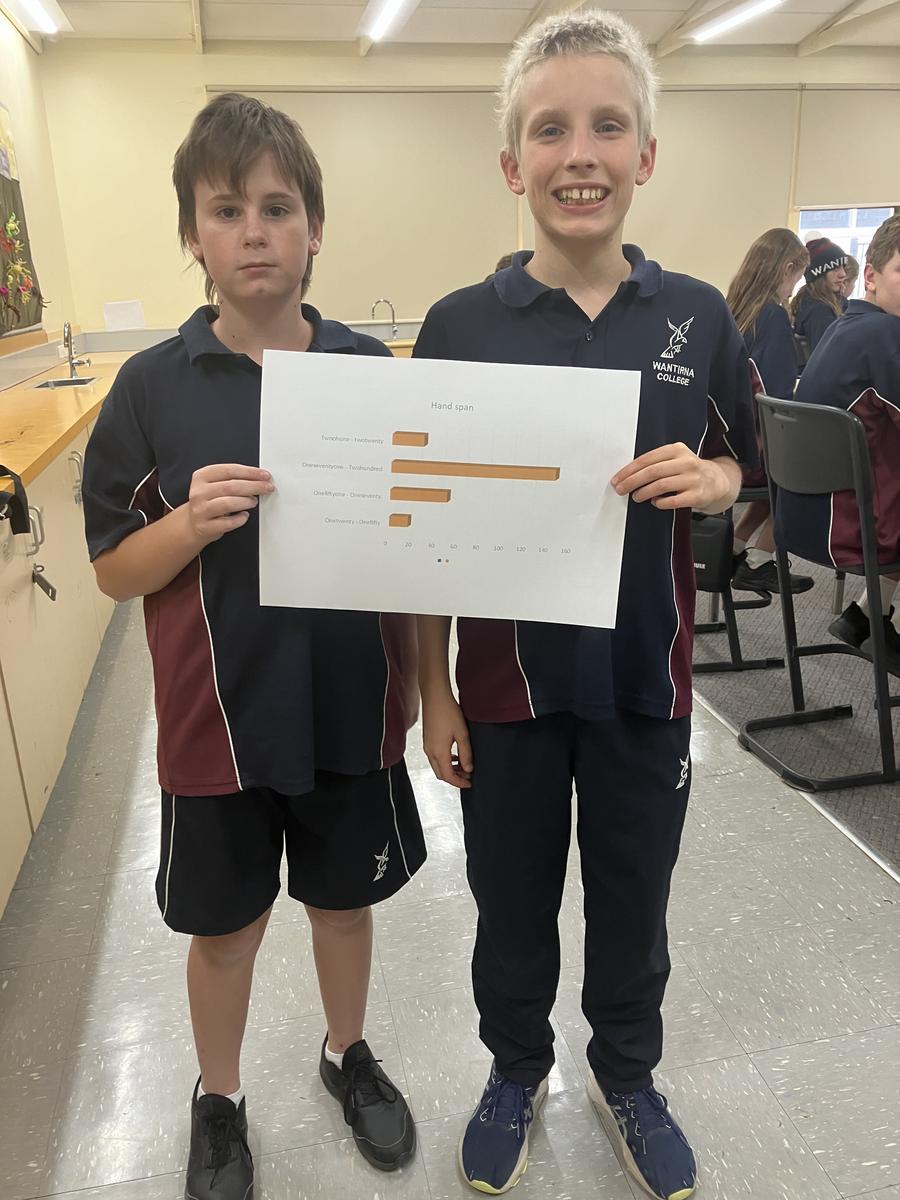
For the majority of Term 1, the Year 7 cohort have been working on Statistics and Data Analysis. They have learnt about all different types of graphs, from Stem and Leaf plots to line graphs, and how to organise data into them correctly. Students also investigated new angles of topics like MMMR (Mean, Median, Mode and Range) and the different types of data, such as categorical and numerical. A whole-grade survey was taken of different aspects of our lives, including favourite sports, hand spans, how we get to school, etc. This data was put together by the Year 7 maths teachers, and students created posters based on a data set of their choice. They then covered more focused topics of analysis, including identifying outliers and the most effective way to write a survey question. Huge thanks to the Year 7 Maths educators for their wonderful teaching. We all look forward to what you teach us next! Tara Coombs, 7S
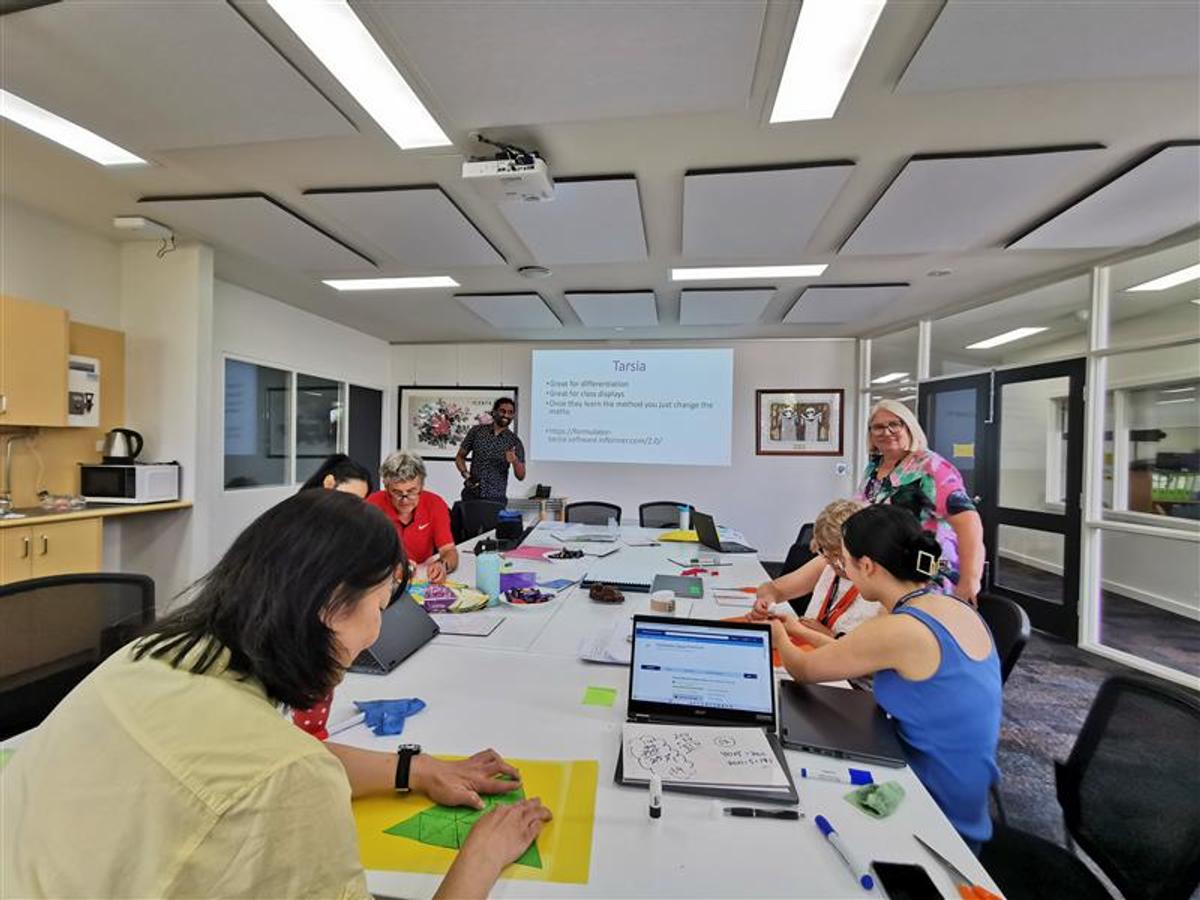
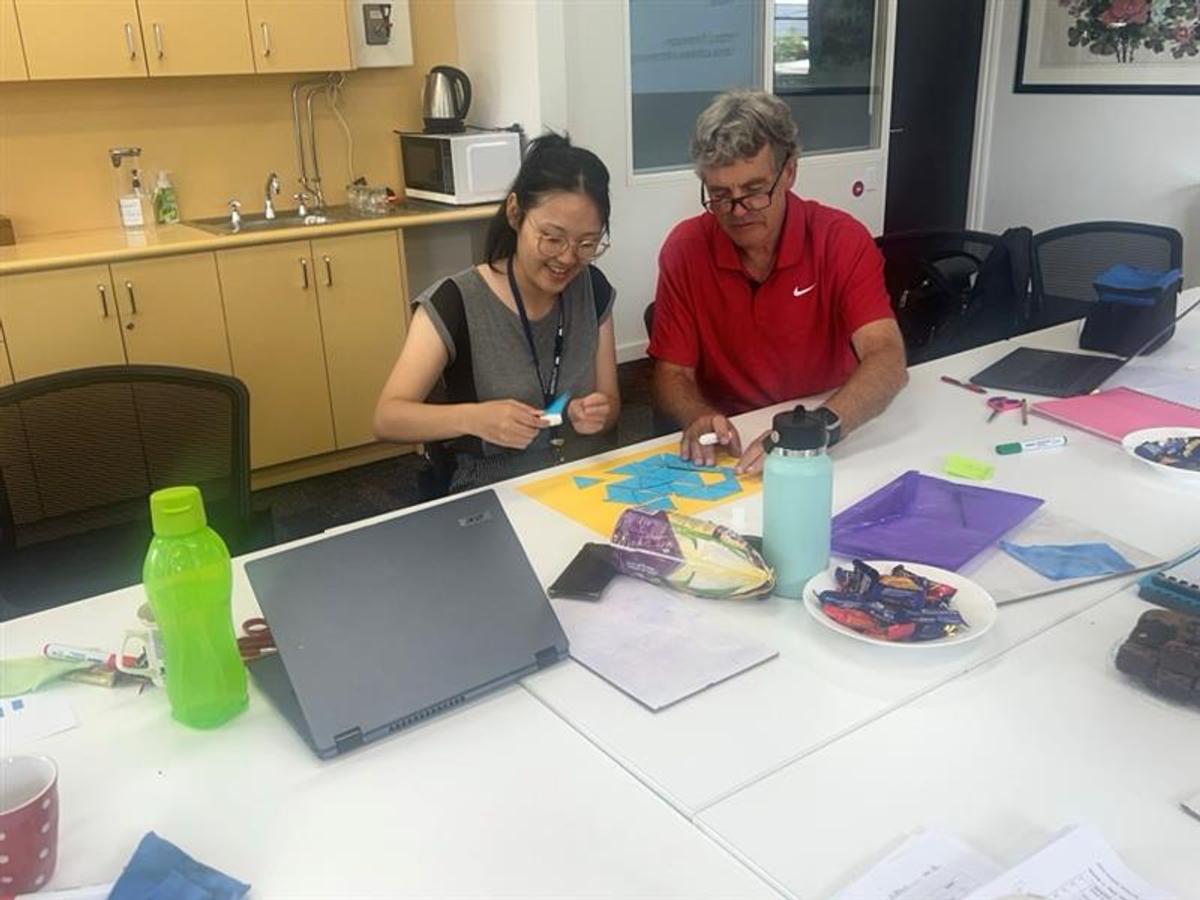
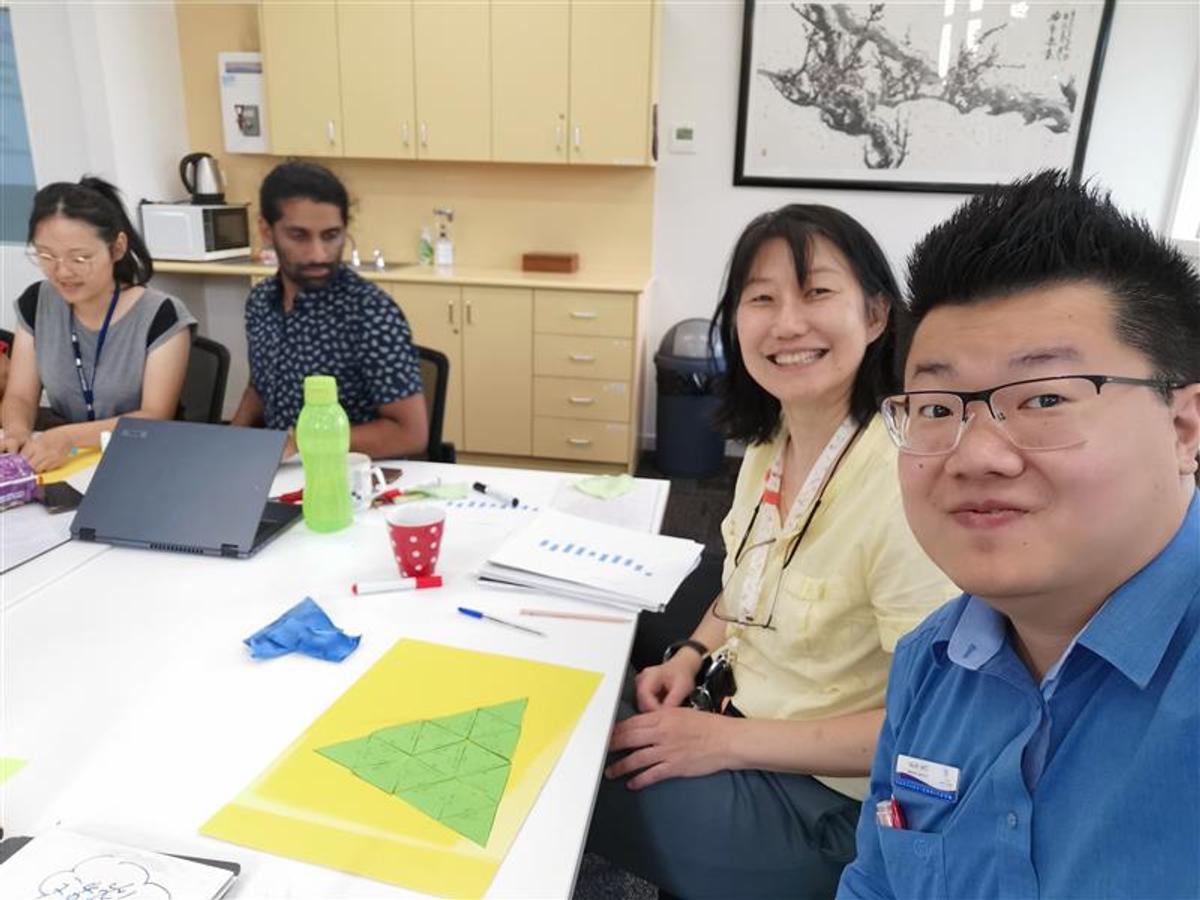
Year 7 teachers attended a Professional Development Event in preparation for the next unit which is Numbersense. Here, teachers are pictured undertaking hands-on activities that hopefully the students will enjoy in class.
Leanne Wilson
Year 7 Mathematics Leader