
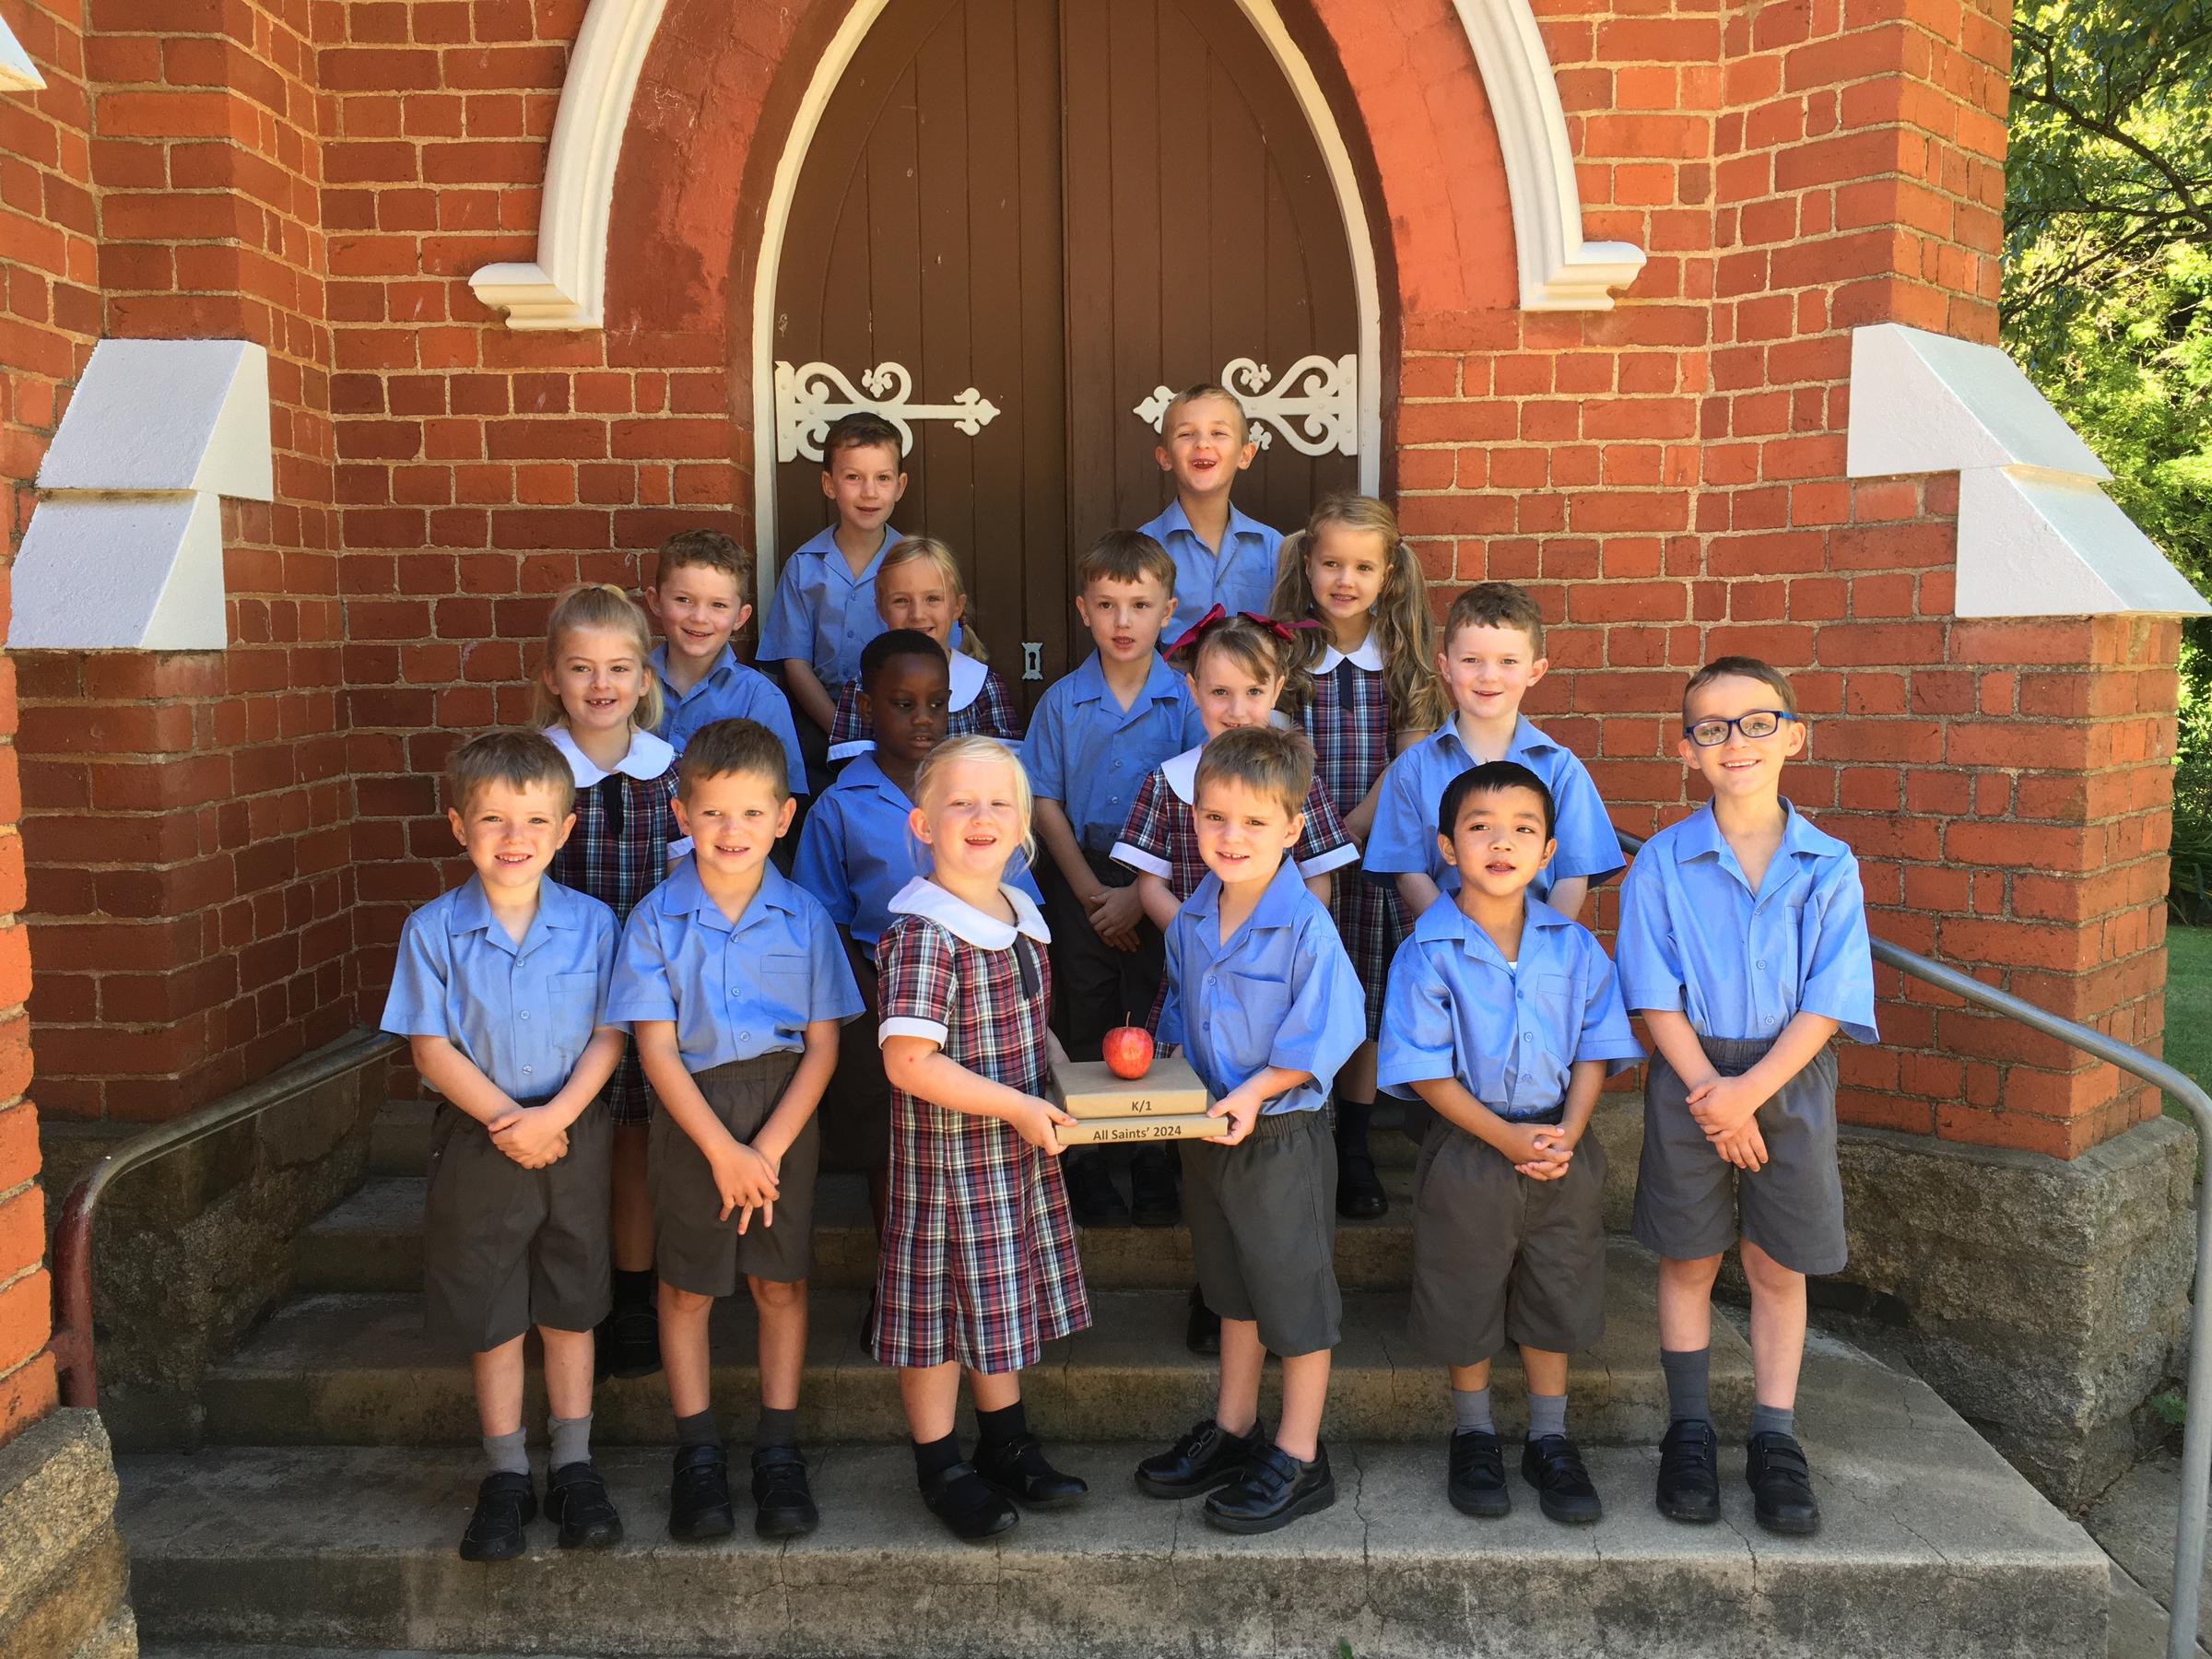
Kinder/Year 1
Over the past three weeks, K1 have been doing a deep dive into data collection. We have investigated topics of interest by choosing suitable questions to obtain appropriate data, such as How do you get to school? What’s your favourite….? Would you rather ….or ….?
We needed to ask a lot of questions! We then gathered data and tracked what has been counted by using concrete materials, tally marks, lists or symbols. We followed success criteria to draw a graphic representation of the data. We realised the more data you have, the better a graph will be able to give us information of interest.
It is then time to interpret what we see in our graphs.
Teachers modelled comparative language to describe information presented in the data display, such as ‘more than' and ‘less than’. How many more …. than…?
Graphs make it easy to interpret and identify the biggest or smallest values, the most popular/least popular.
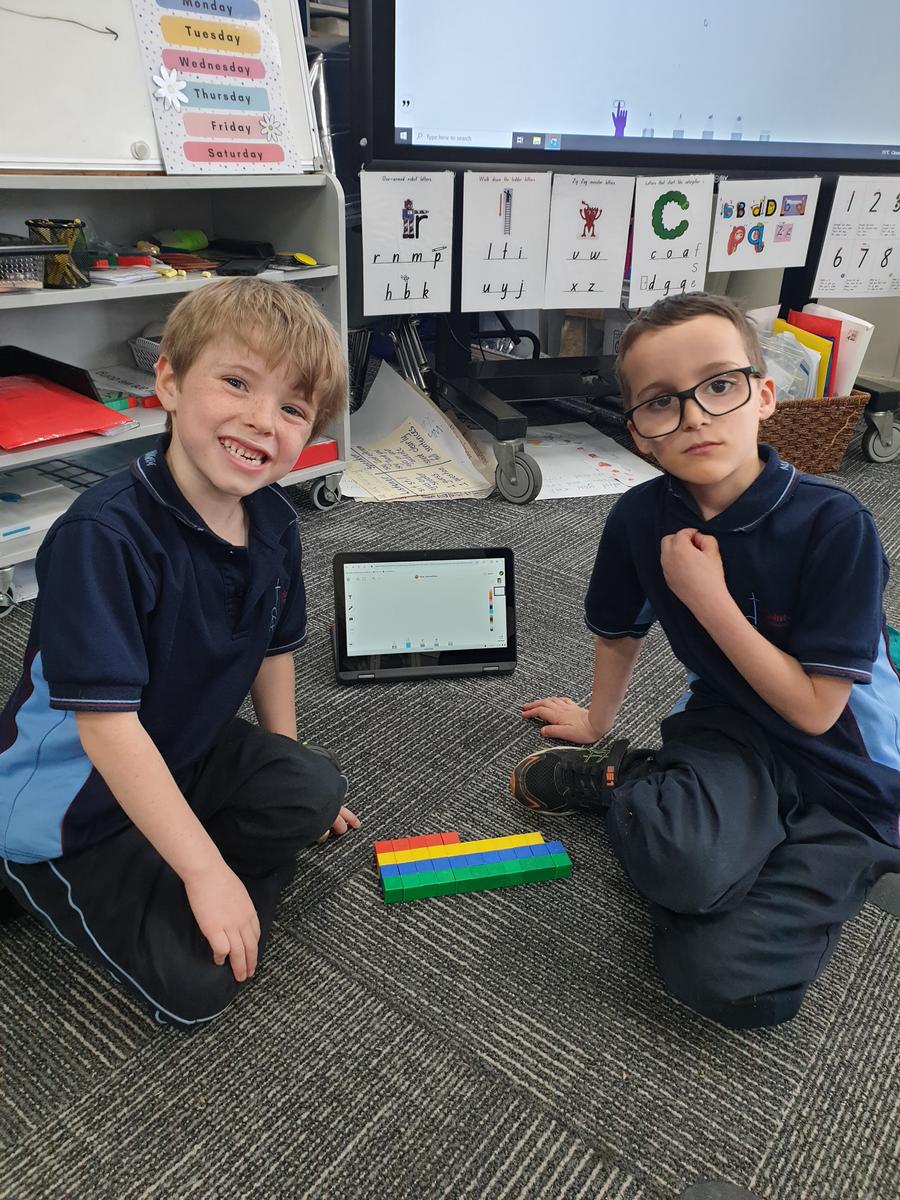
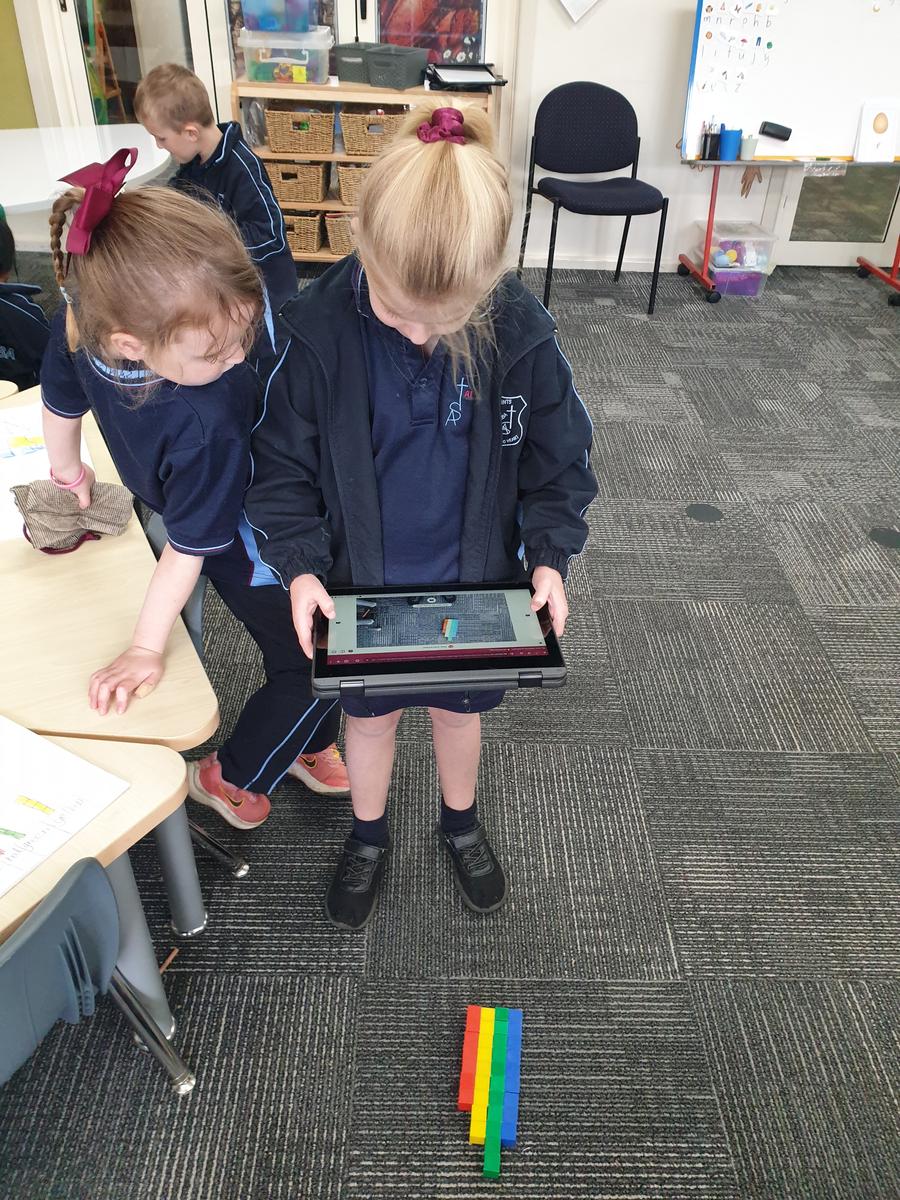
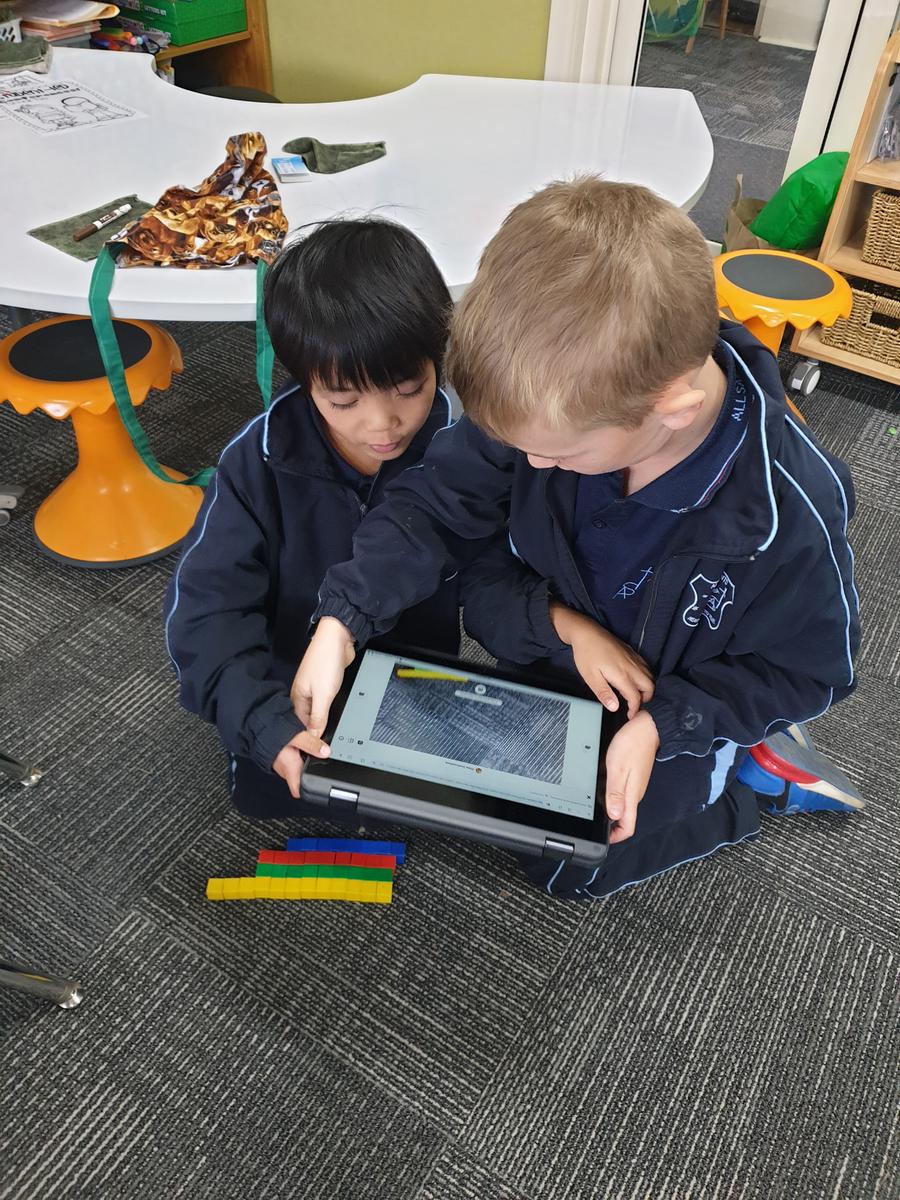
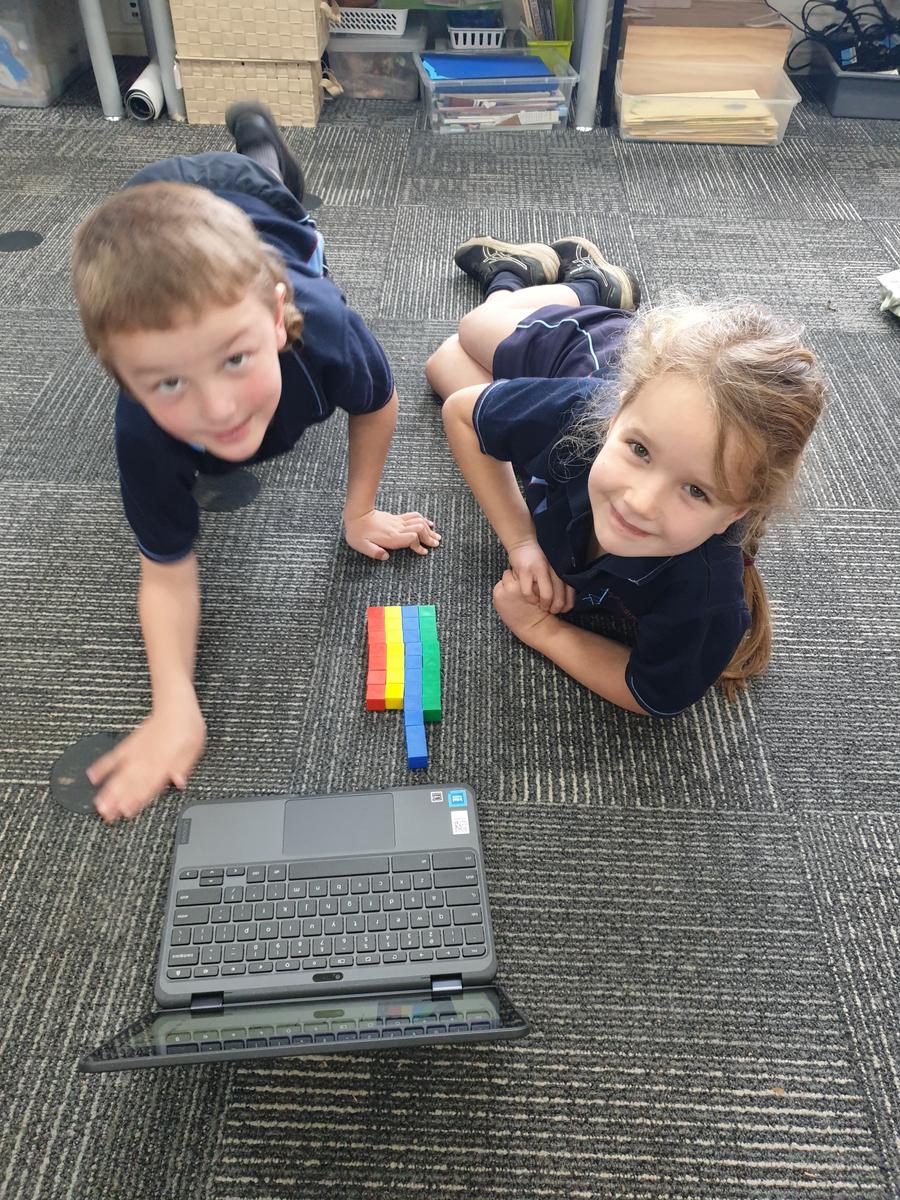
We then introduced Kinder to the Seesaw Platform. Here we can take photos of our graphs, record ourselves asking and answering questions and add text. Pretty cool!
Try a survey at home - we are very confident at data collection now!
MAE-DATA-01
A student contributes to collecting data and interprets data displays made from objects.
MA1-DATA-01
A student gathers and organises data, displays data in lists, tables and picture graphs.
MA1-DATA-02
A student reasons about representations of data to describe and interpret the results.