Year 2 Highlight

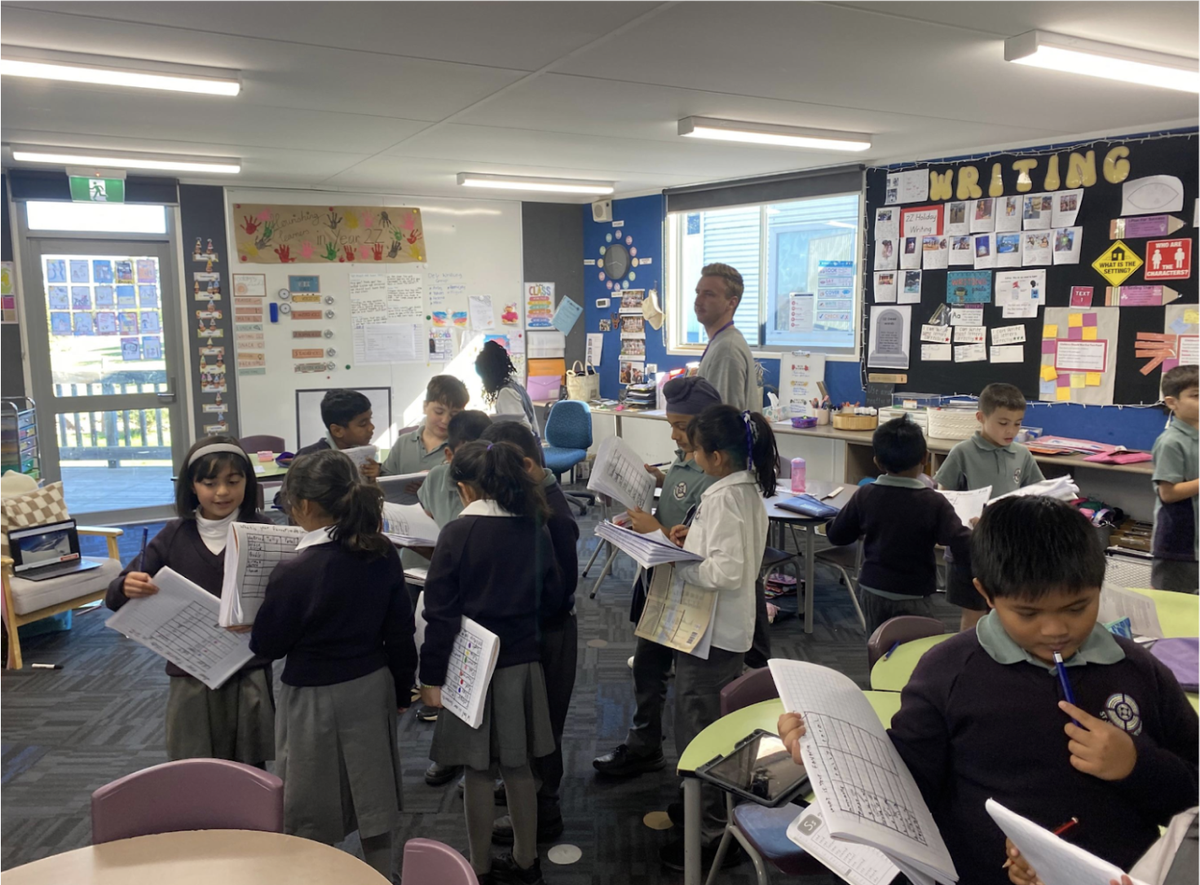
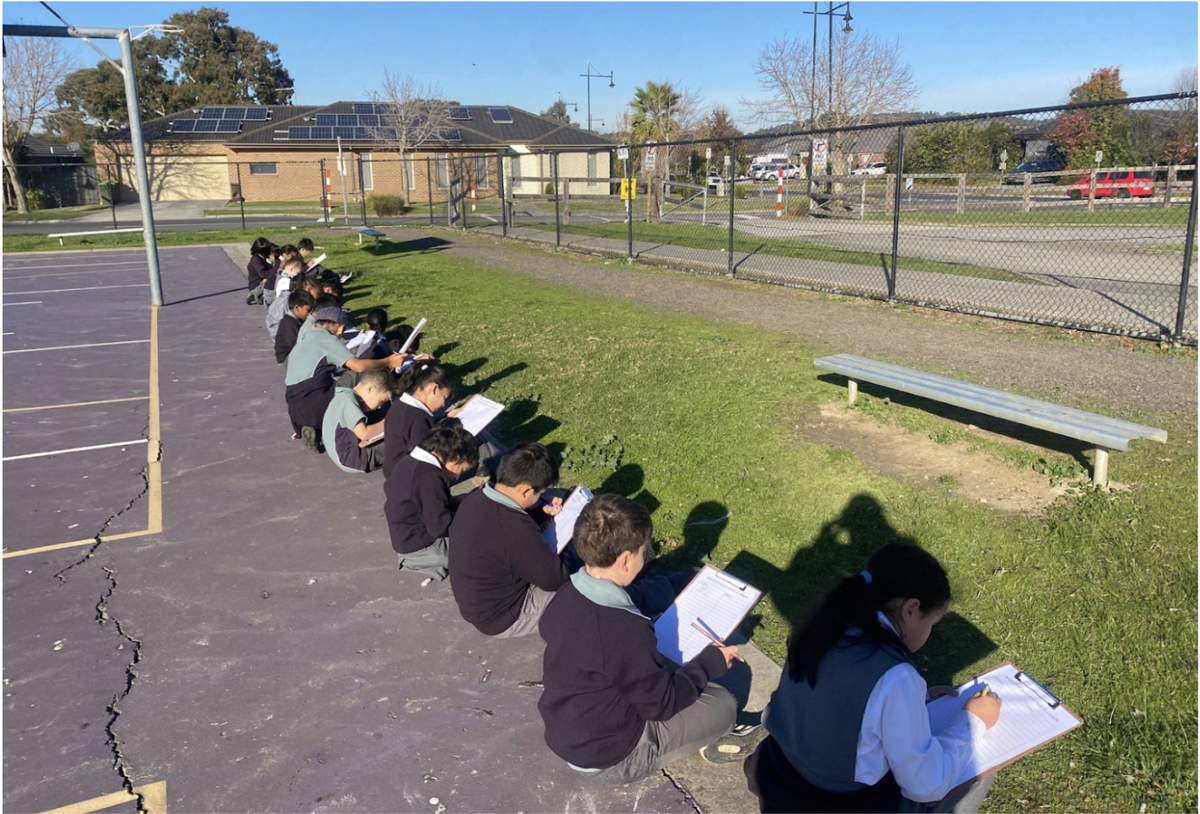
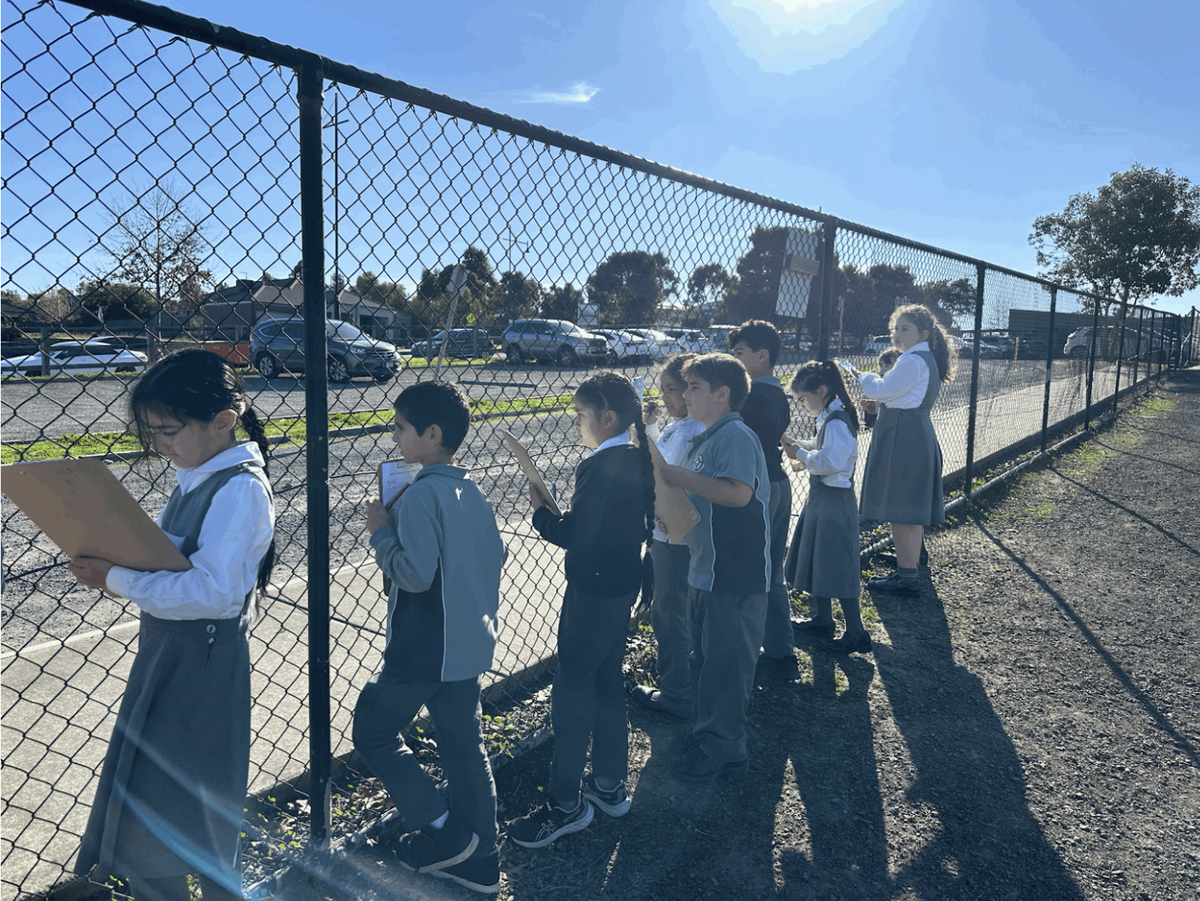
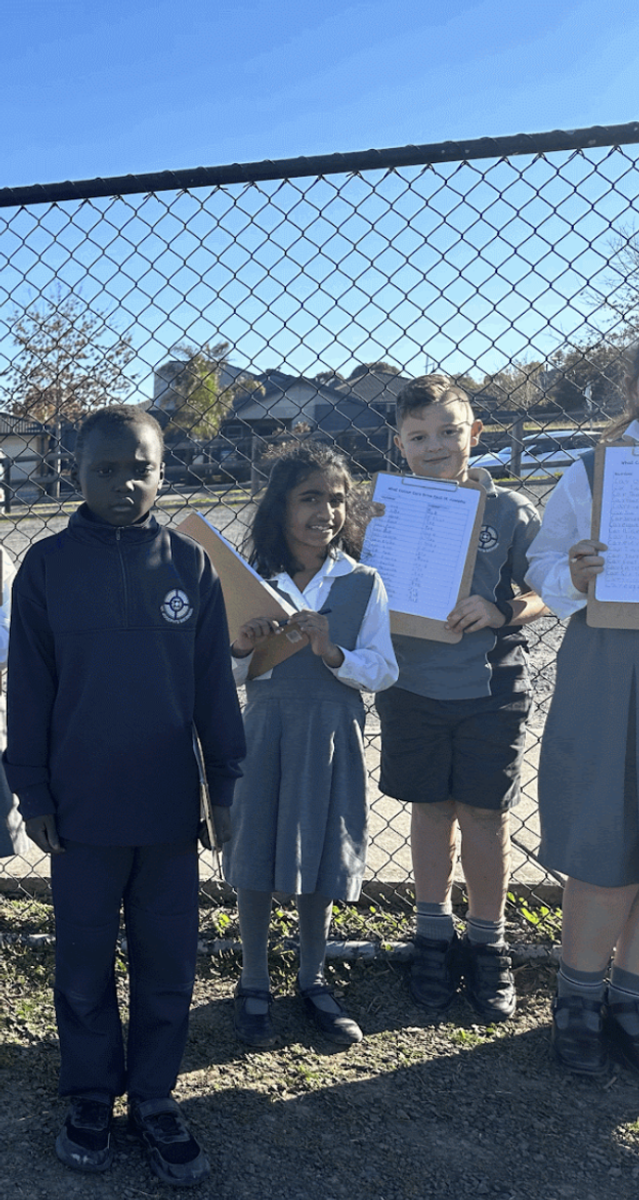
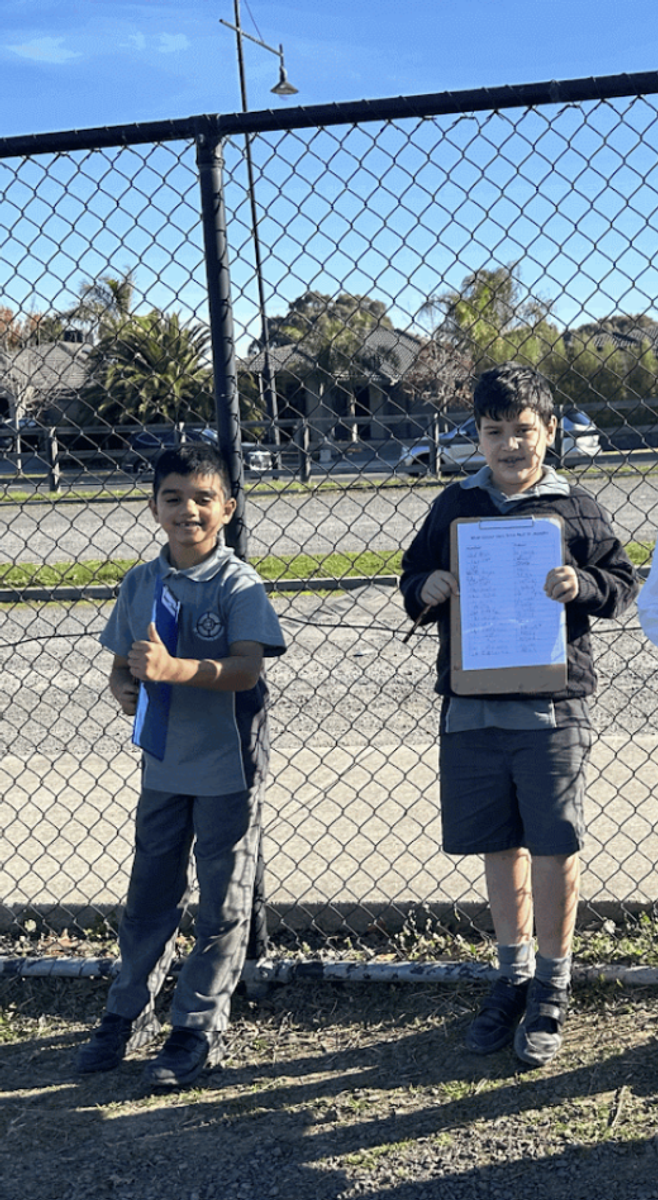
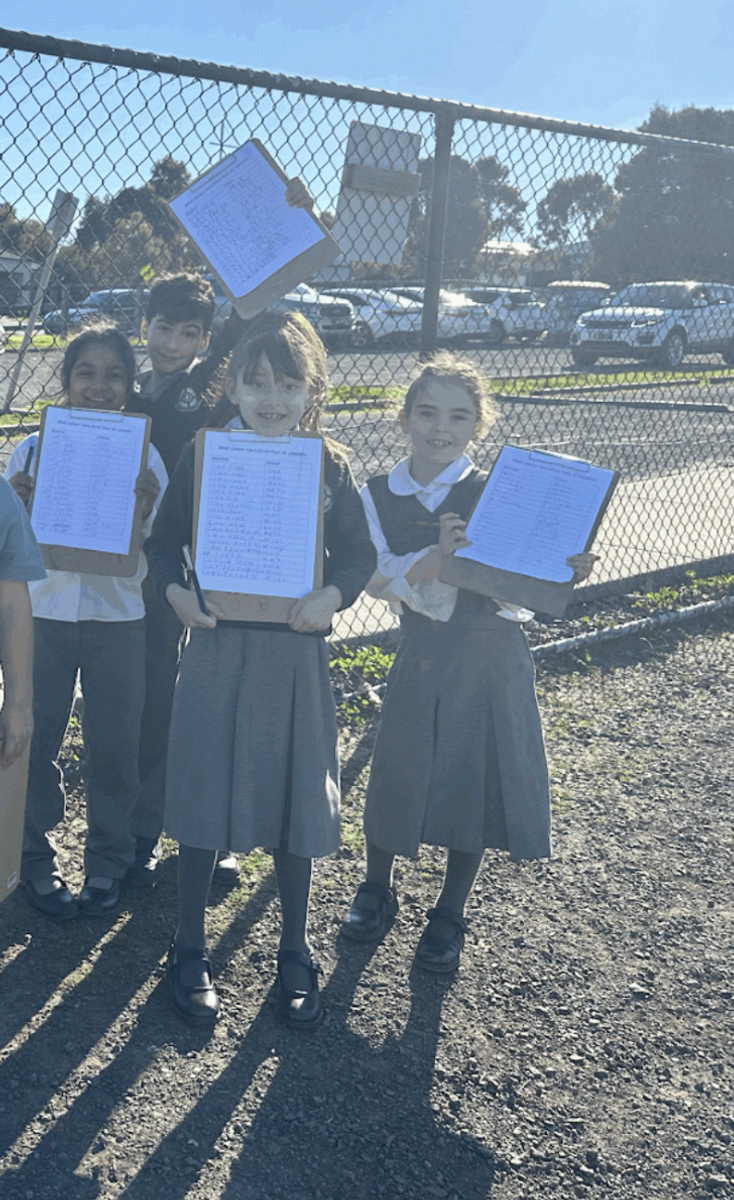
This week the students in Year Two have been learning about Data and Statistics. They have been practising collecting data and representing this on displays. Students have completed Tally Graphs to record information about a range of topics. The students were most excited when they took their data sheets outside and recorded the colour cars that drove past us!
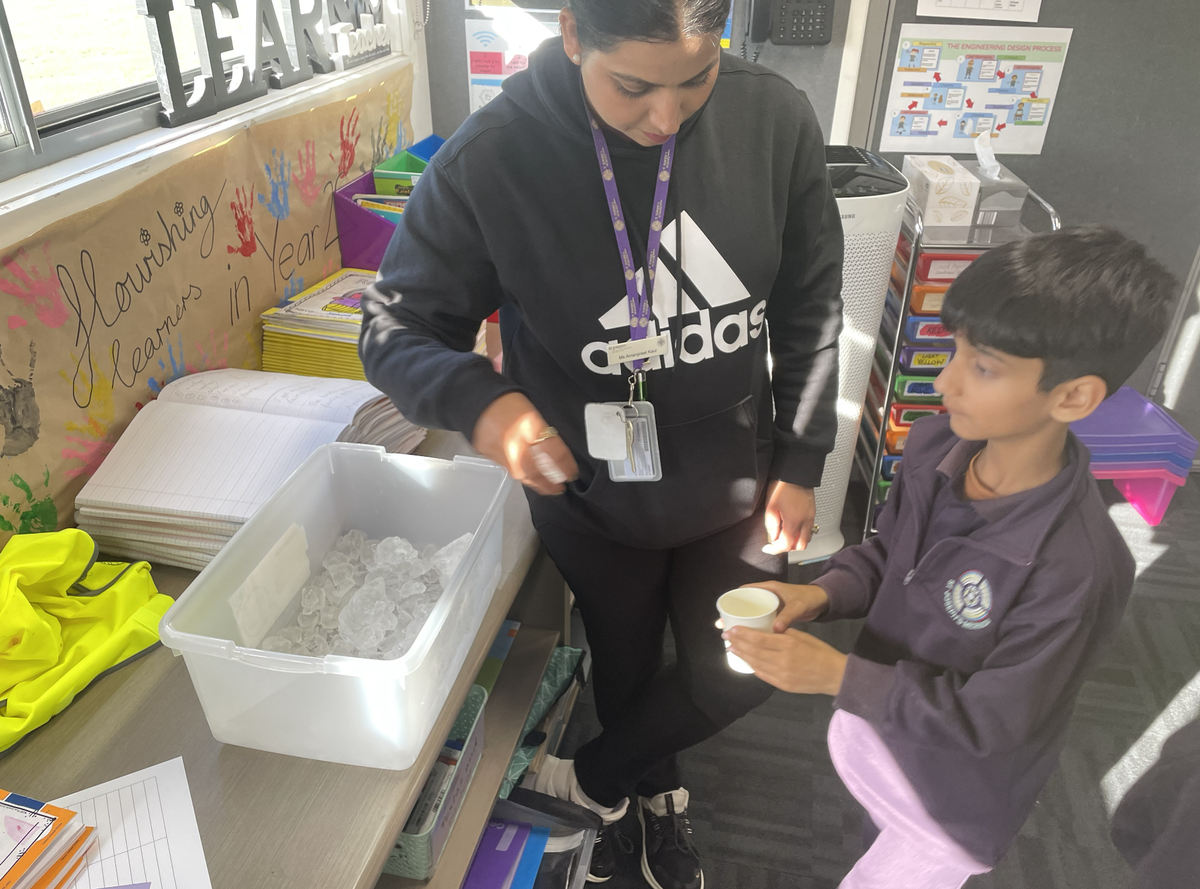
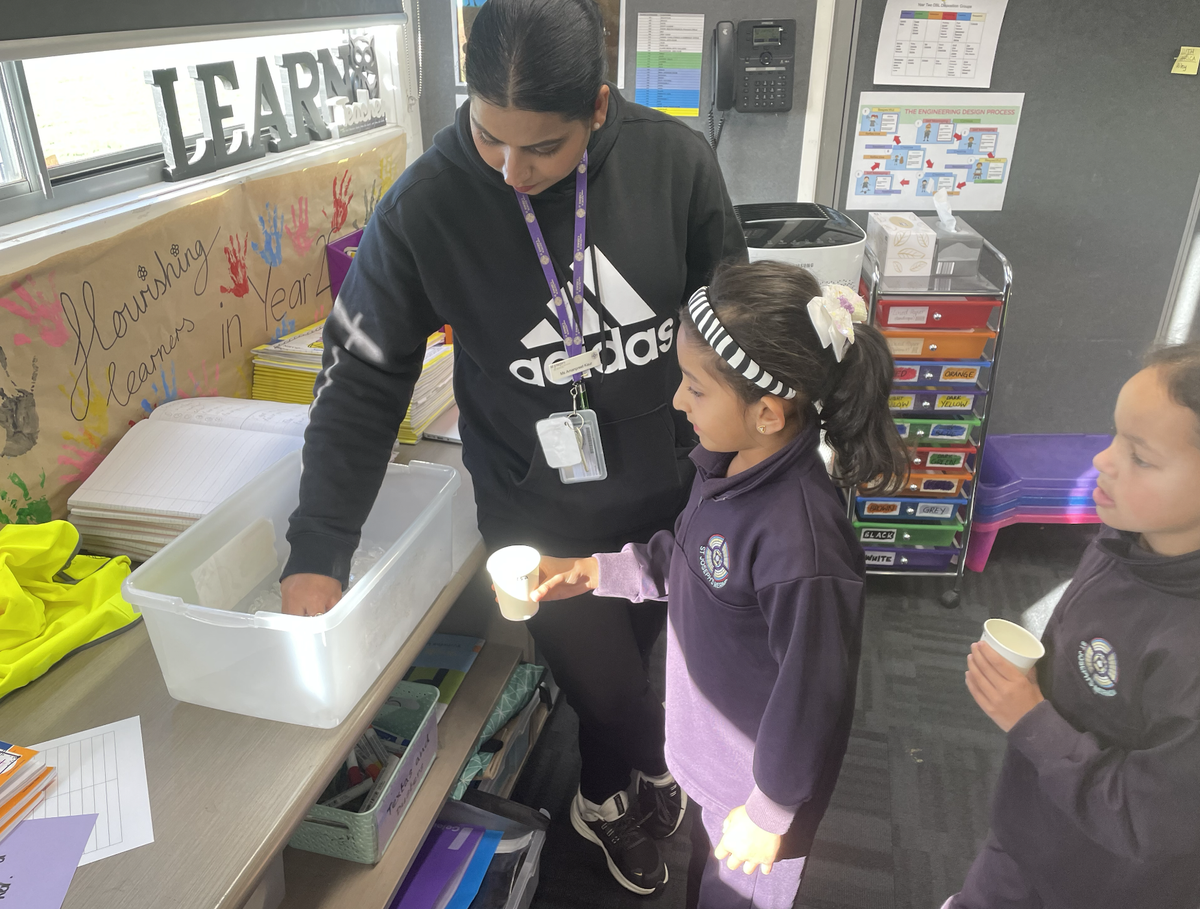
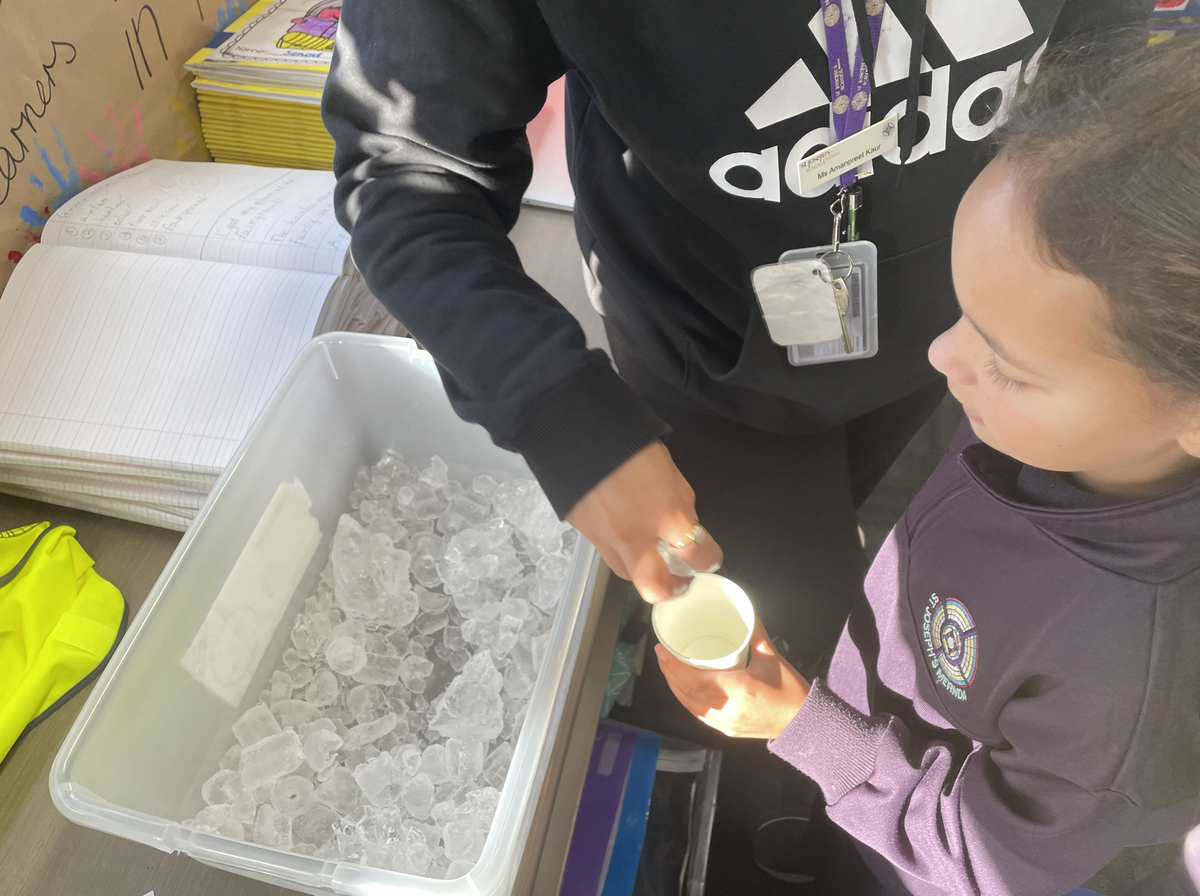
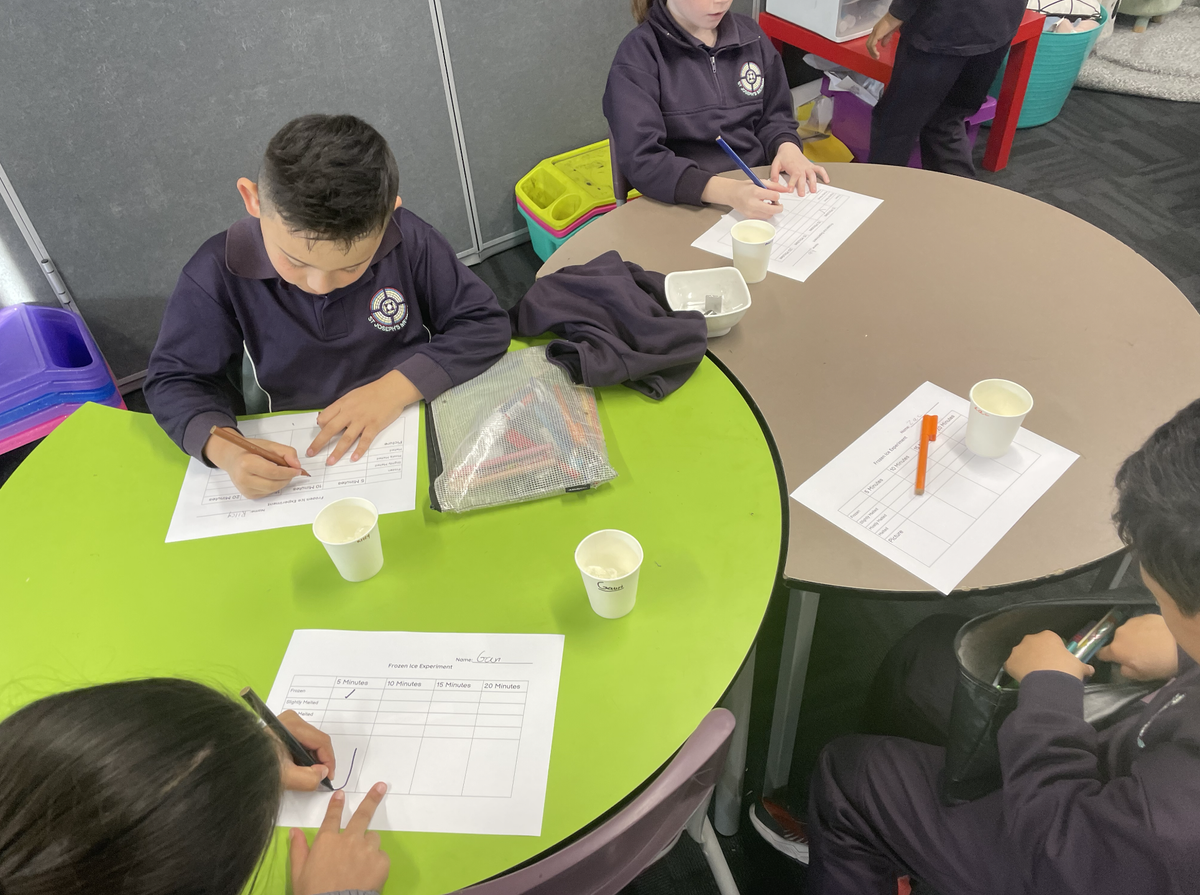
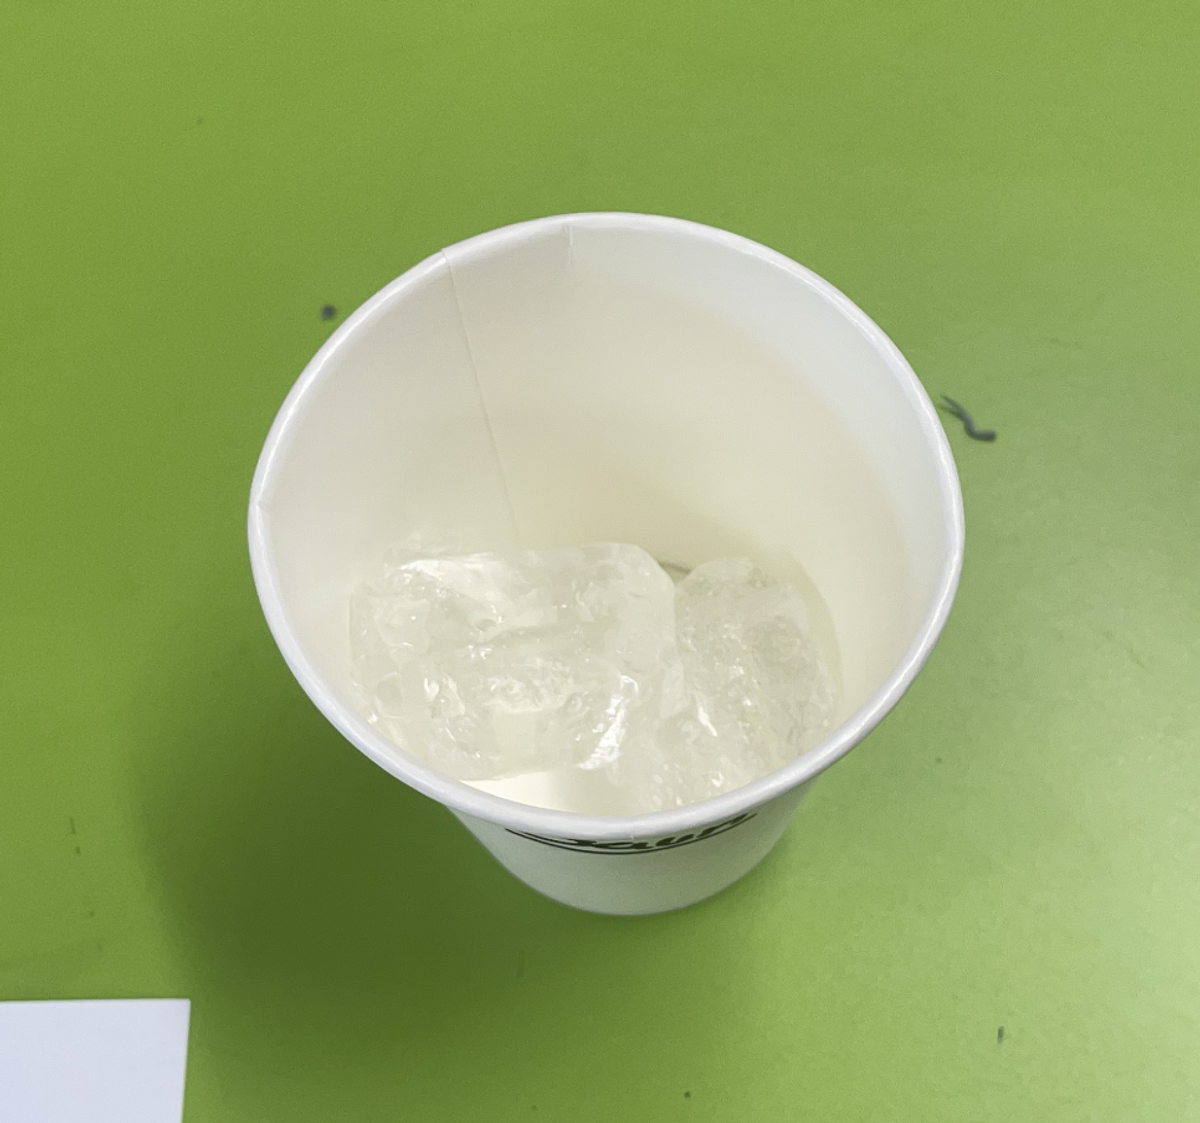
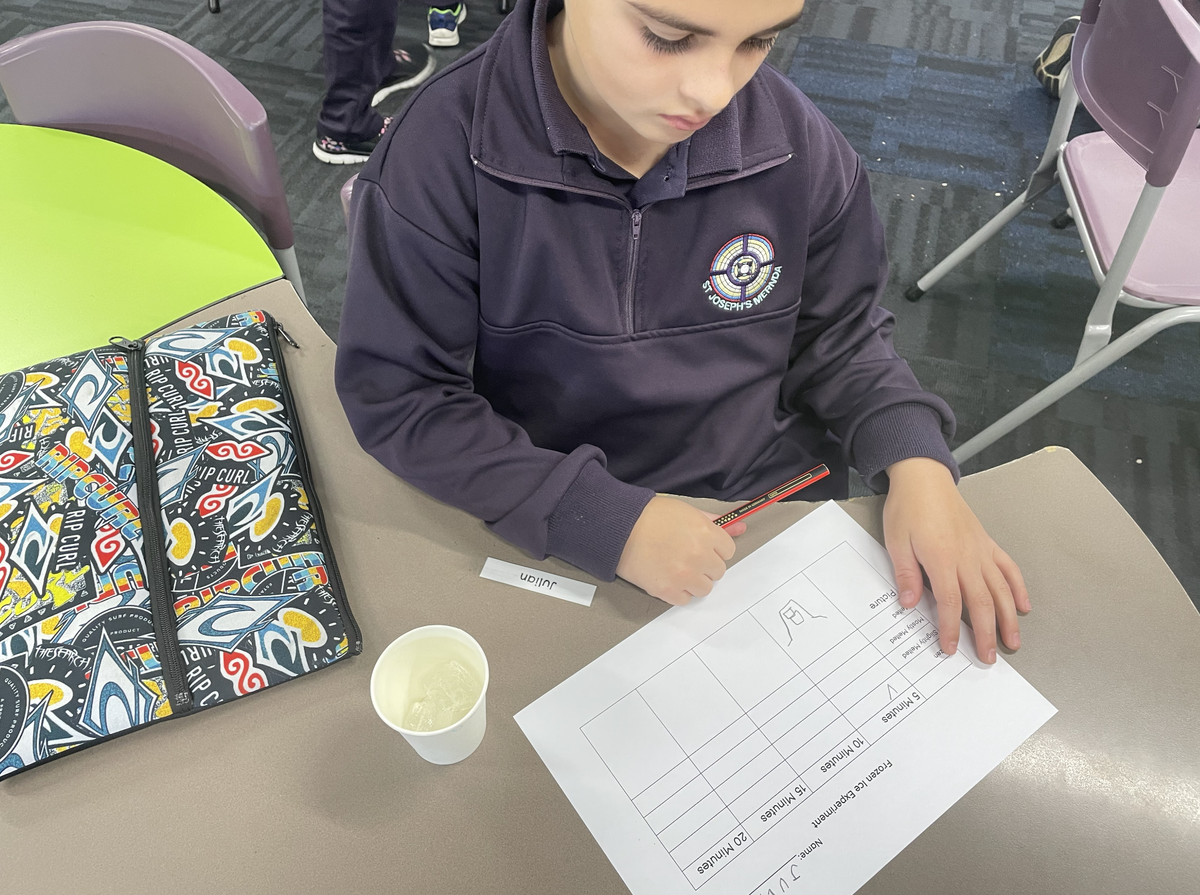
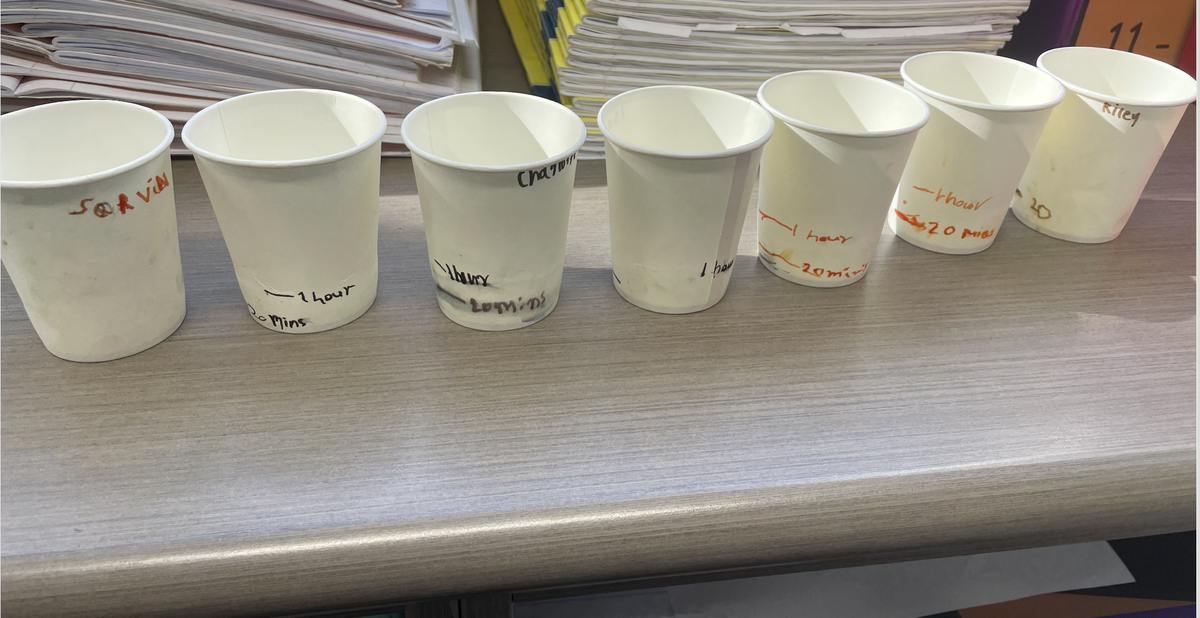
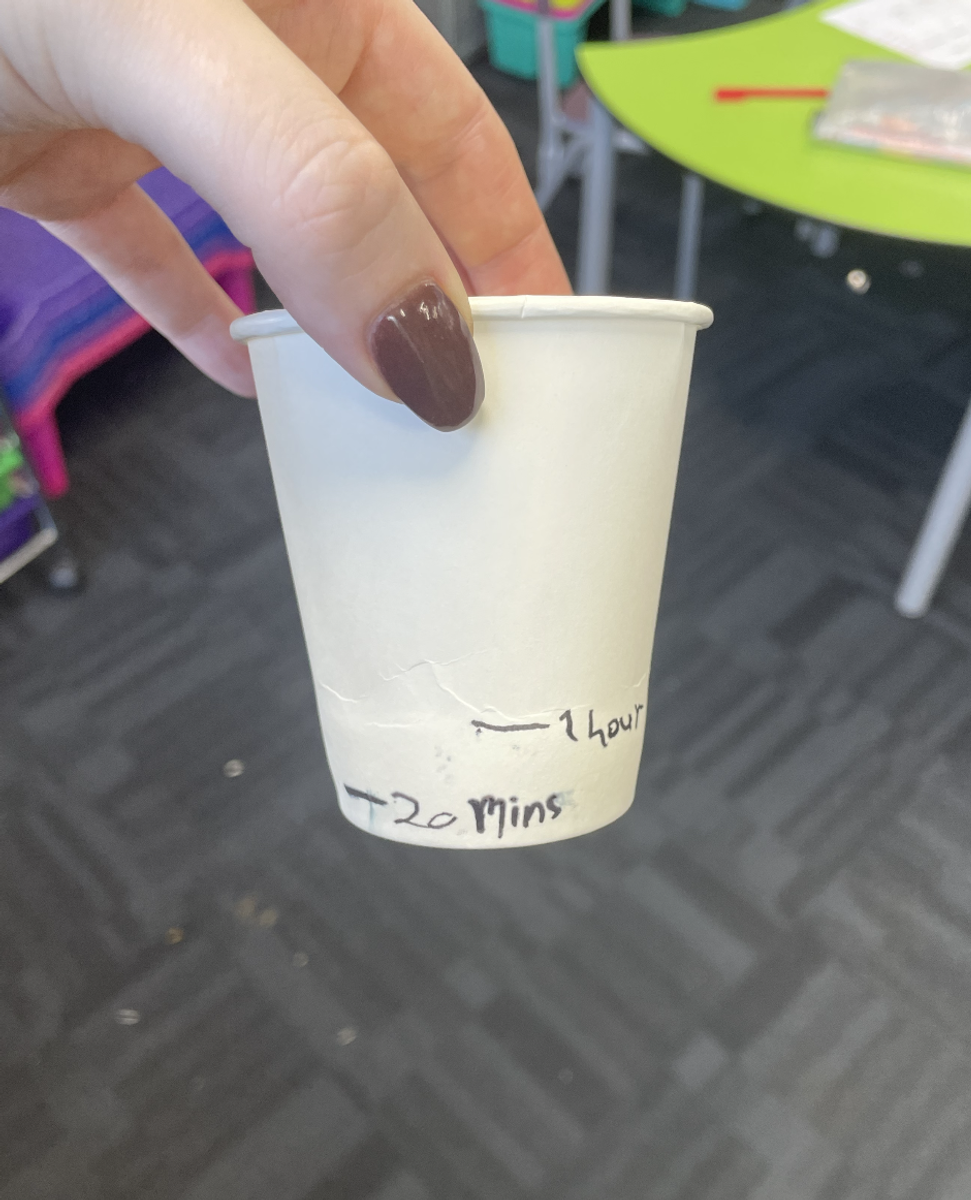
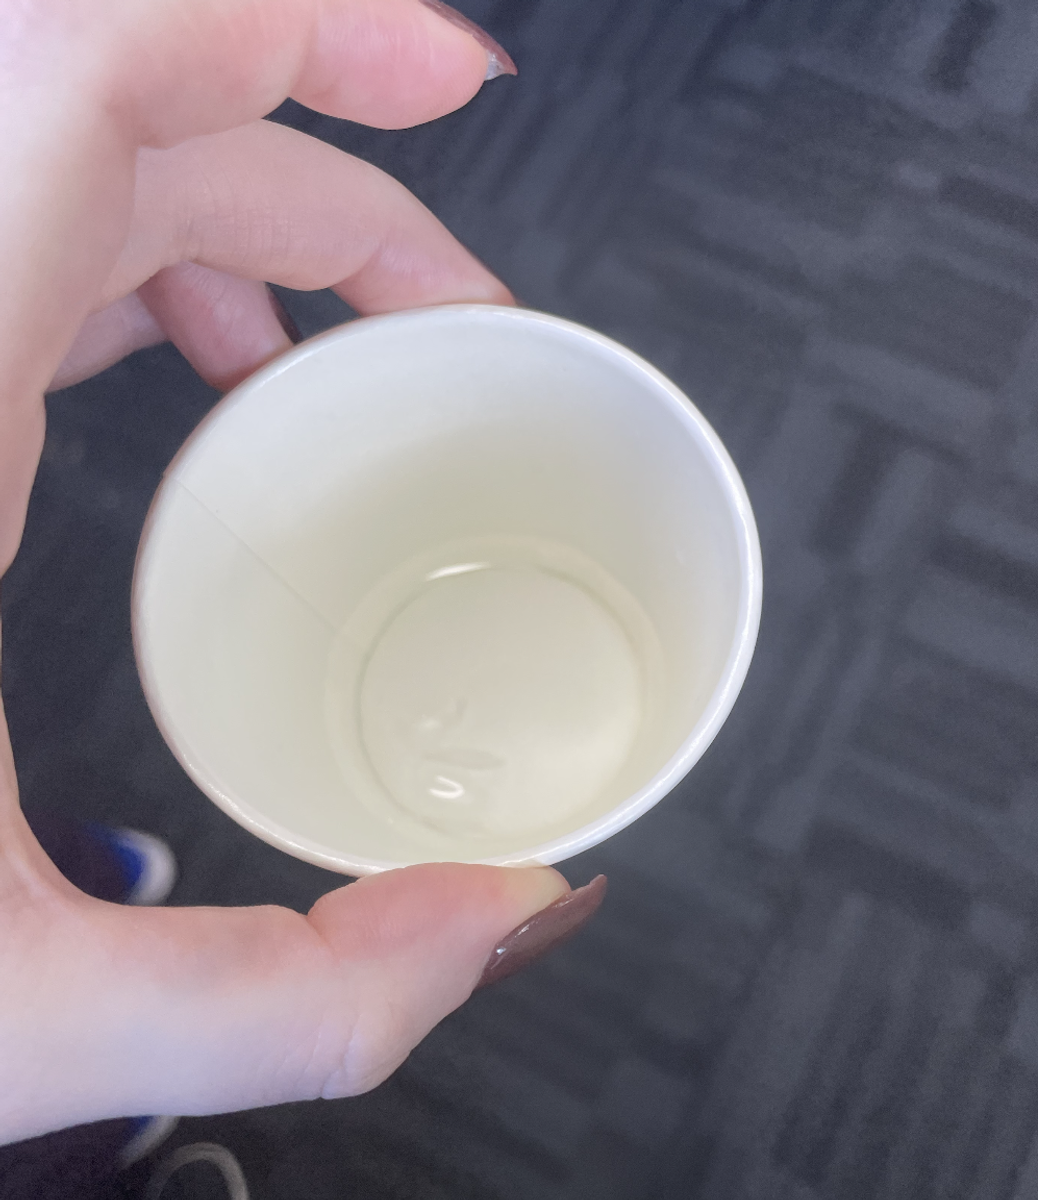
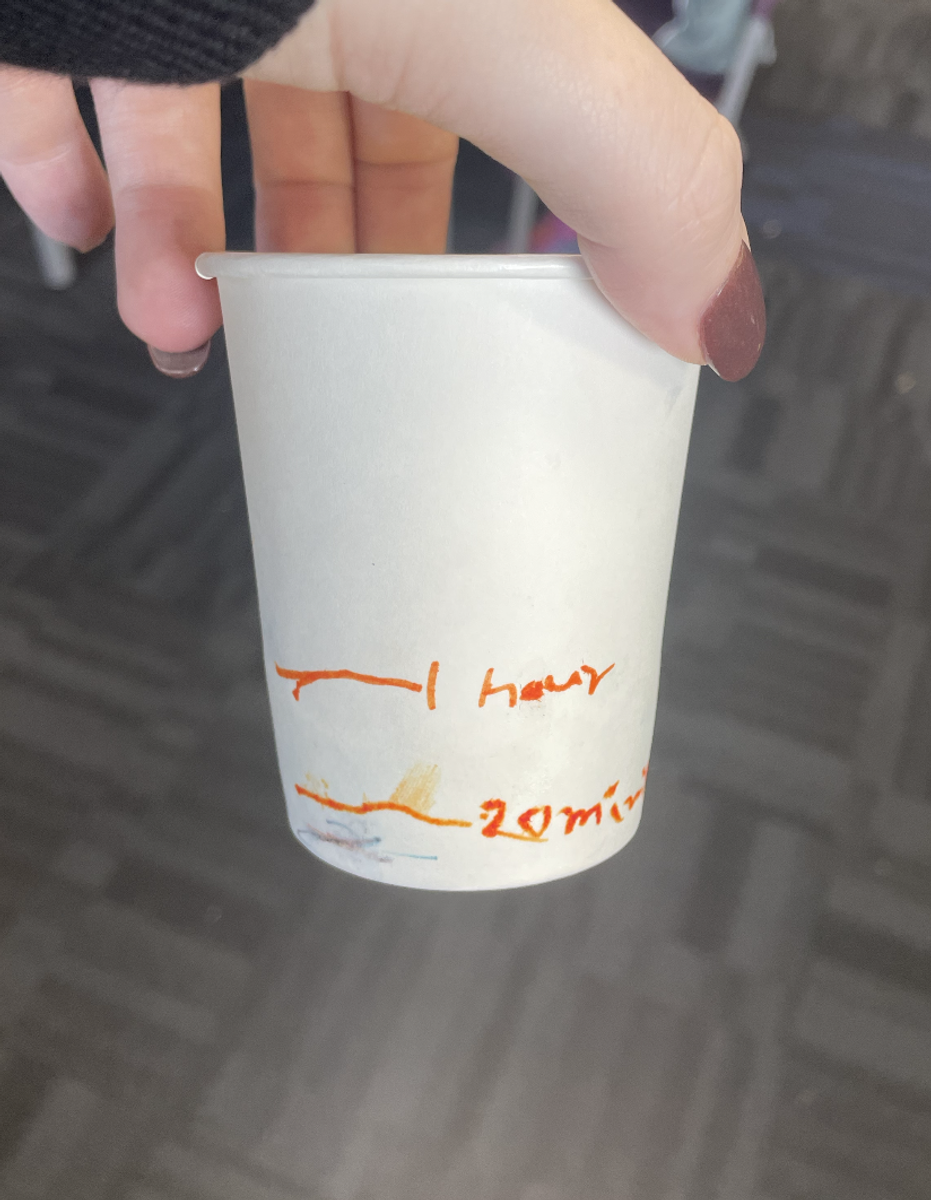
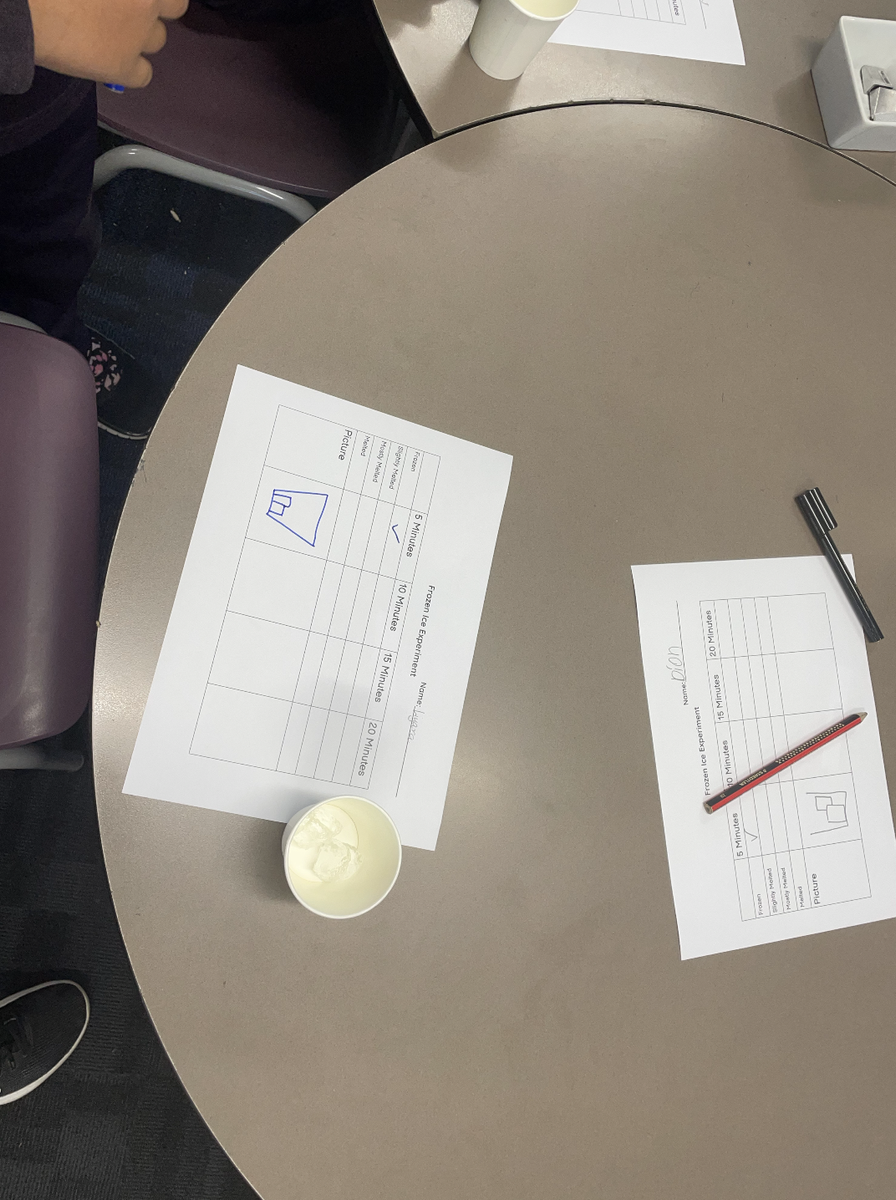
Another highlight was completing an experiment and collecting data along the way. They used a data sheet to collect information on how long it took an ice cube to melt. Students observed the changes over time and indicated whether the ice was frozen, slightly melted, mostly melted or melted.

