
Grade 3/4 Bulletin

Learning Intention: To analyse a data set to develop a deeper understanding and to draw conclusions.
Learning Experience Overview
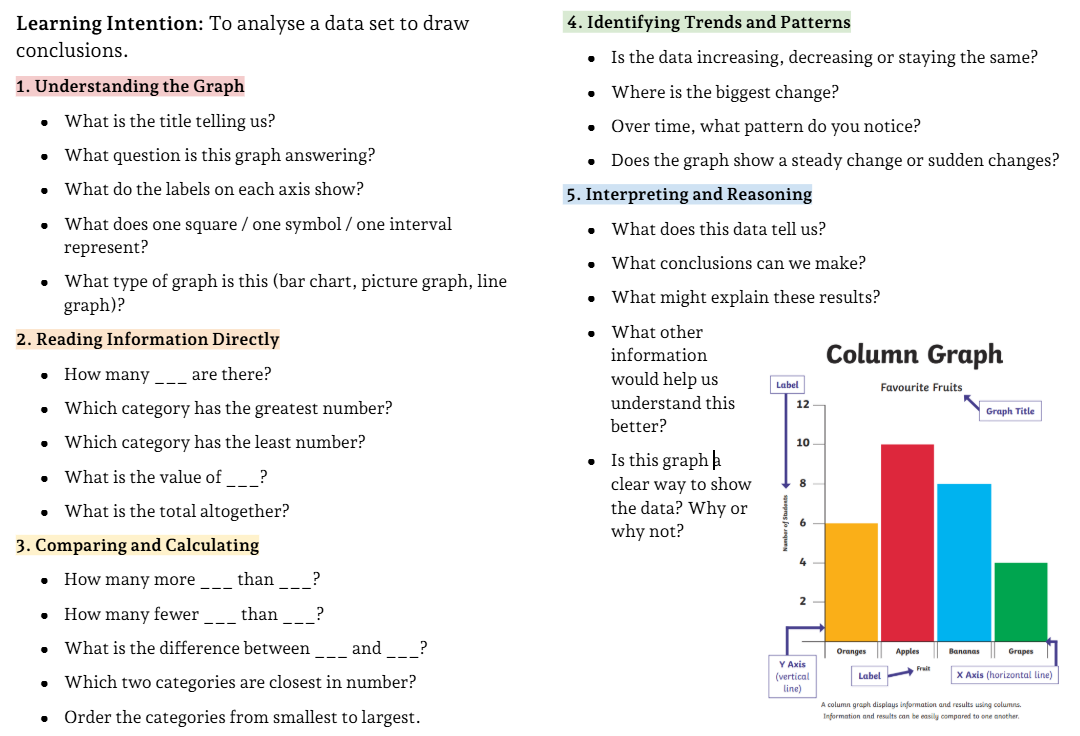
This week and next week in Maths, students are exploring how to read and understand different types of graphs. Together we looked closely at how information is organised in a graph and discussed the clues that help us make sense of the data. By slowing down and asking ourselves simple questions, students practised noticing important features such as the title, labels and scale. This helped them think about what the graph is showing and what conclusions they can draw from the information presented. The goal of this learning was to build students’ confidence in interpreting data so they can explain what the information means rather than just reading the numbers.
Fluency
In our maths fluency sessions, students have been focusing on additive strategies. These fluency sessions go for between 5 and 7 minutes. This includes building confidence with both addition and subtraction while developing quick recall of number facts. The goal of this work is to support automaticity so that students can access number facts quickly and use them confidently.
Whole
During the whole-class learning session, the teacher modelled how to carefully analyse a graph by thinking aloud and working through a set of guiding questions. Using an anchor chart, the teacher explored how to identify the important features of a graph such as the title, labels, scale and the information being presented. Students followed along with their own copy of the questions and ticked them off as the teacher examined the graph step by step. This process helps students understand how to unpack a graph independently and recognise the key details that allow them to interpret data accurately. Some of the questions the teacher thought about out loud are below;
Small
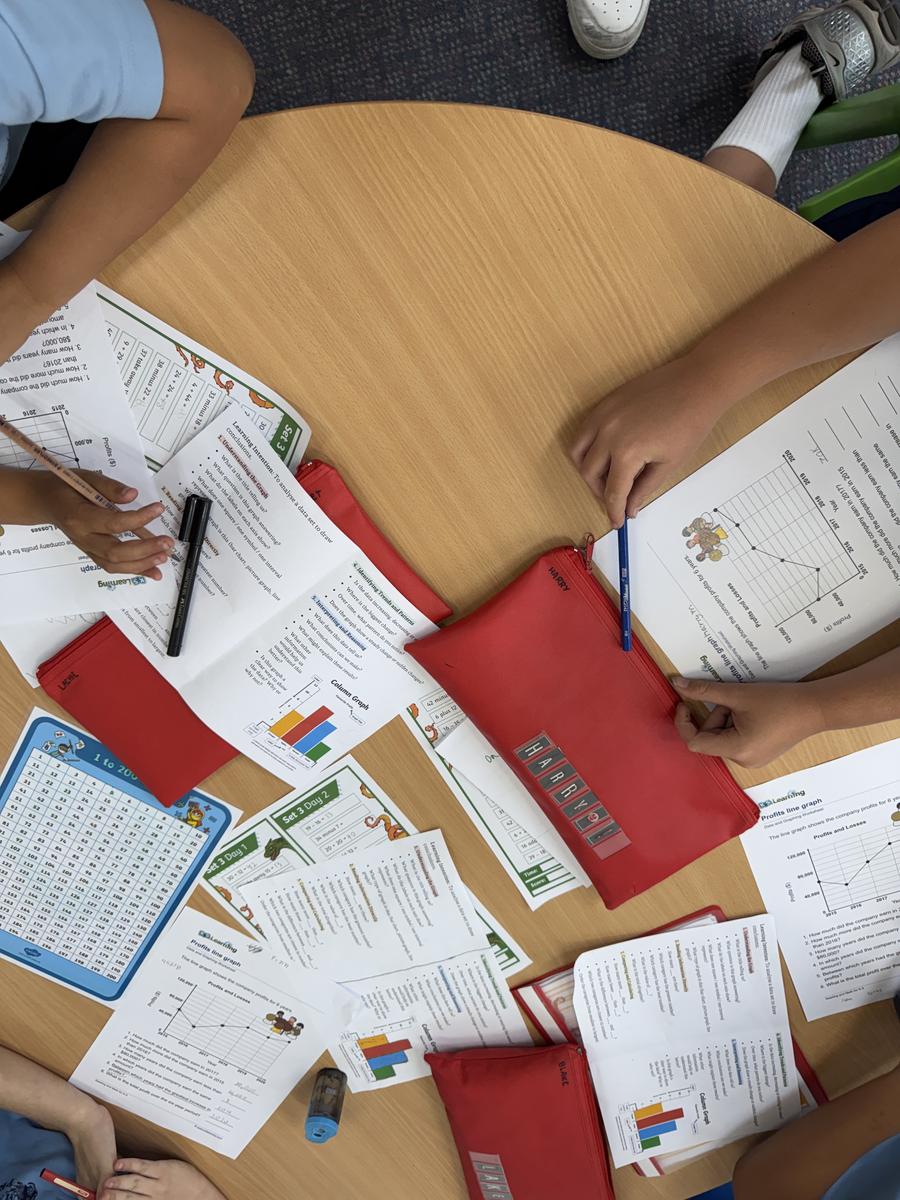
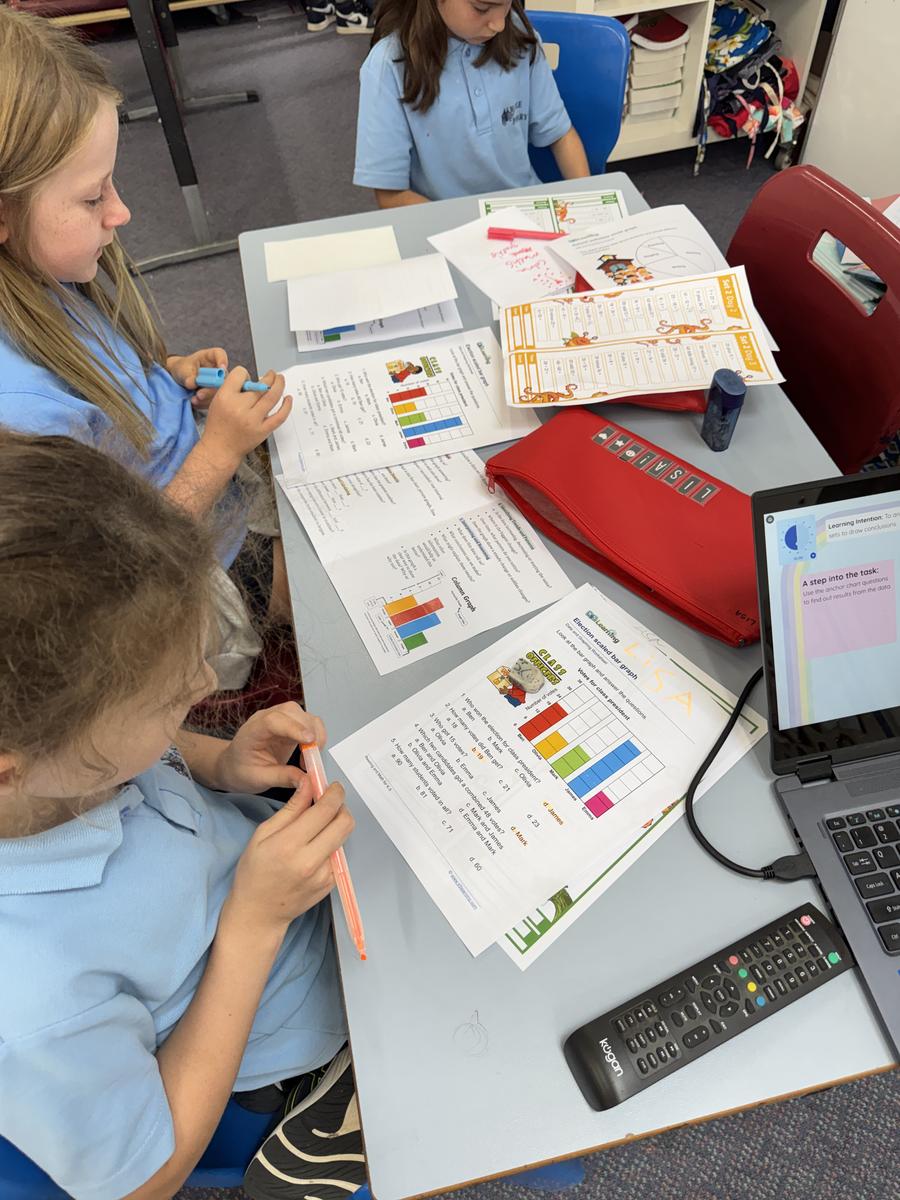
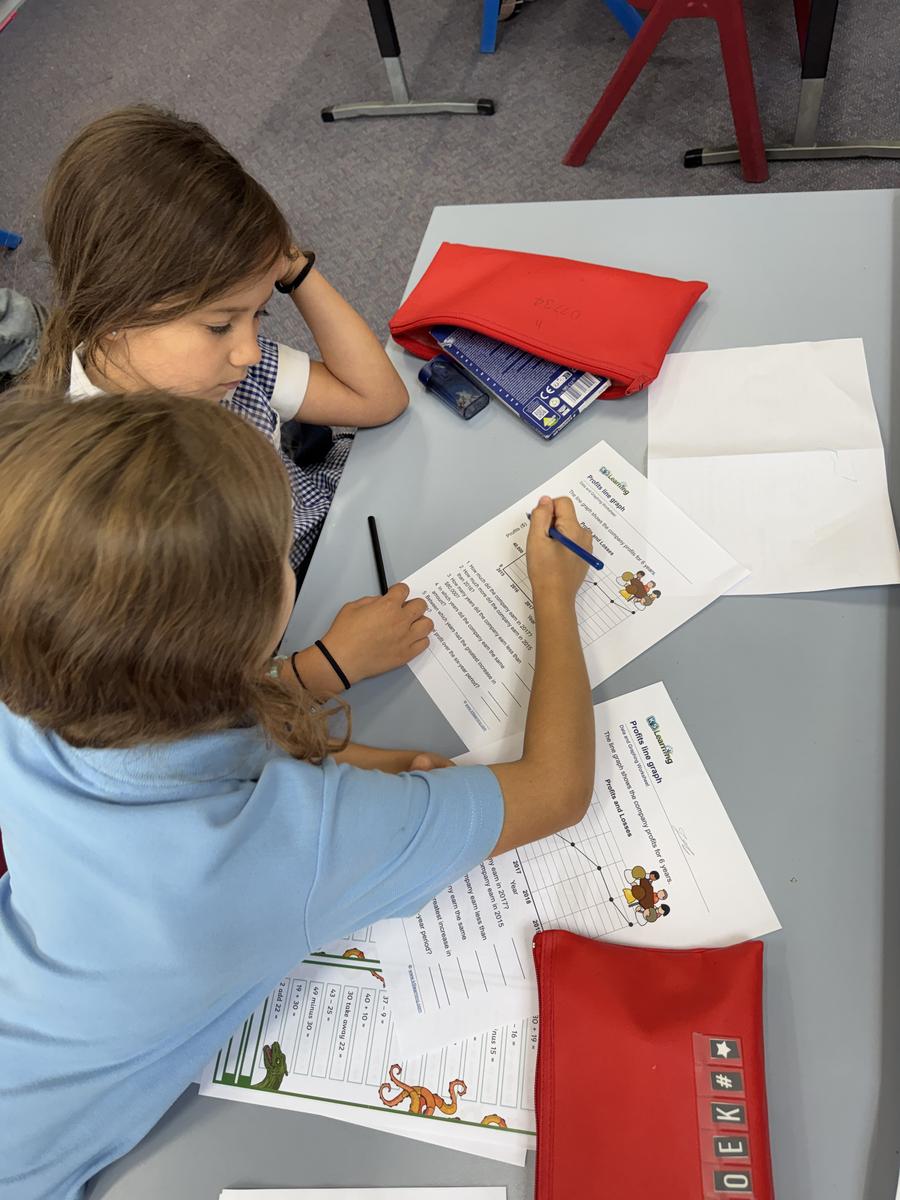
Students then applied this thinking by working with a range of different graph types, including bar graphs, line graphs and pie charts. Using the same anchor chart from the whole session, students analysed each graph and answered questions about the information presented. The guiding questions helped students stay focused on the important features of each graph while building confidence in interpreting data and drawing conclusions.
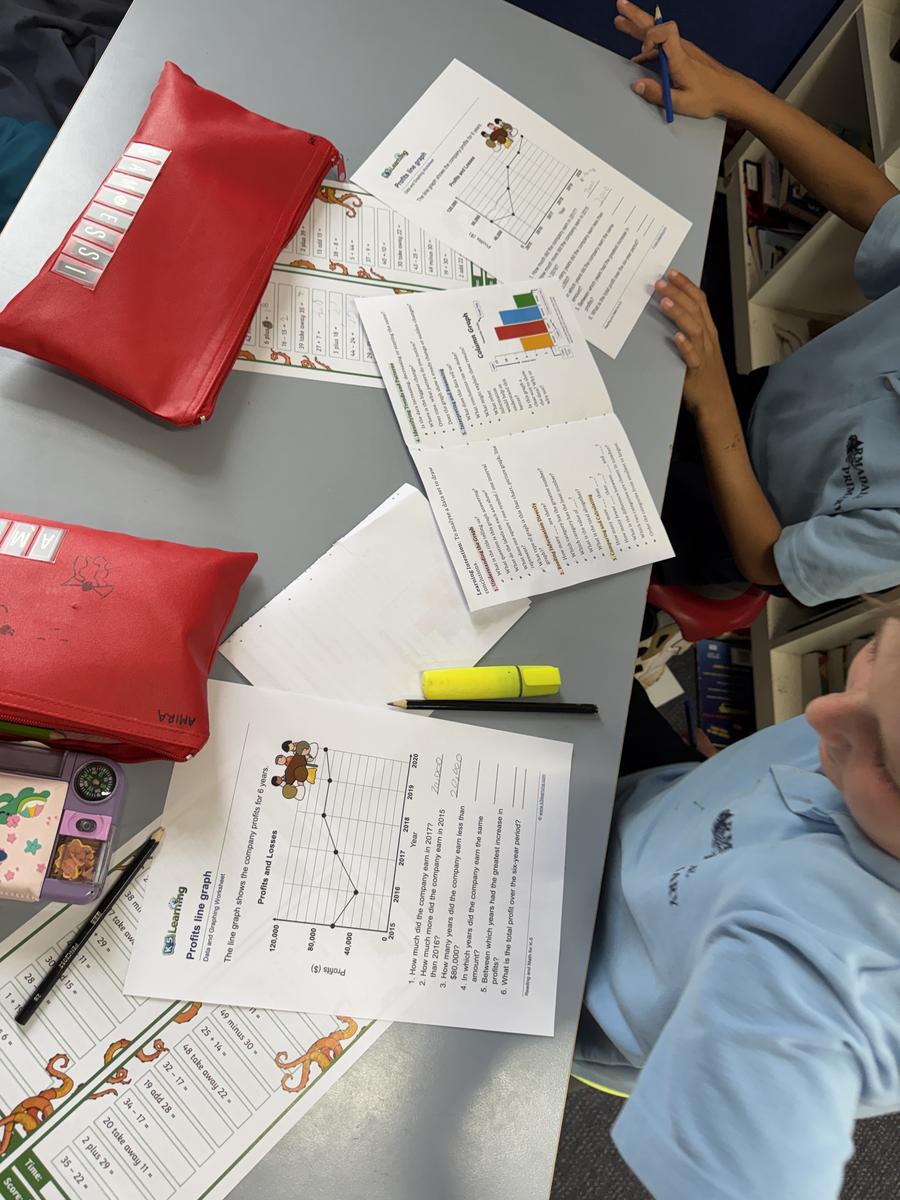
Stretch and Challenge: Students who feel confident interpreting the initial graphs are provided with a more complex and unfamiliar graph. Using the same anchor chart, they analyse this new data set. This encourages students to apply the same thinking strategy to a more challenging example while deepening their ability to interpret and explain data.
Whole
Throughout the learning process, the class paused for short check-ins where the teacher highlighted examples of students using the class anchor chart to support their thinking. During these moments, the teacher shared how a student was using the guiding questions to carefully unpack the graph they were analysing. These check-ins reinforced how the questions can support students to slow down, think carefully and interpret graphs with greater confidence.
Thank you for your ongoing support,
Richard, Brigitte and Rosanna
Year 3/4 Team
richard.cornell@education.vic.gov.au