6P
Hello from 6P

6P
Hello from 6P
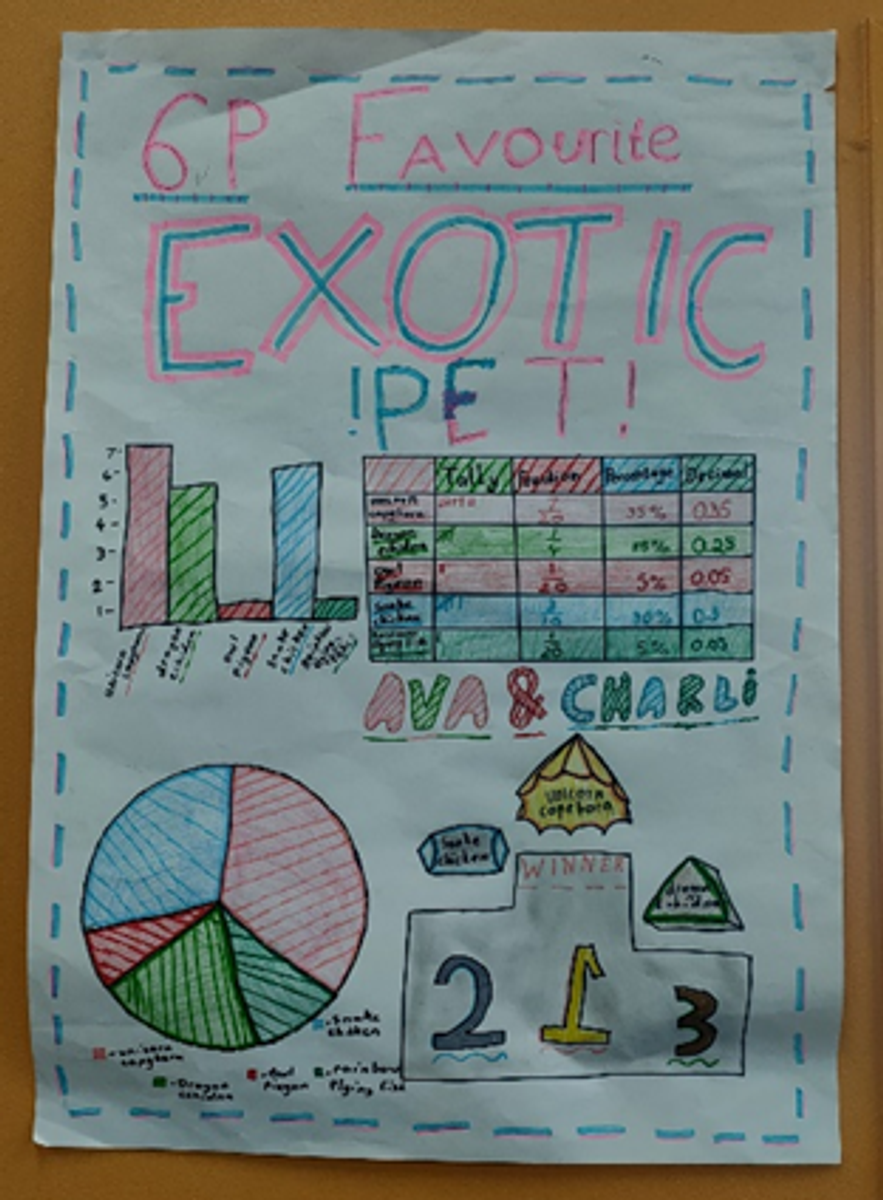
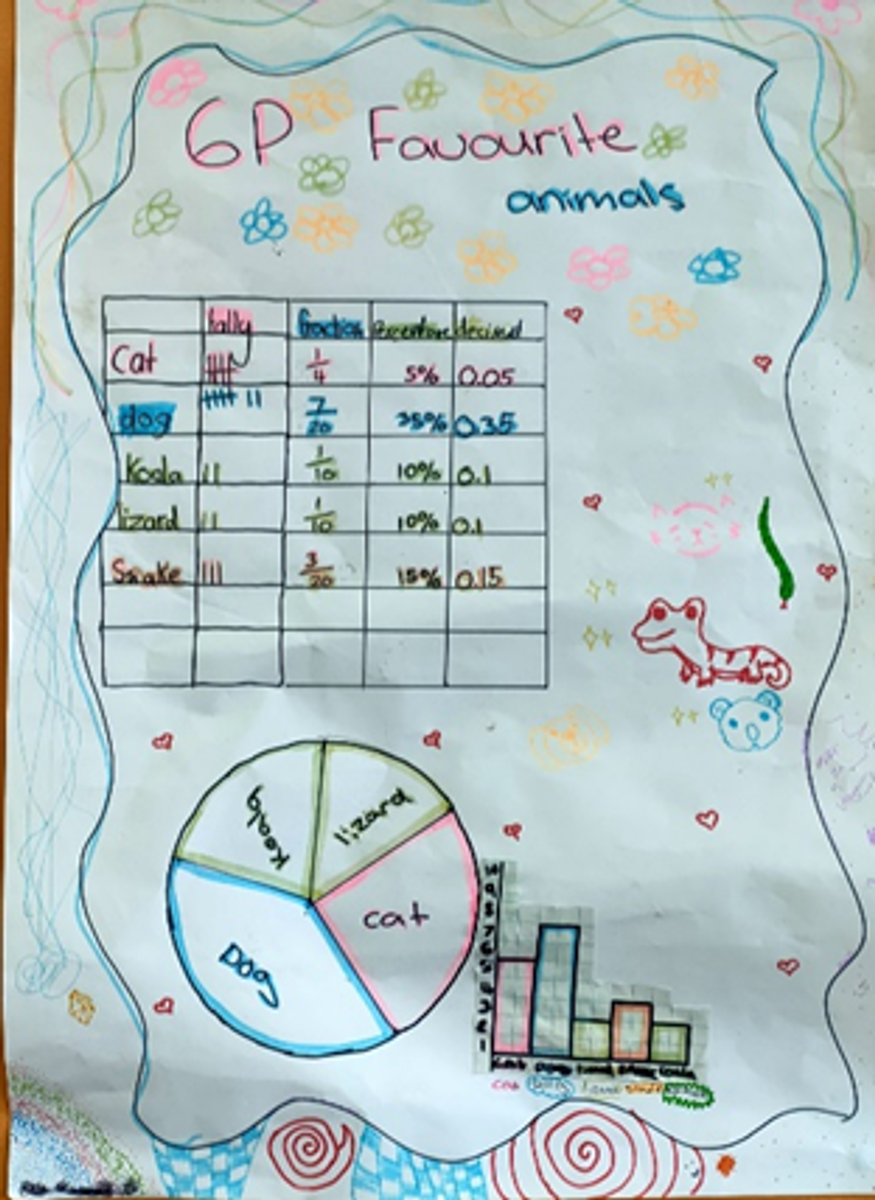
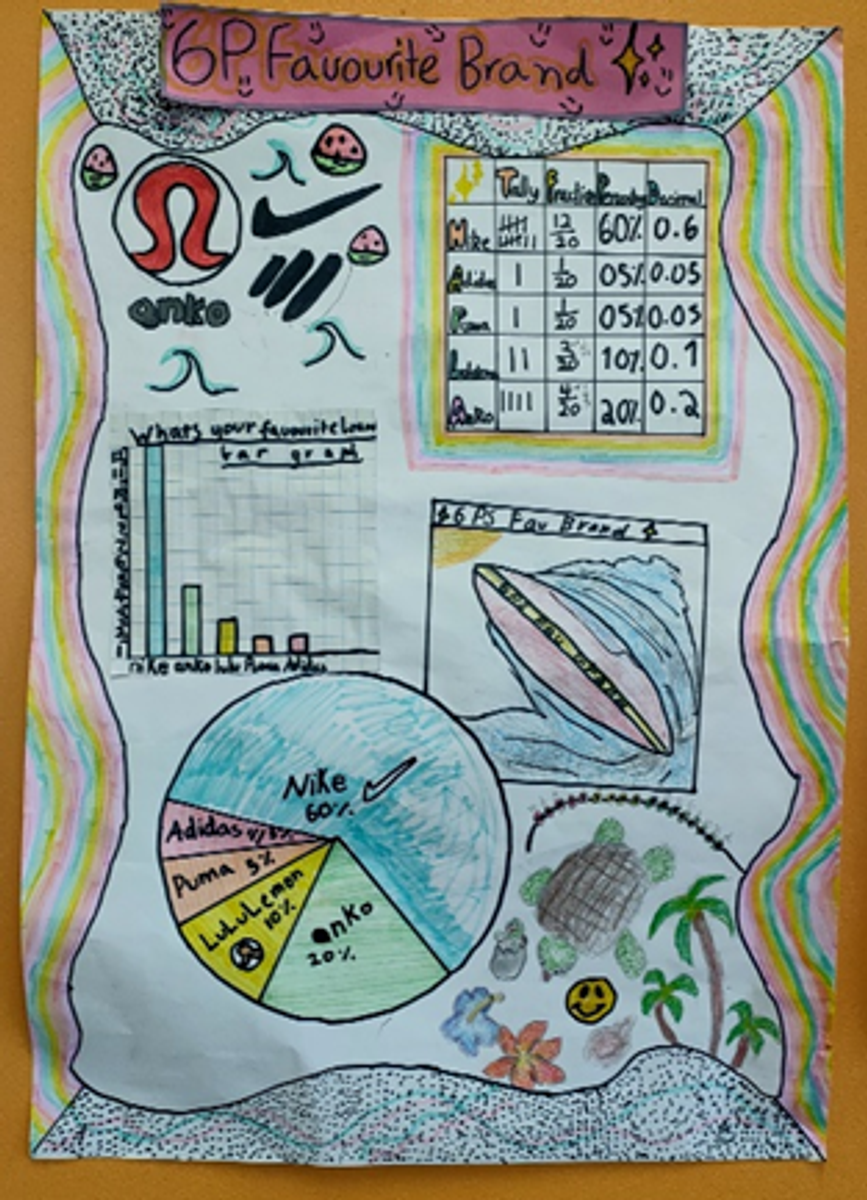
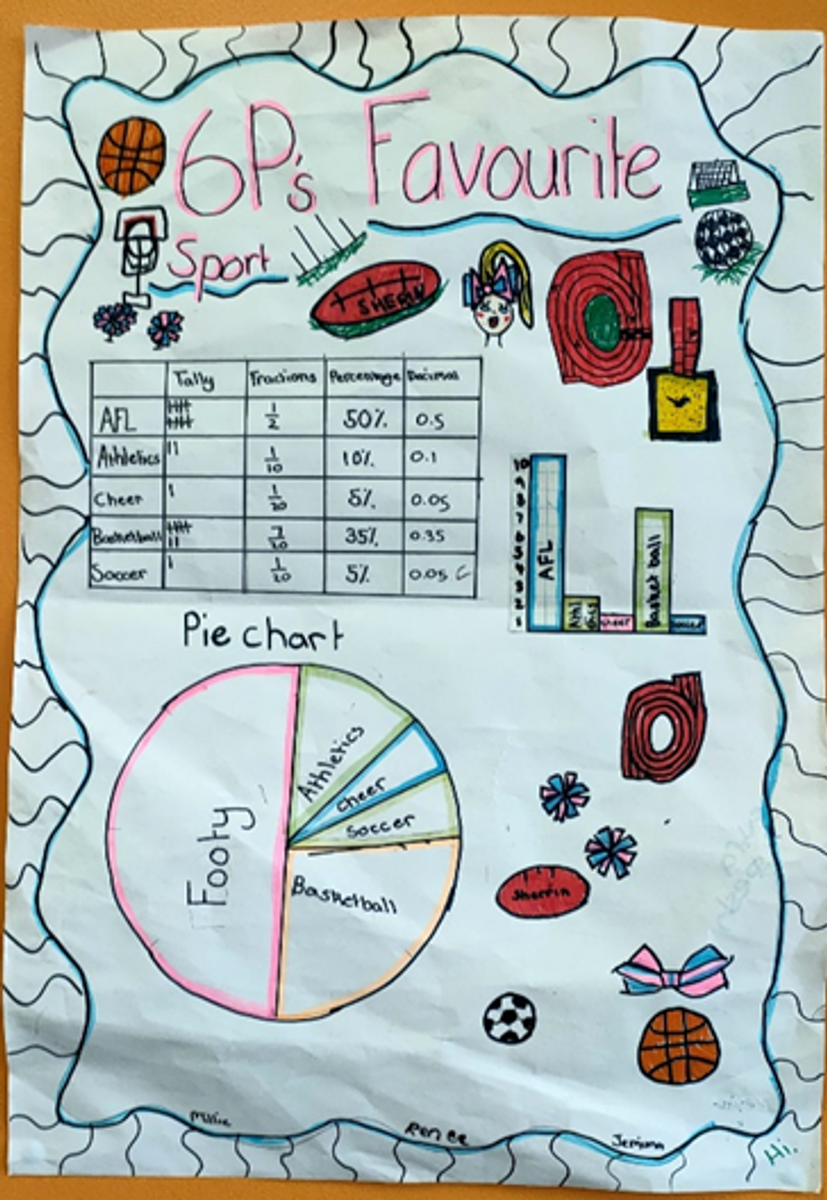
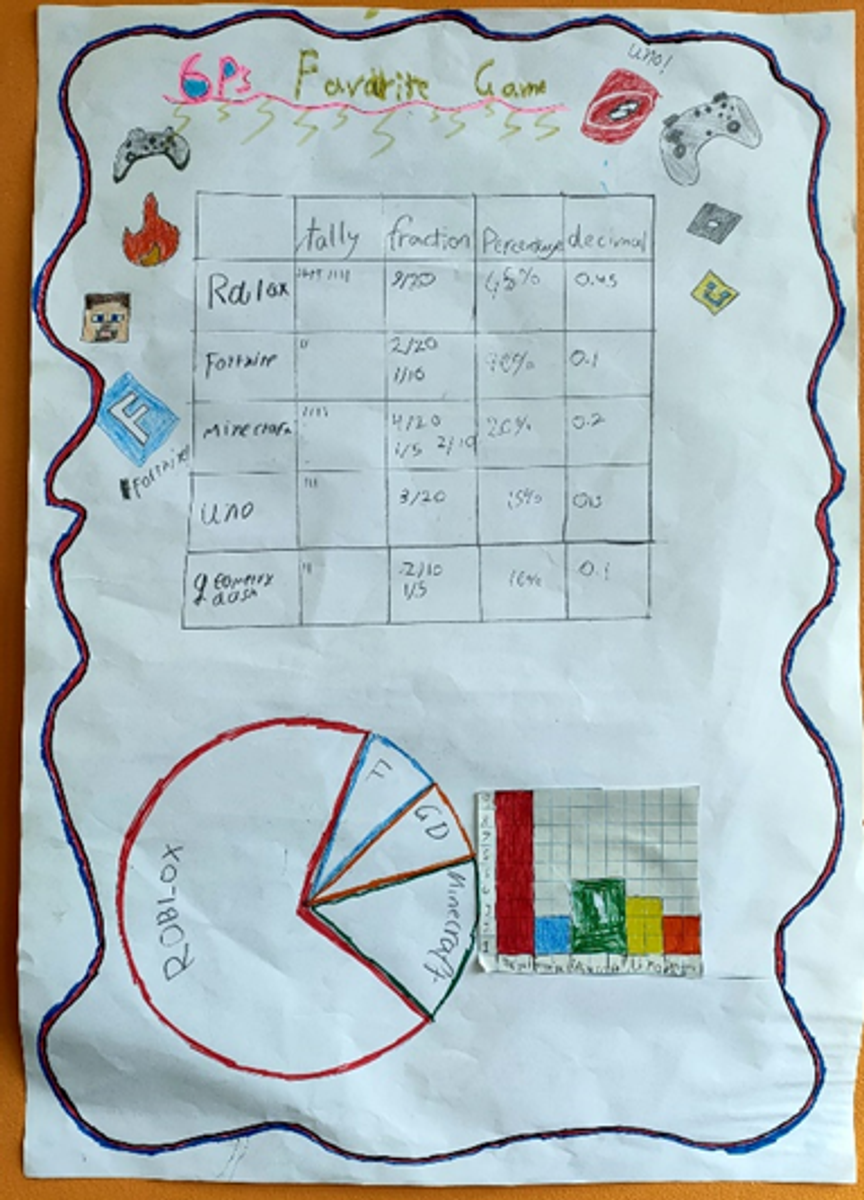
During Term 4, 6P have been working on a Mathematics unit on statistics and data. They have been learning to create, read and analyse data from graphs. In groups, the students came up with a topic and surveyed the class to create a simply tally chart. The pairs then created a table and learnt how to change their survey results into percentages, fractions and decimals.
They then used their information to create a pie chart which showed a new way to display the information they had collected. The students then created large data displays which showed the results they had collected.
To finish the unit, the students analysed the data displays to work out which selections were the most popular and what would happen to the data if it was collected on a larger scale.