
MATHS

STATISTICS PROJECT
How long do you spend on your device over the weekend? If you could choose to remove one thing from earth (poverty, sadness, sport, global warming) what would it be? How many hours do you sleep per night? If you could ride a unicorn to the moon, what colour would it be?
These are just a few examples of the hard-hitting questions our Year 7s aimed to collect data on in the past couple weeks in Maths. Creating questions, surveying their classmates, and collating the results, the students worked through all the key components used in statistics.
What was the mode in their data? The mean? The median? What about the range? Could they determine these things for numerical data or categorical data? Or perhaps for both?
See below for some interesting findings from our kids!
Willem Voorham
Maths Teacher
How long do you spend on your device over the weekend?
“In this question, I found that the mean was 5 hours, median was 3 hours, mode was 2 hours and the range was 15 hours. Something that was surprising was that there were people who spent as little as 1 hour on their device over the weekend, and as much as 16 hours for others. A question I ask is, how do you do your revision of work?” - Lina Chisango
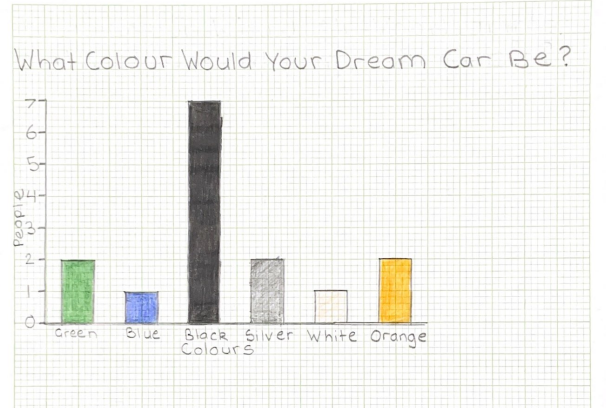
What colour would your dream car be?
“For this question, 7/15 people said that the colour of their dream car was black. Calculating the mean, median and range wasn’t possible because it was categorical data. I was surprised by this because I would have chosen red, which nobody wanted!“ - Sara Kumar
How many different countries have you been to?
“For this question, I surveyed people about the number of different countries they have been to. I found that the mean was 4.26 countries, the median was 4 countries, the mode was 5 countries and the range was 10. This data didn’t really surprise me, though the range of 10 countries was interesting!” - Aryan Rokhade
"What I most enjoyed was going around and finding all the data. I knew most of the terminology except for histogram, which I thought was something completely different. The most useful thing was using different types of graphs for data." - Masum Patel