Digital Technologies
STEM MAD
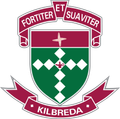
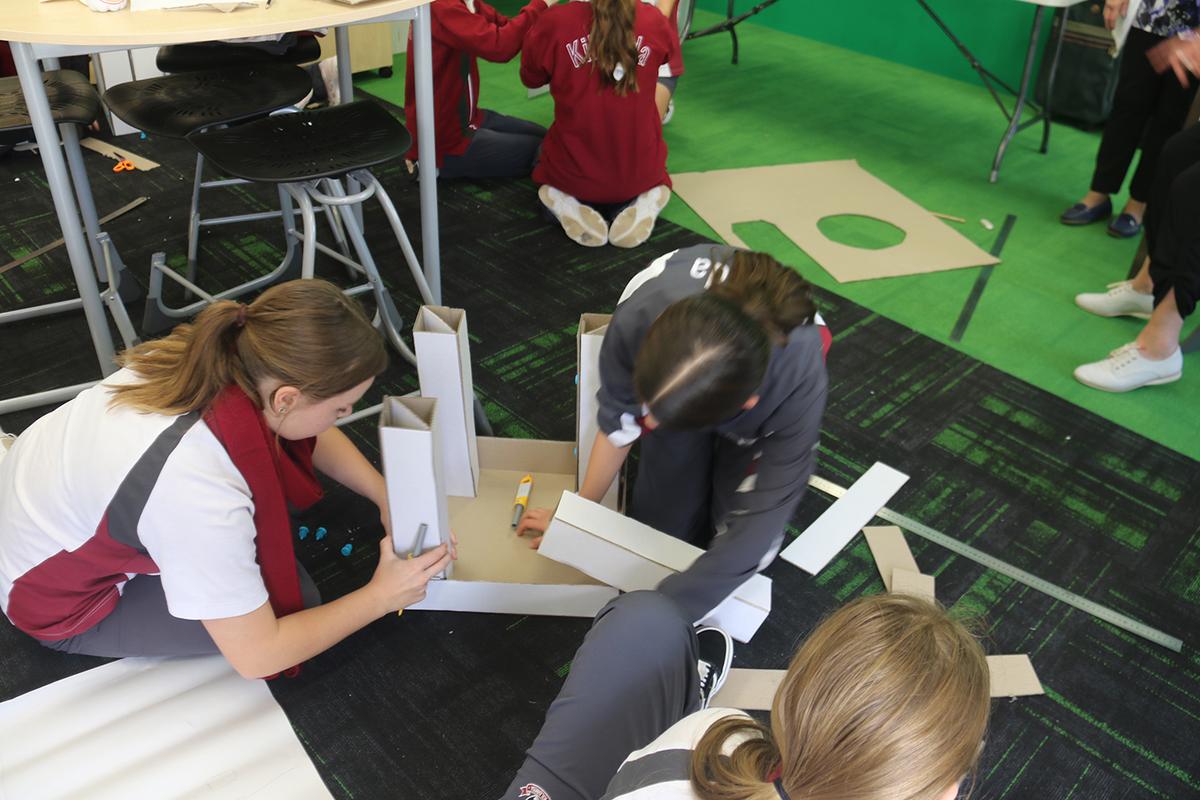
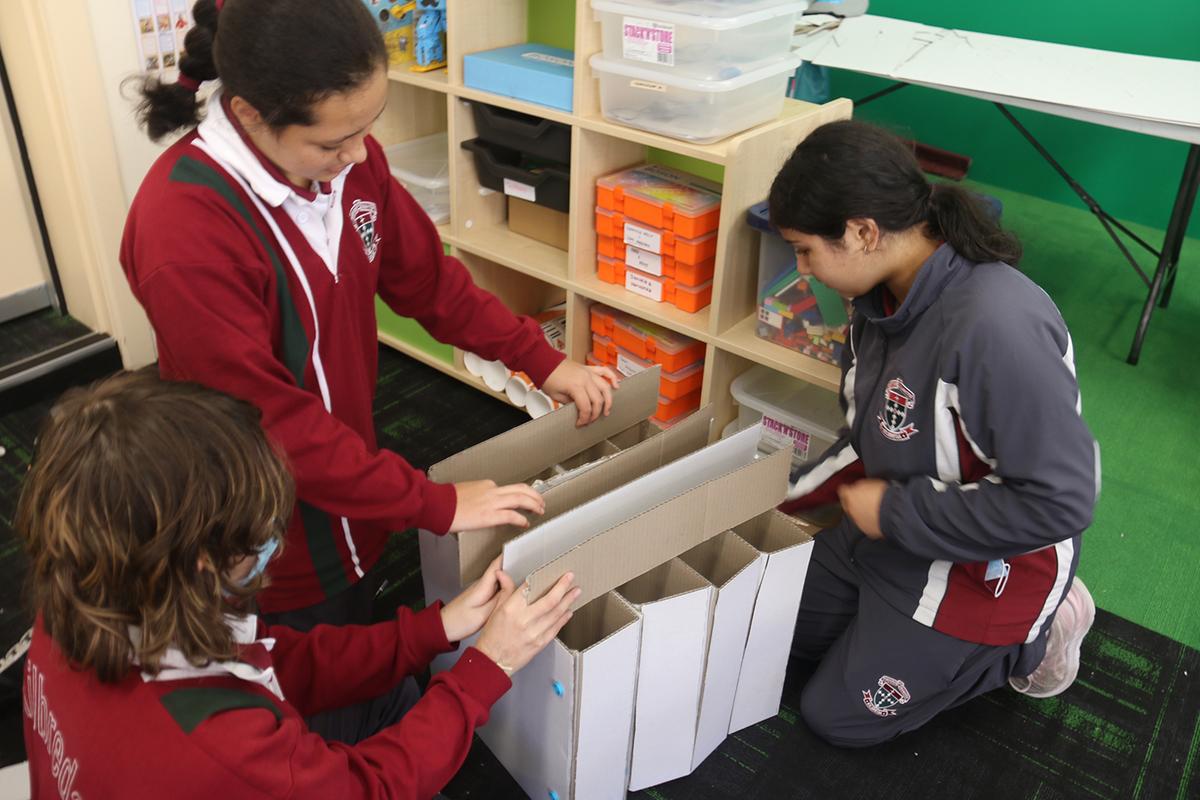
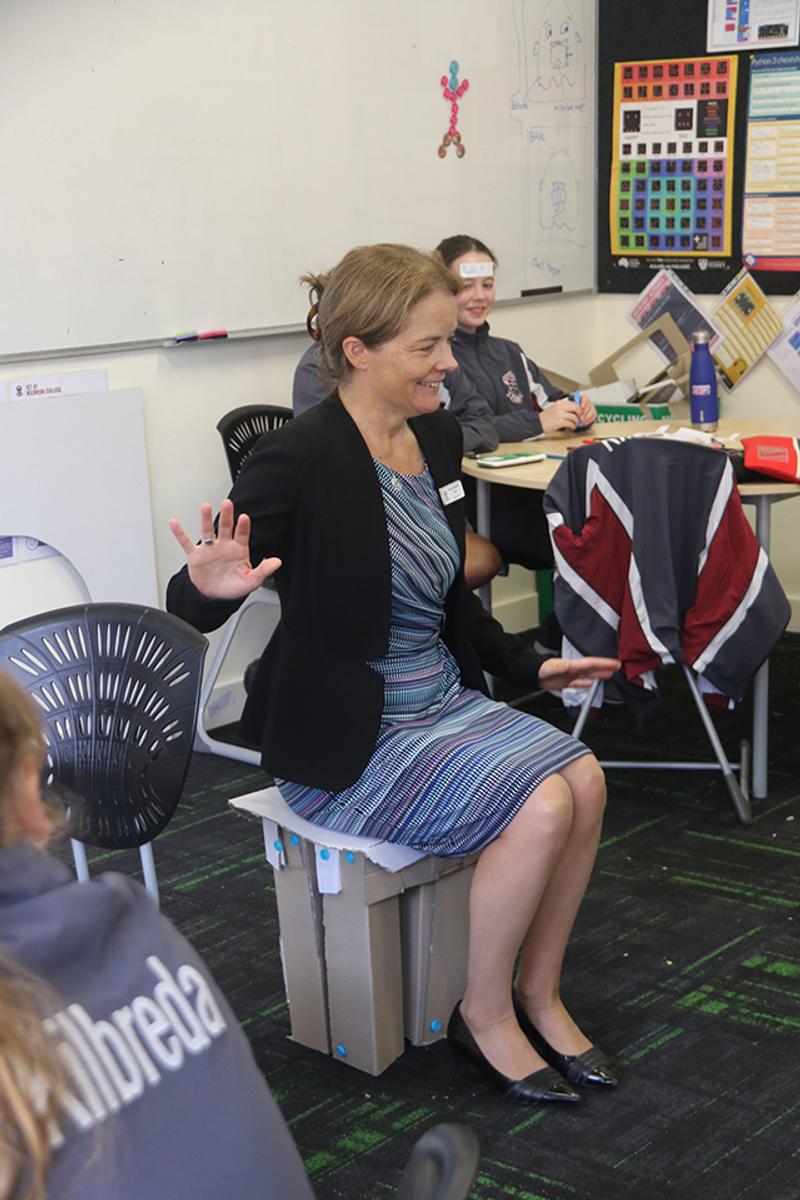
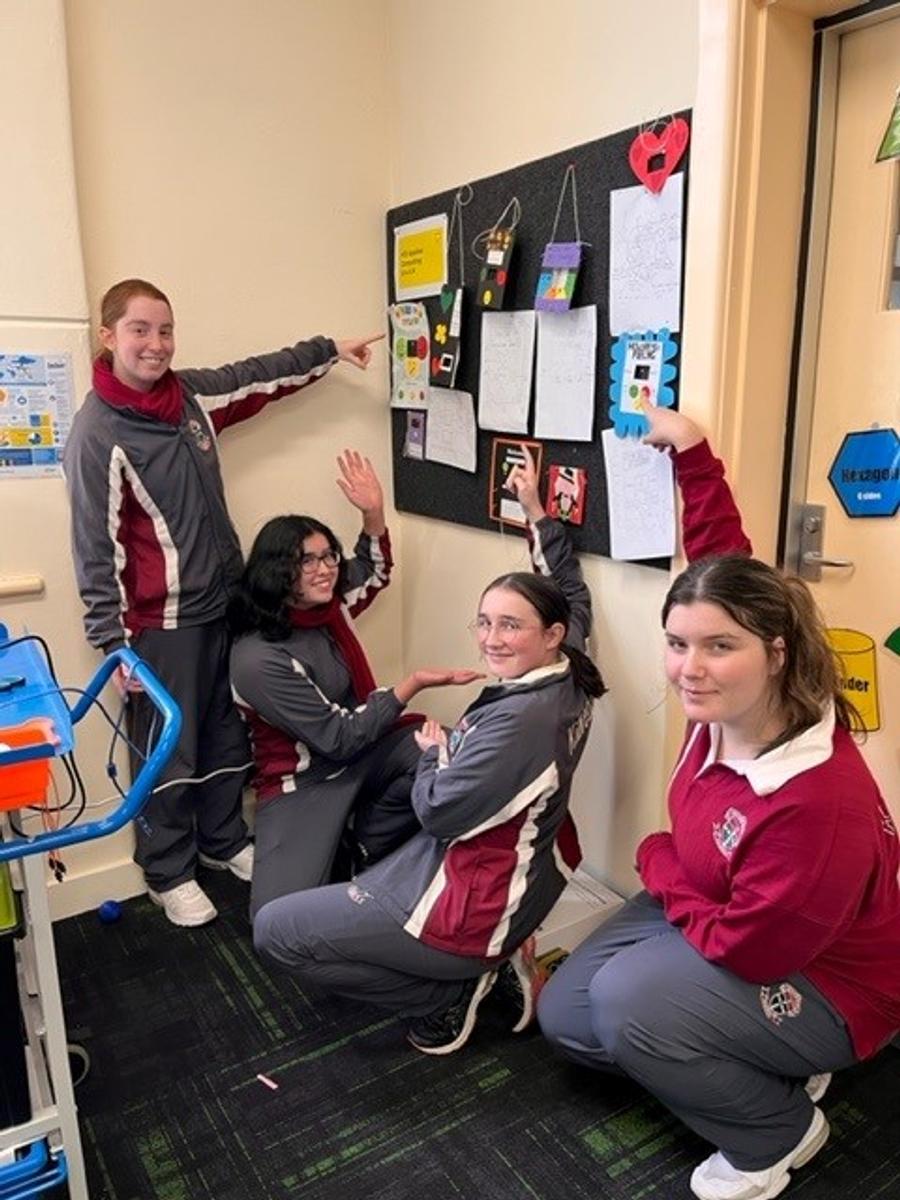
On 3 May, the STEM Room was alive with activity with the launch of our STEM MAD (Make a Difference) program. 20 students from Years 7 and 8 were invited to be involved to use their STEM skills to make a difference to the lives of others.
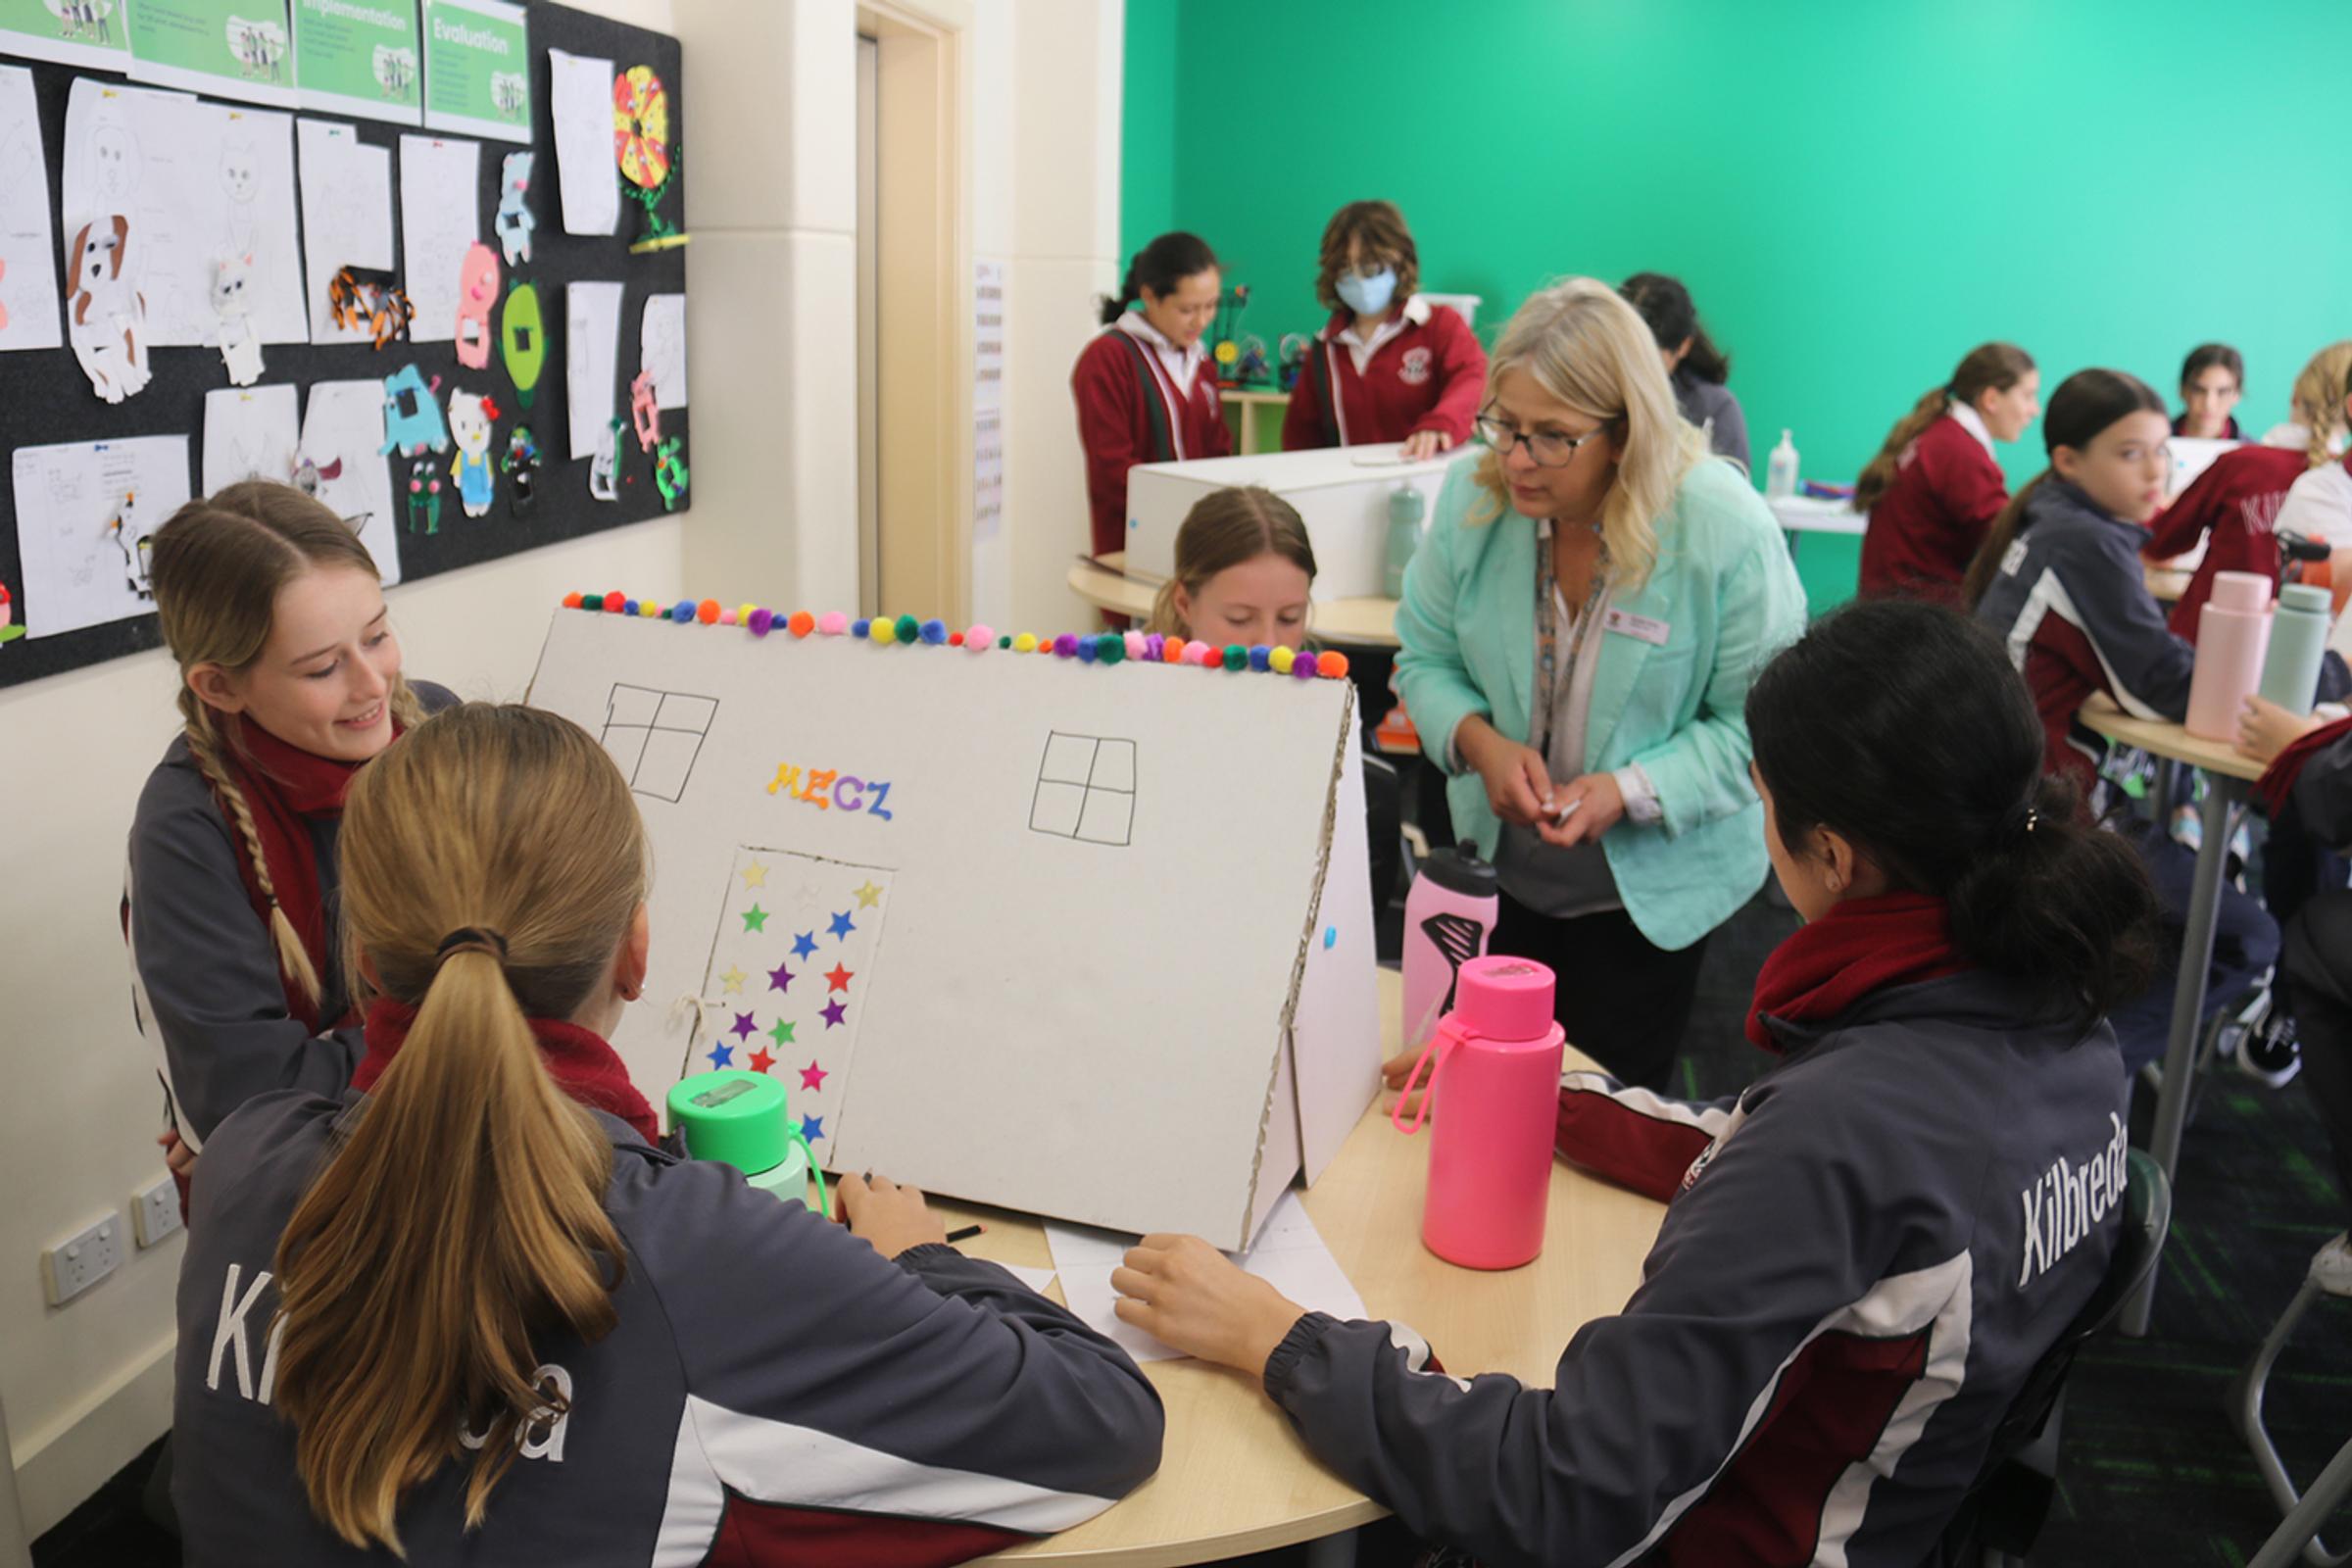
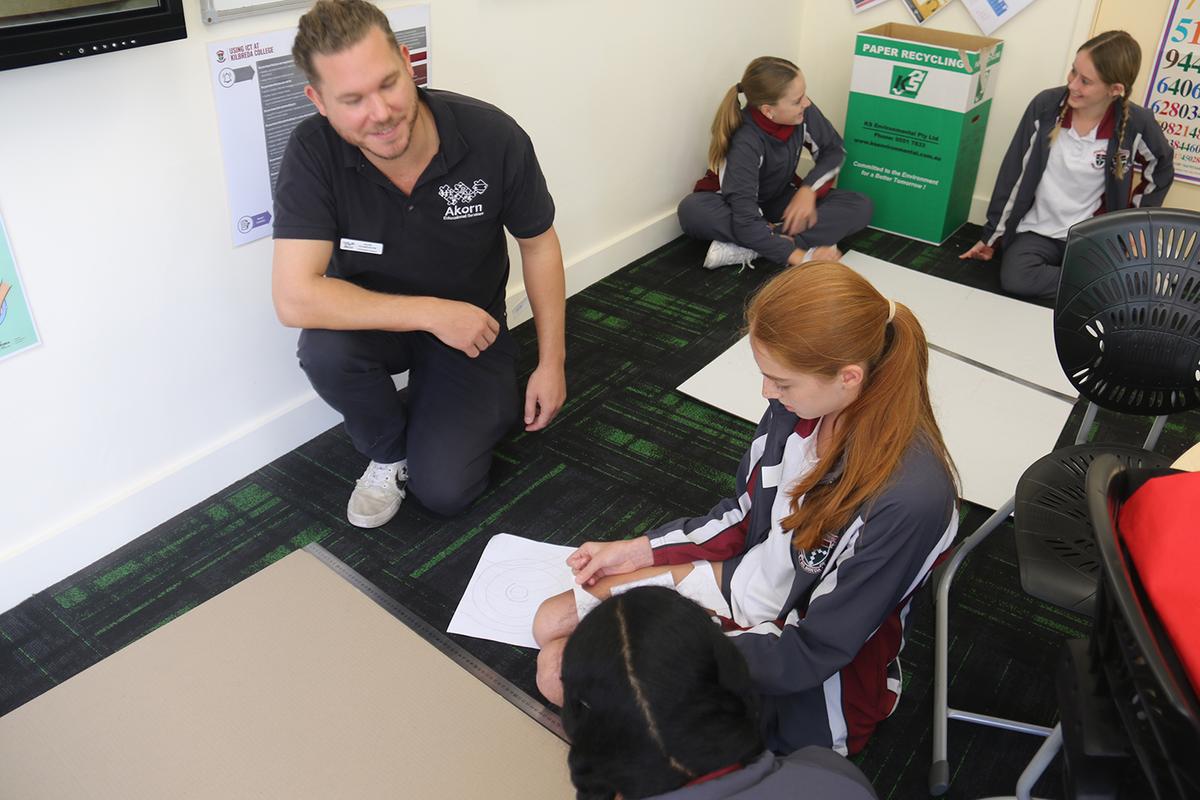
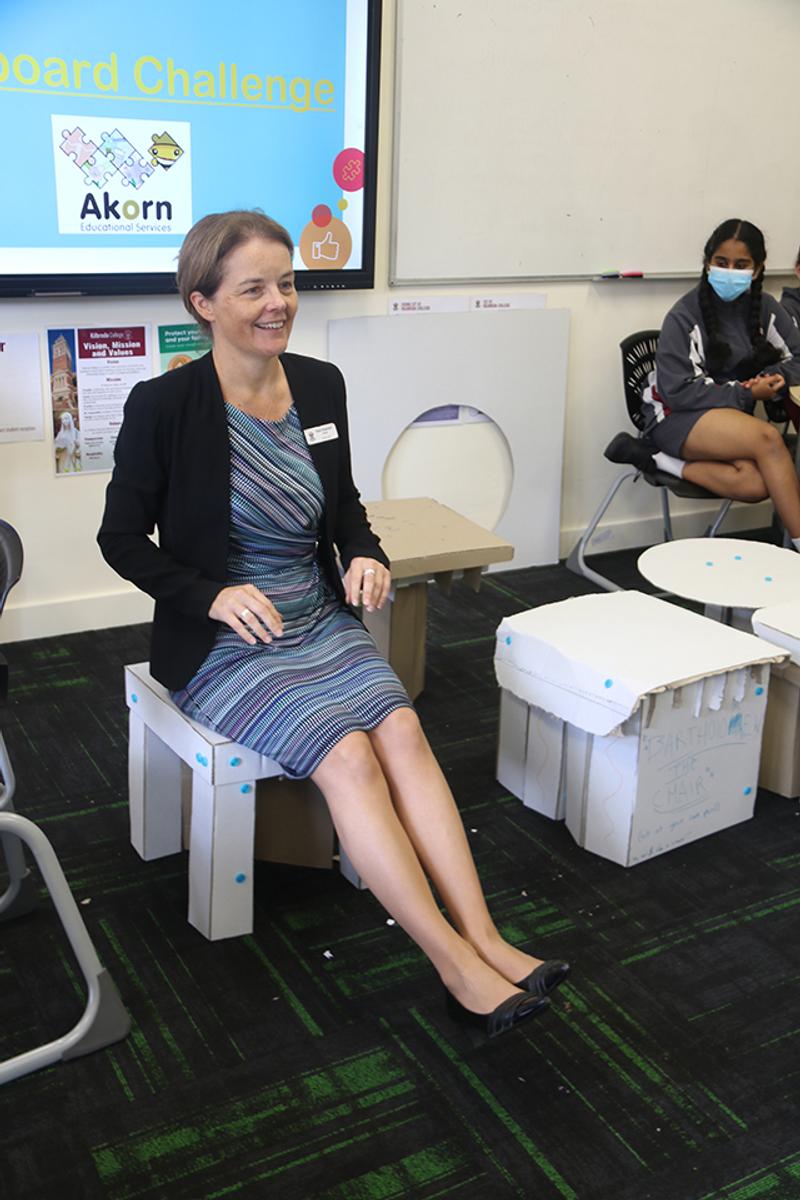
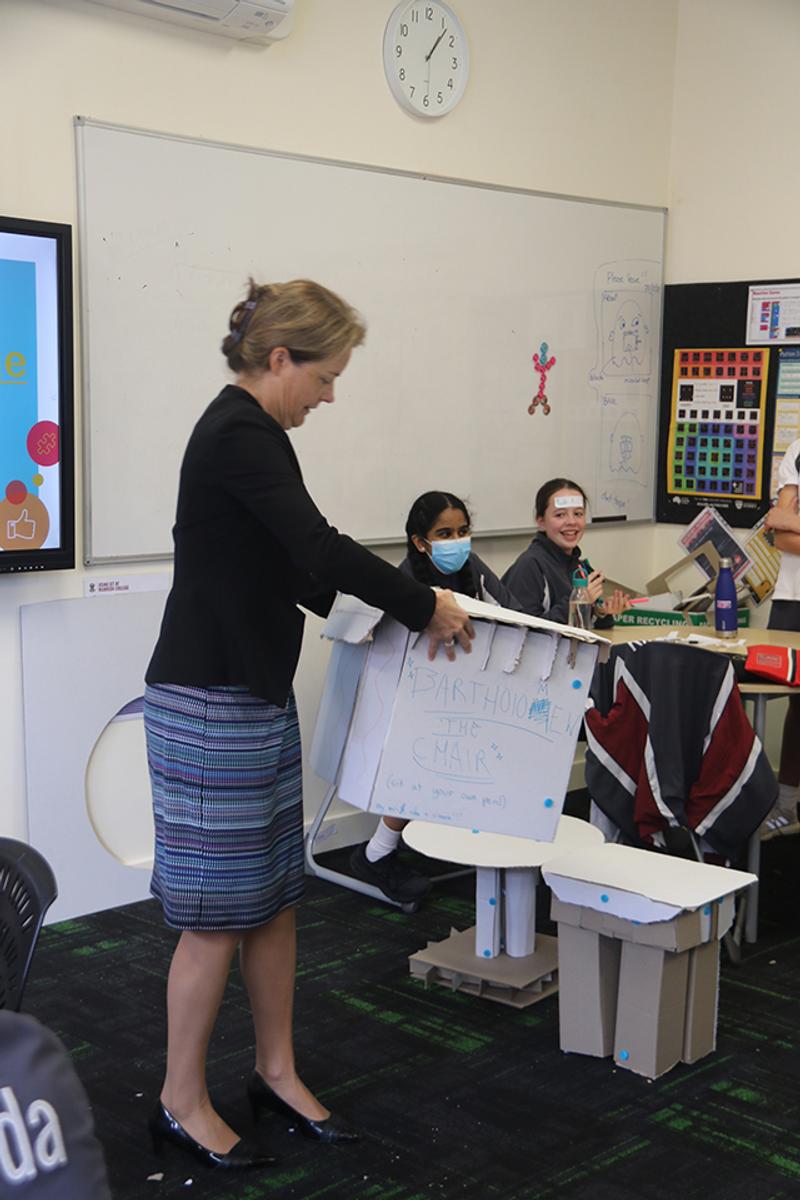
A group from AKORN came to the College and ran a series of cardboard challenge workshops. Students worked in groups to engineer temporary shelters and chairs out of cardboard that could be flat packed and sent to people in emergency situations. One of the highlights of the day was getting Ms Mangelsdorf to test the durability of the chairs and we are relieved to say that no principals were harmed in the process!


Now the challenge is for our STEM MAD group to decide and develop their own STEM MAD projects. Since the cardboard challenge day, we’ve had two follow up sessions with the girls and they have really thrown themselves into these projects. We have all kinds of interesting ideas being developed such as language assistance apps, modified uniforms to help students who need to inject insulin, assistive technology, portable ramps and even wearable technology that sends messages for help.
We are hoping to enter the groups’ projects in the Victorian STEM MAD competition early next term. We wish them well with their innovations!
Year 7 - Infographics
More recently, our Year 7 students have been learning all about data visualisation and the art of the infographic. They collected and collated data, based on topics such as their school camp activities and class interests and then manipulated the data to create graphs during maths. During their DTE lessons, they have taken the results and created beautiful infographics. With data analytics becoming a highly sought-after skill in the workplace, we have no doubt these students have acquired very useful abilities!
Here are some student examples:
Emma Greaney's Infographic
https://create.piktochart.com/output/58804146-my-visual
Sophia Murphy's Infographic https://create.piktochart.com/output/58804160-my-visual
Student Reflection
In DTE we started using Piktochart to make Infographics. First, I made my plan on paper. I showed Mr Smith and once we had tweaked it a bit, I started putting it together. It contains information from a spreadsheet we used in Mathematics about what Year 7 students at Kilbreda like. I made a few changes to colours, pictures and a few things and luckily each time you do, Piktochart updates your final product. So that's how I made my infographic on Piktochart. https://create.piktochart.com/output/58869753-my-visual
Niamh Wilson
Year 7
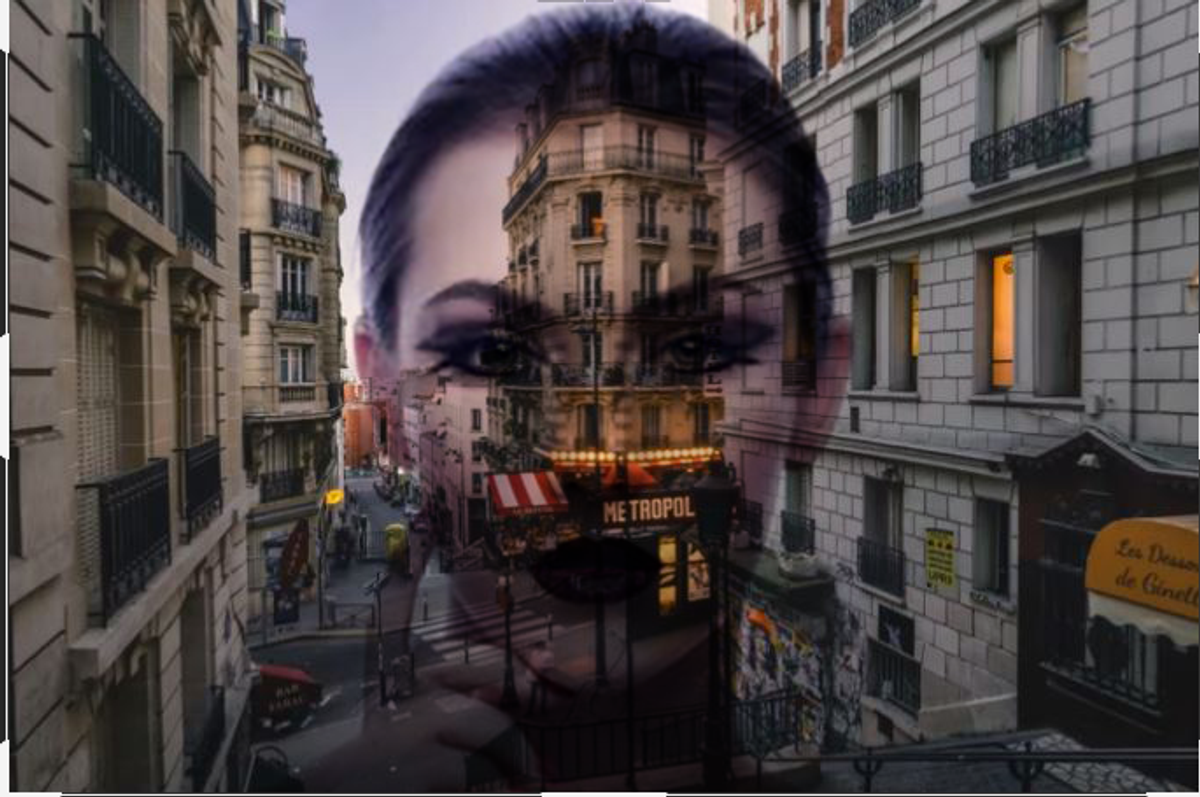
Year 7 - Photoshop
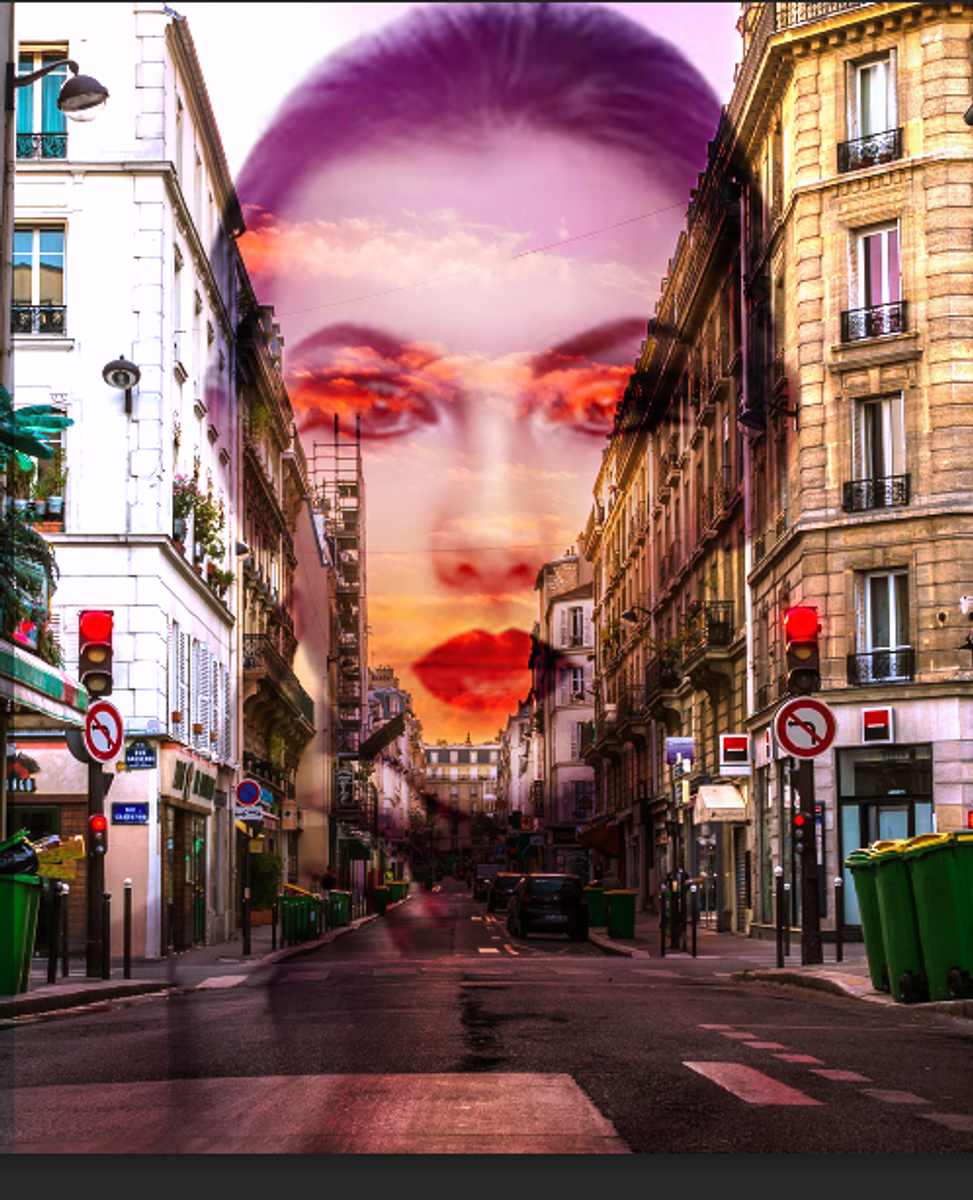
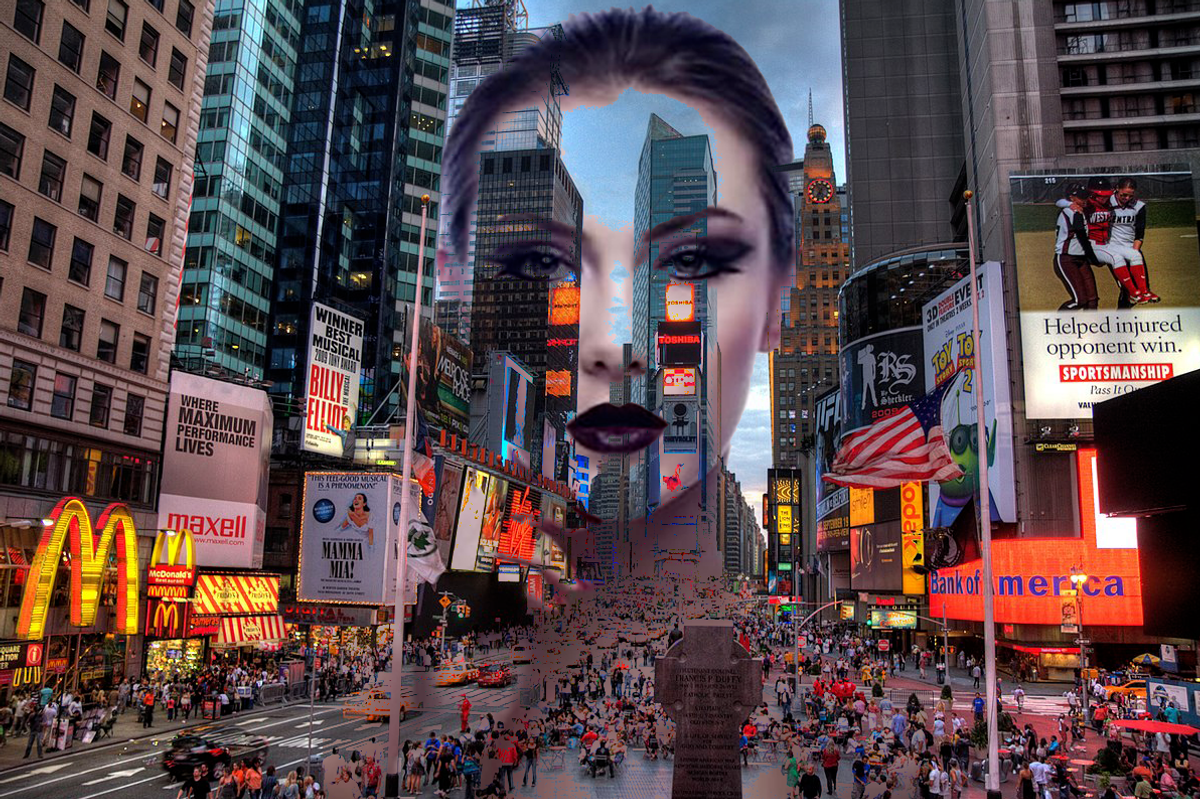
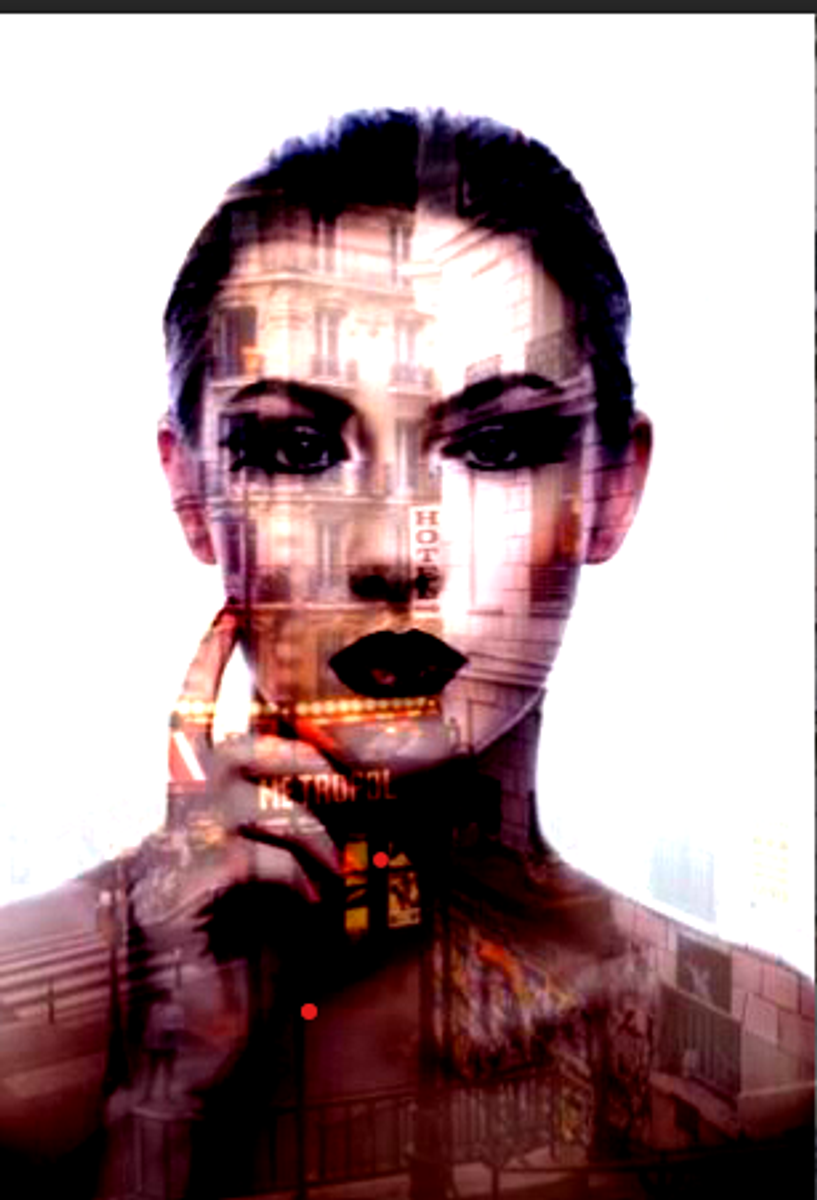
Year 7 students have built on their Adobe Photoshop skills, learning to combine images in a creative way as you can see through these lovely examples by Rosana Smyth, Alice Davies and Niamh Wilson.

Year 8
It’s that time of year when Year 8 students have completed their video game designs and we get to share some of the best examples with you so you can play them!
This year, students created a range of games from 'flappy bird' variations to maze and 'Whack-a-mole' style games. We were very impressed with the level of creativity this year, in both the drawing of the sprites (the game characters) and the programming itself.
Click on the links below to play some of our favourites - don’t forget to press the heart on the Scratch website if you like the game too!
Kassedy Mazur
https://scratch.mit.edu/projects/645105331
Charlotte Quigley
https://scratch.mit.edu/projects/685335908/ and
https://scratch.mit.edu/projects/649627277/
Eloise Holborn
https://scratch.mit.edu/projects/683588606/ https://scratch.mit.edu/projects/645816657/
Belinda Gledhill
https://scratch.mit.edu/projects/683589350/
Elizabeth Jones
https://scratch.mit.edu/projects/645815302/
Felicity Johnston
https://scratch.mit.edu/projects/680598780/
Matilda Owen
https://scratch.mit.edu/projects/683588578/
Isha Gurung
https://scratch.mit.edu/projects/661737081/
VCE Applied Computing:
Unit 1
Year 11 students have been working hard at improving their programming skills using the language, Python. They have been learning all about events, functions, variables, lists, if statements and lots more! They have also been designing UI (User Interface) and UX (User Experience) for their applications.
Here’s what three of our Year 11 students, Jade, Georgia and Bridget had to say about their programming experience.
What is your favourite thing about programming?
- Doing the Grok modules because it’s fun to create and code different programs.
- Working as a team with my class to find solutions to coding issues.
- The logical thinking needed to be able to trial different solutions.
The hardest thing about programming for us was?
- Troubleshooting - specifically when logical errors occur, when a wrong strategy is used. For me, I must replace ‘else’ statements with the ‘elif’ statements for my programs to make decisions.
- When you reach an error in the code but just can't figure out what went wrong.
- Learning the language - Python is like learning a new language.
What have you been working on this term?
- In Outcome 2 (Programming), we have done Python, a popular coding language and coding on the Micro:bit, a small microcontroller which teaches people of all ages how to code.
- Working on our coding skills. Troubleshooting is a very important skill to have when programming and it is a skill that we have developed while doing Year 11 Applied Computing.
- Getting hands-on with the Micro:bits and engineering designs to house them.
What are your tips for younger programmers?
- Remember that other programmers are there to help and are happy to share their code!
- If you enjoy computer programming, don't give up. There are many problems along the way but there are always solutions.
- When things go wrong keep trying and use different solutions until it works.
Adrienne Donaghue
Learning Leader:
Digital Technologies