
Team Foundation News
Week 8 - Making our own graphs for our rainbow snakes
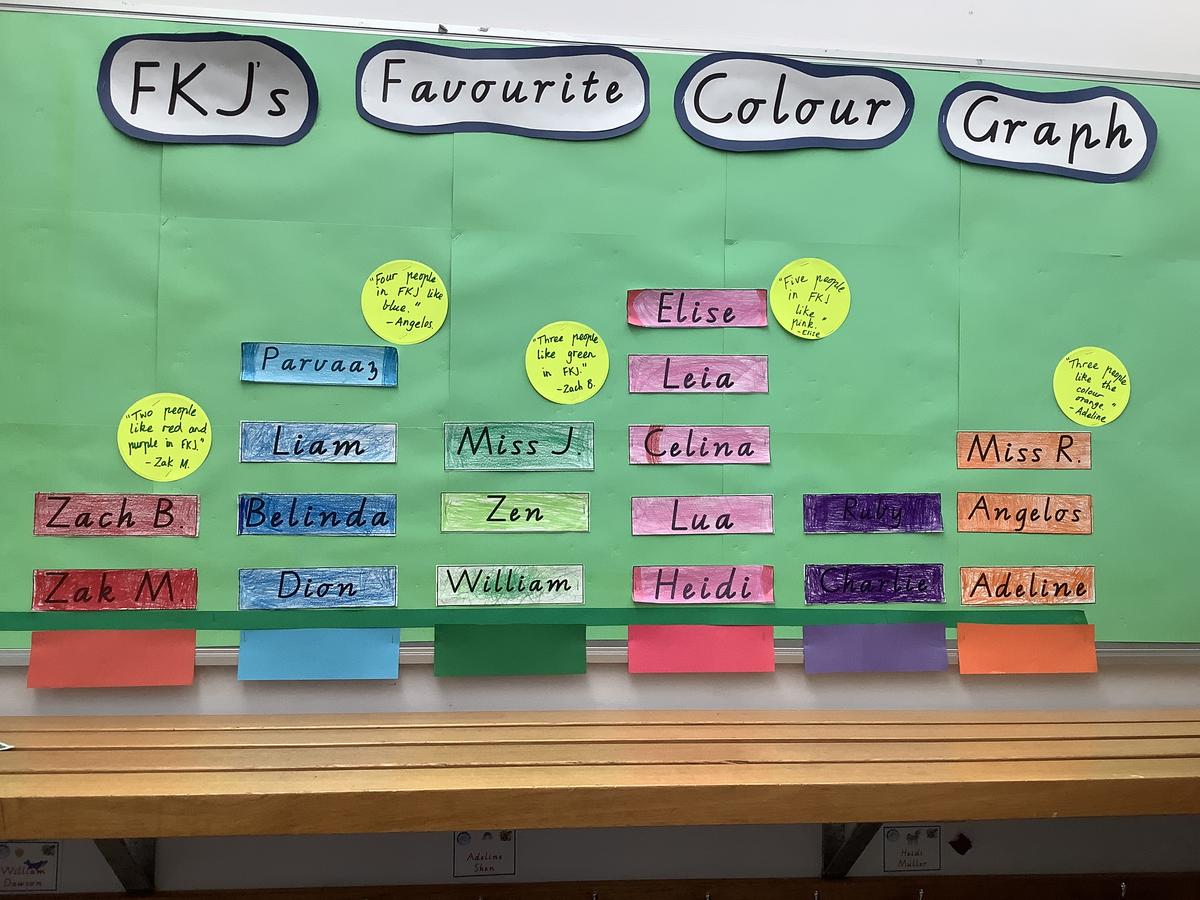
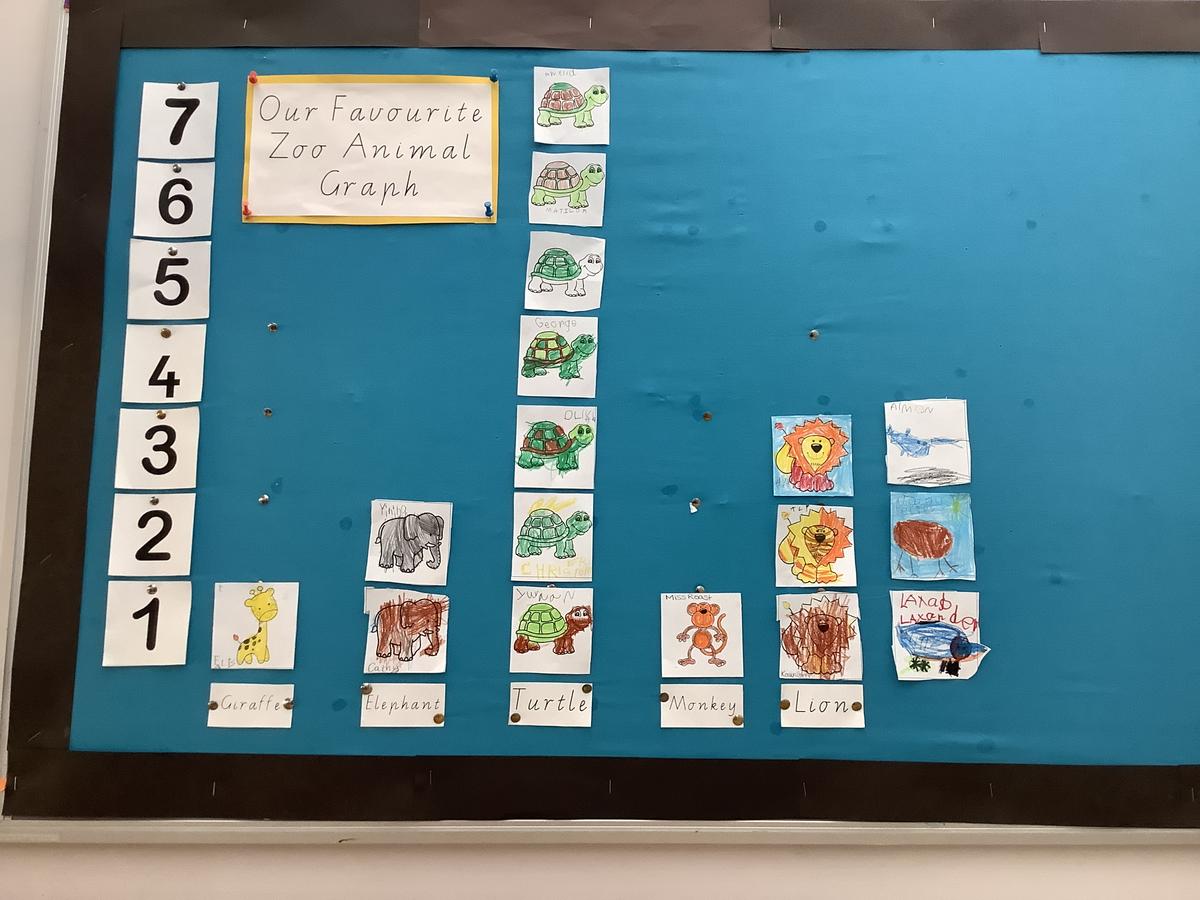
Over the last couple of weeks, Foundation students have been looking at graphs. The graphs have been displaying different information about the Foundation students. The first graph we made was about the students’ favourite animal. The second graph investigated the Foundation students' favourite colour. Making a graph allows students to research, collect and plot data onto a graph as well as analysing the collected information.
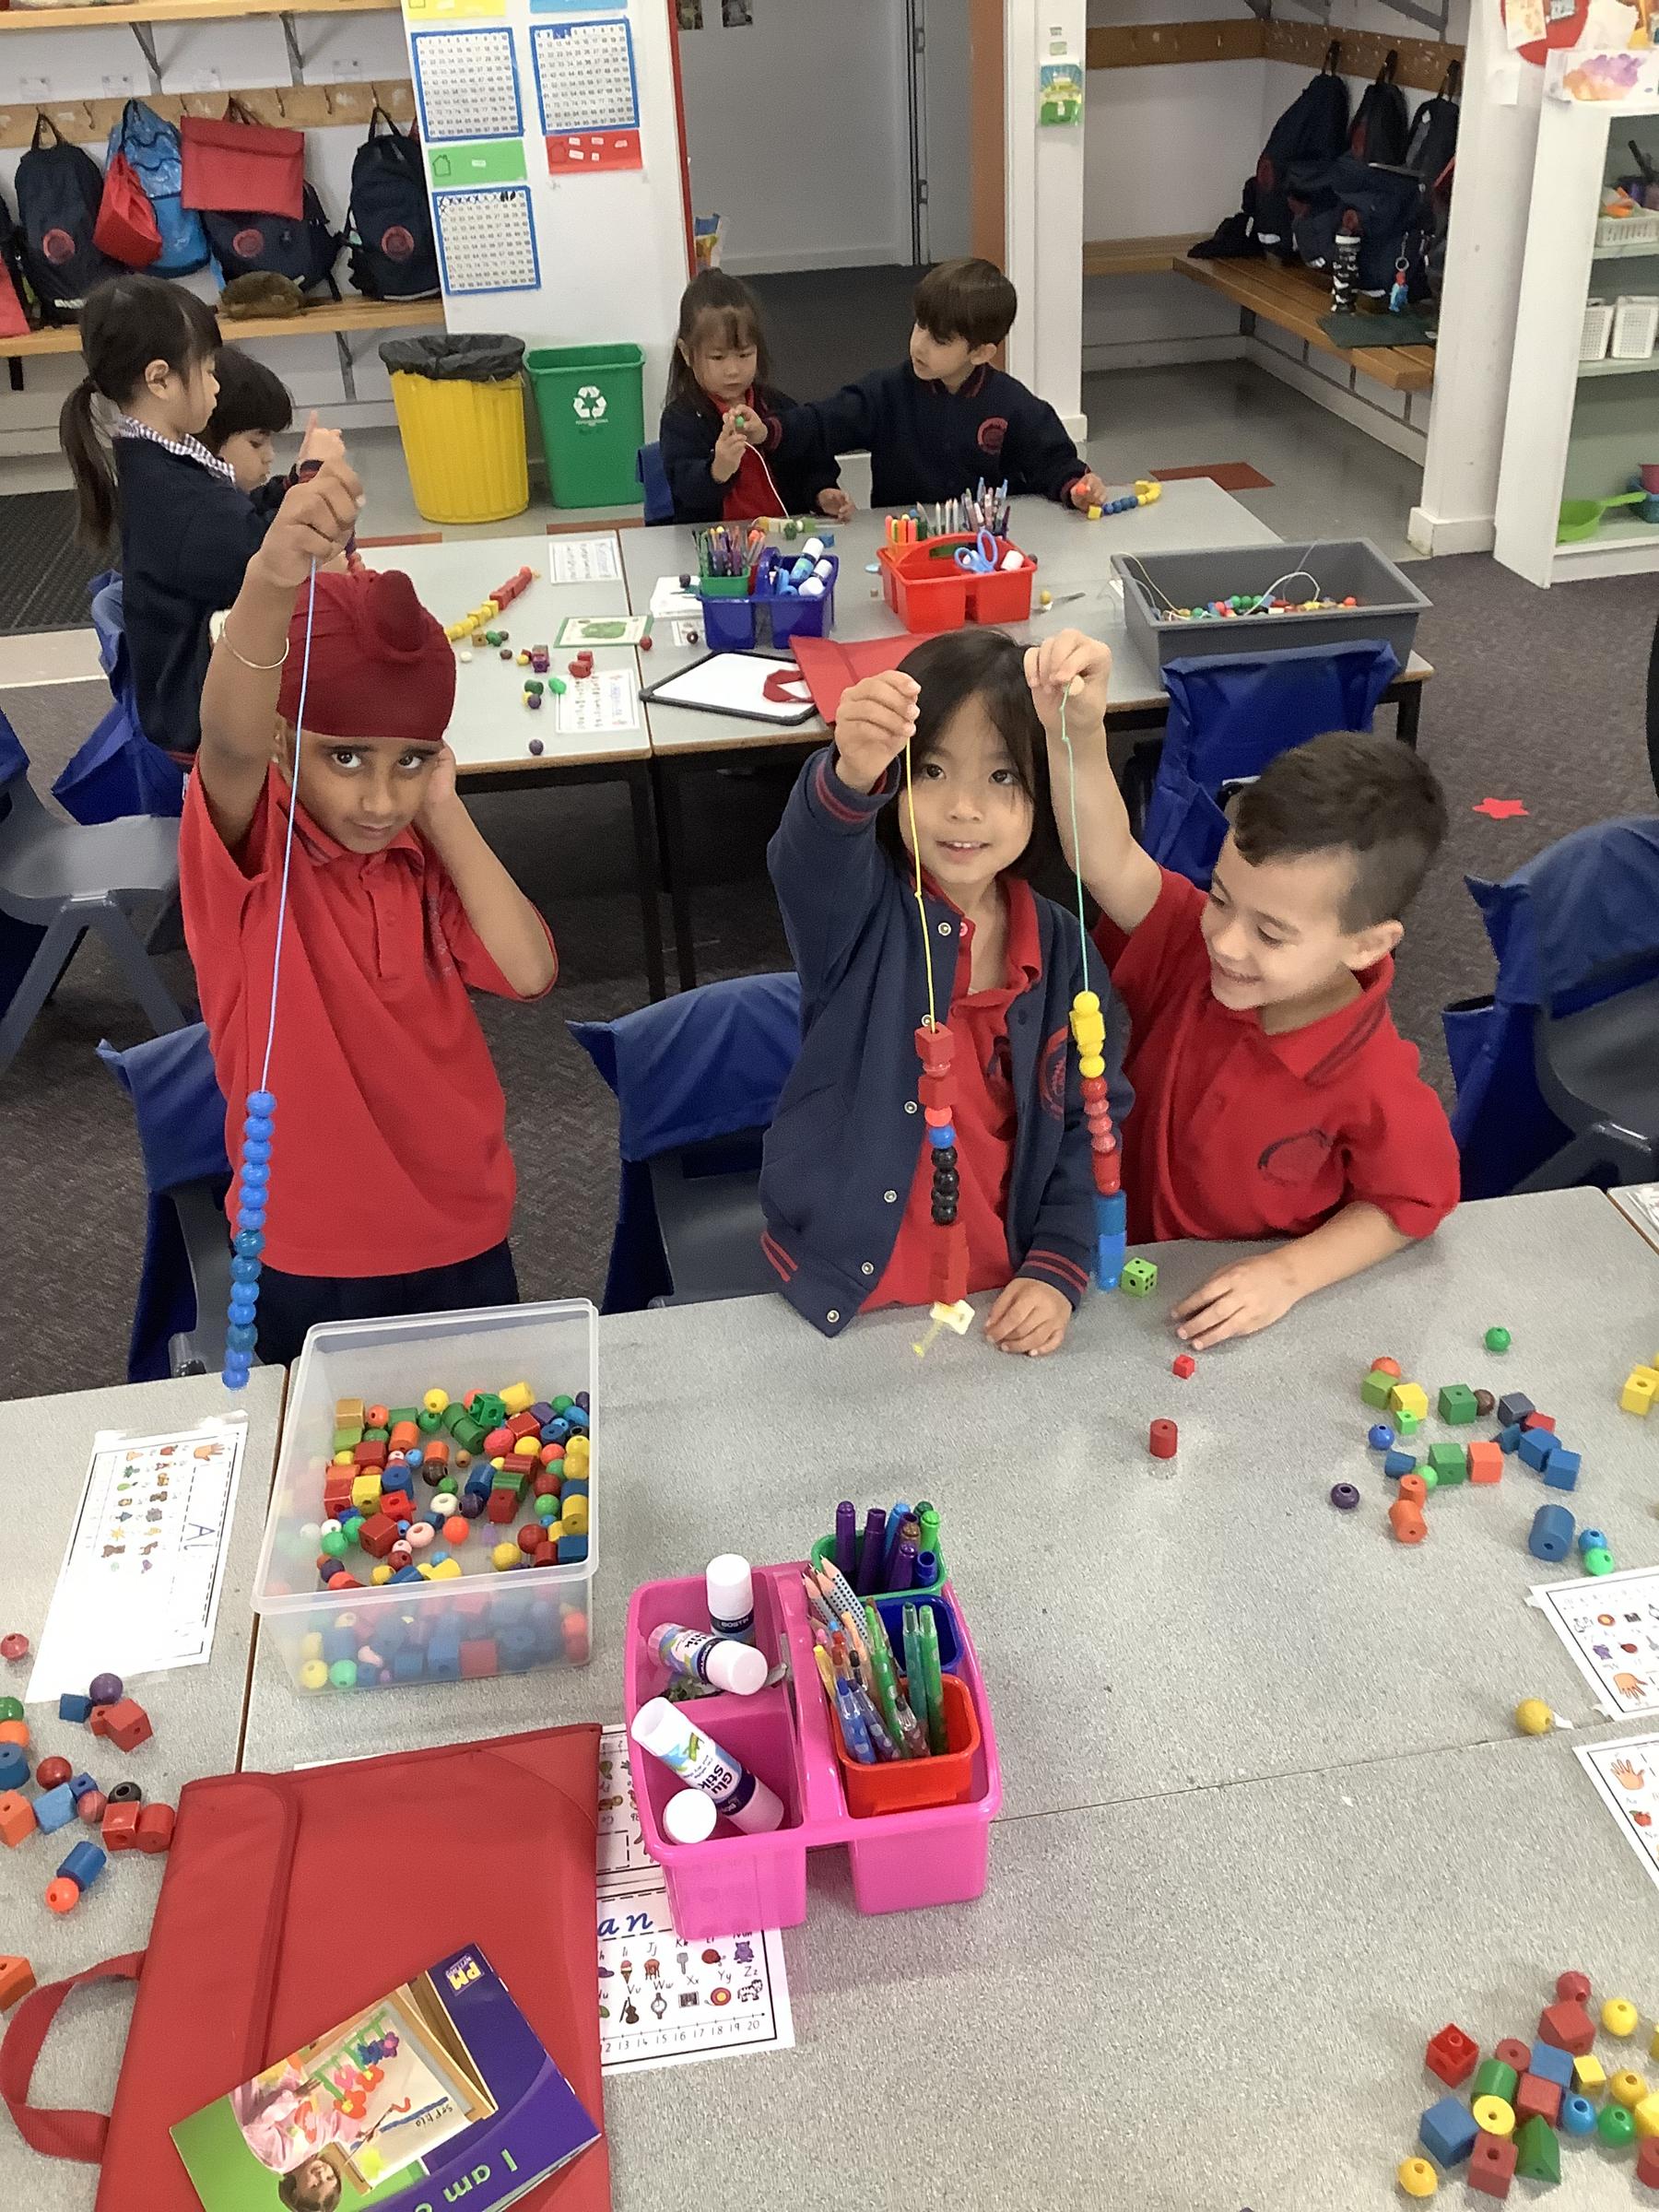
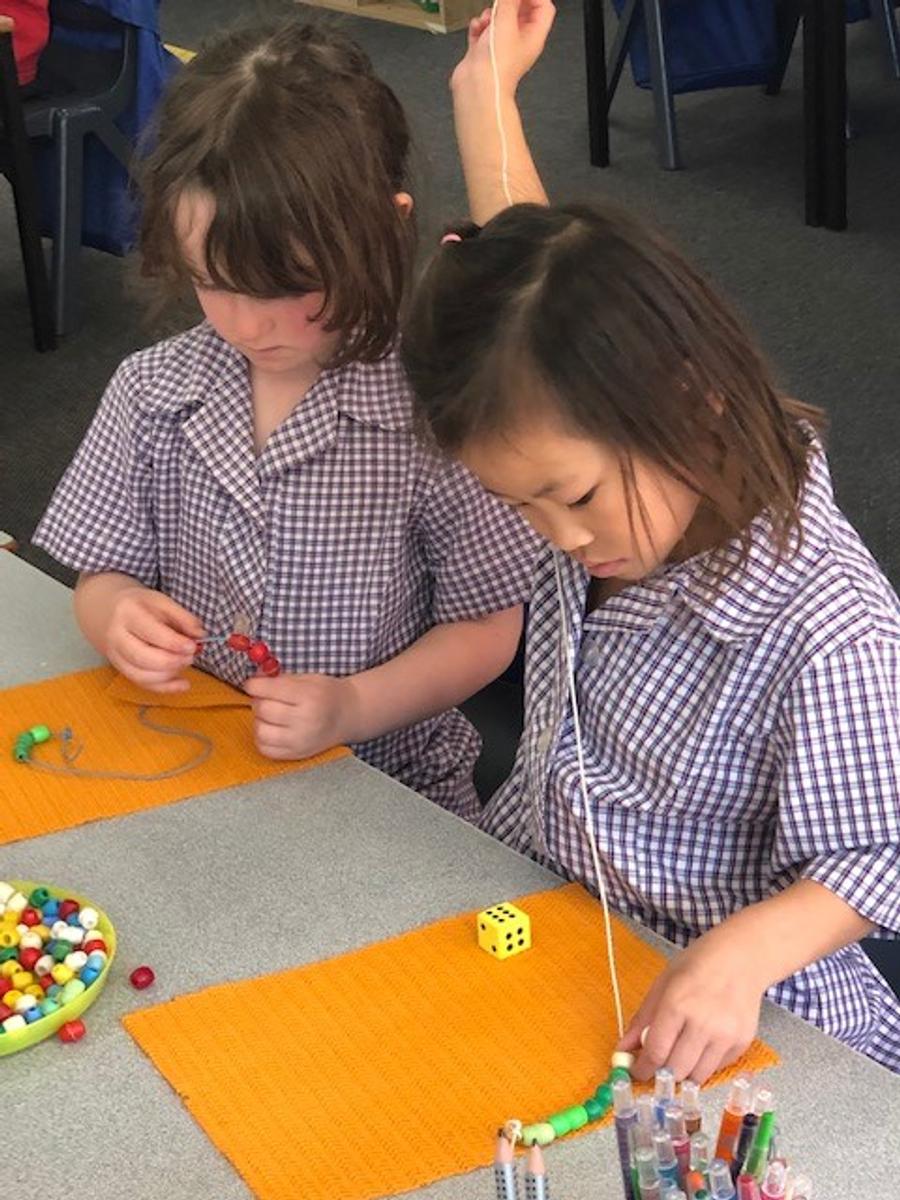
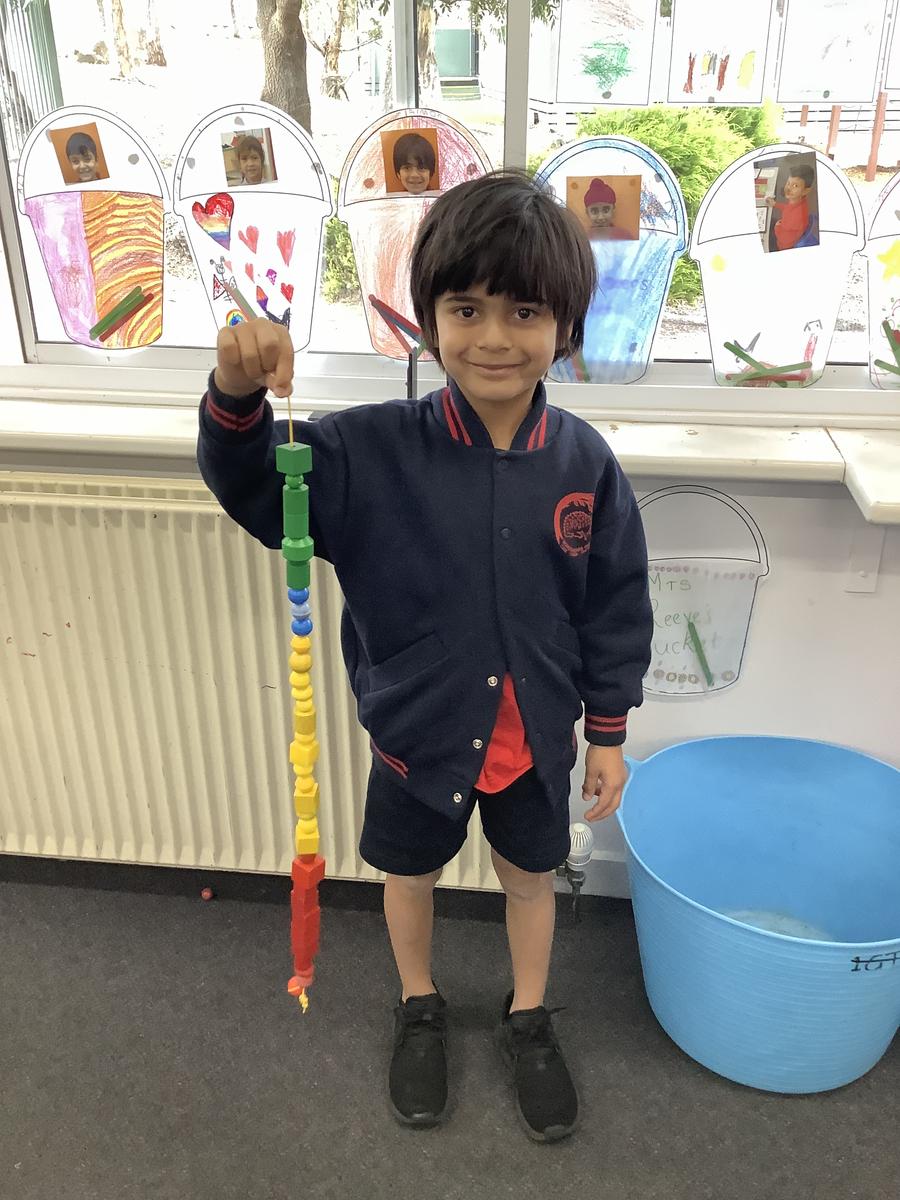
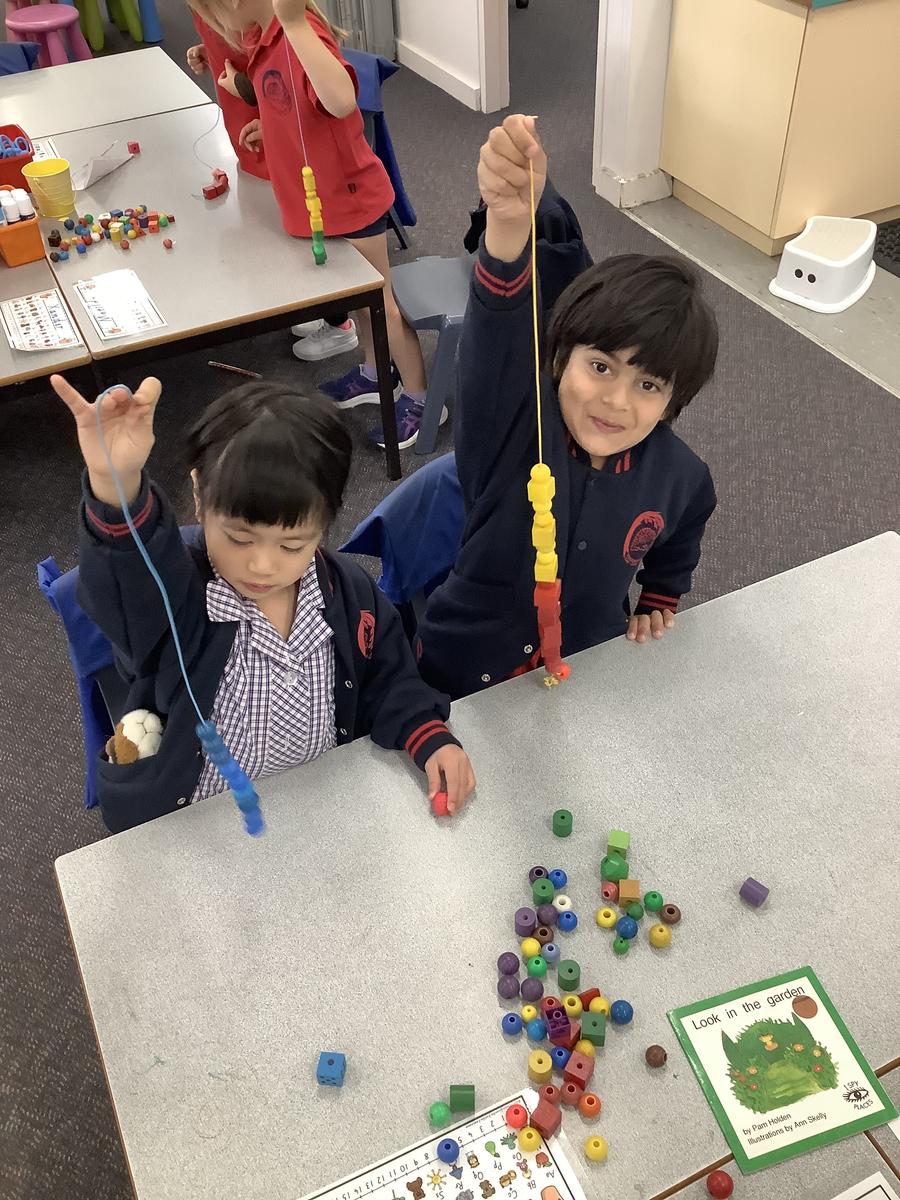
In week 7, students took part in an activity called Beaded Snakes. Students were to close their eyes and pull out a random coloured bead, they were then to roll a dice. Based on the number which the dice landed on, they collected that many beads of the coloured bead they picked. They then threaded the beads onto a string to make a colourful beaded snake.
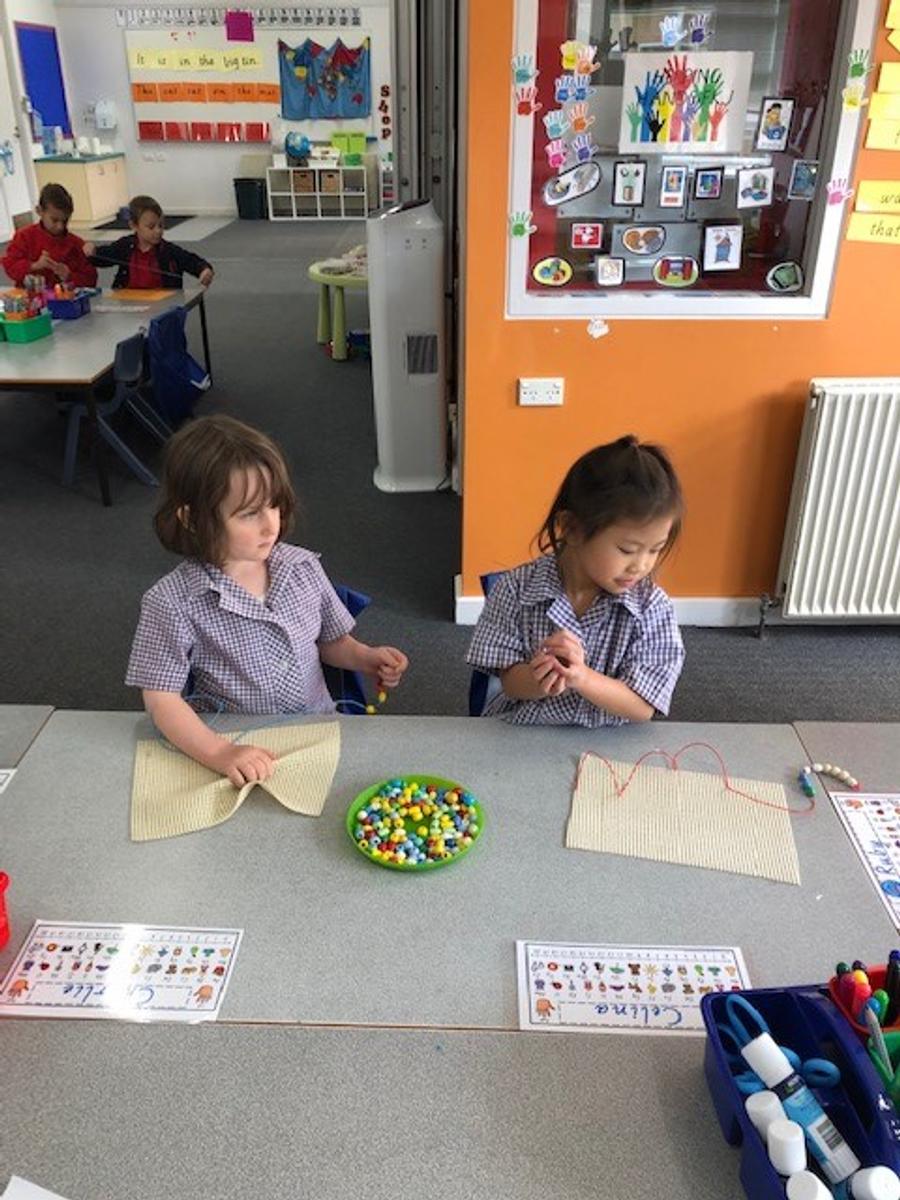
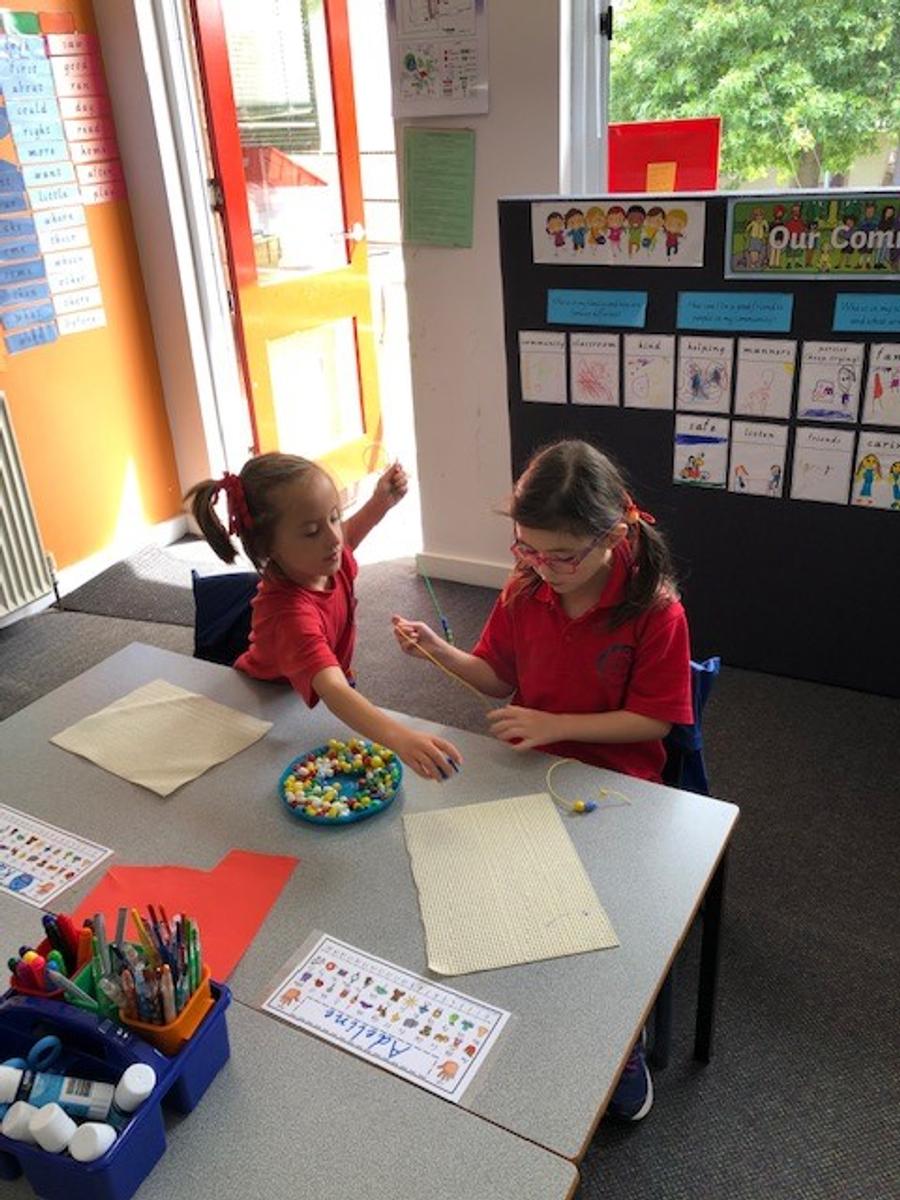
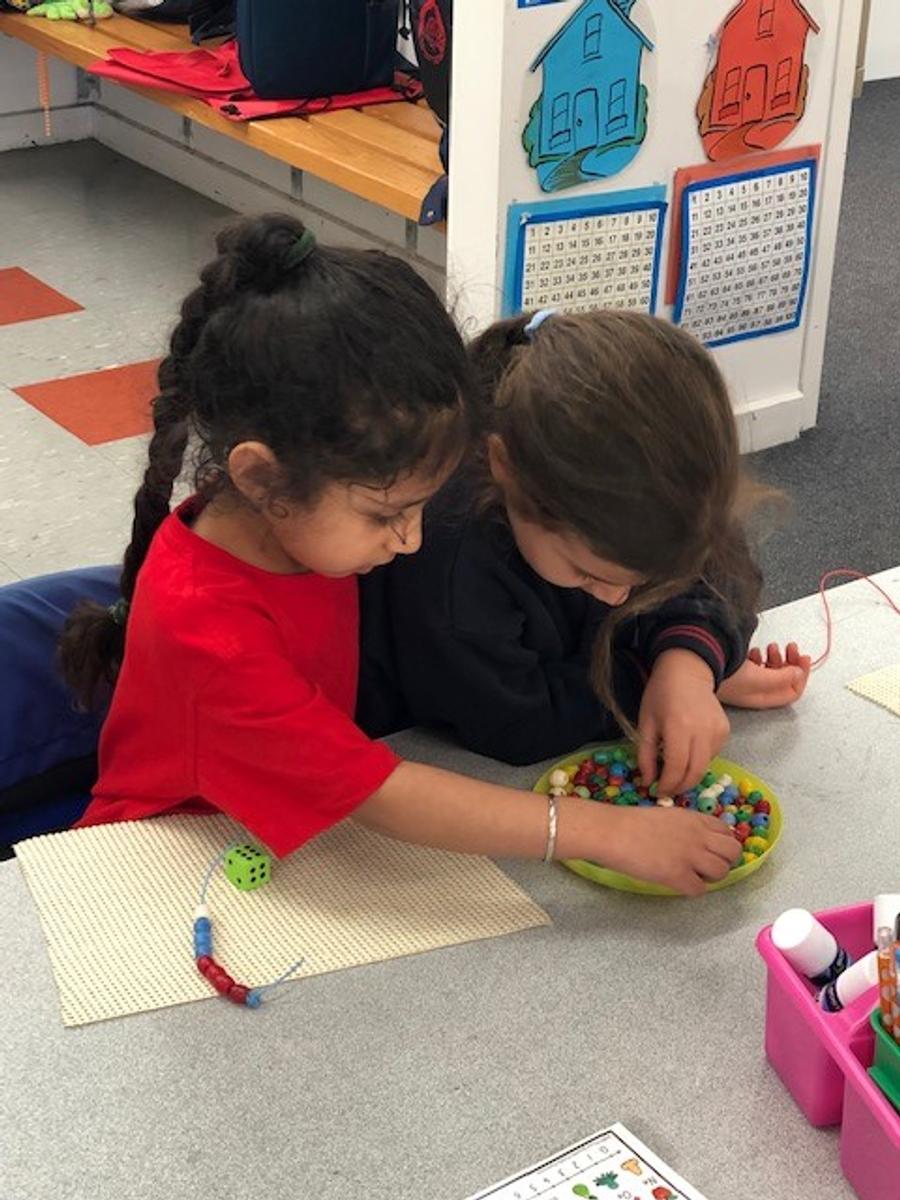
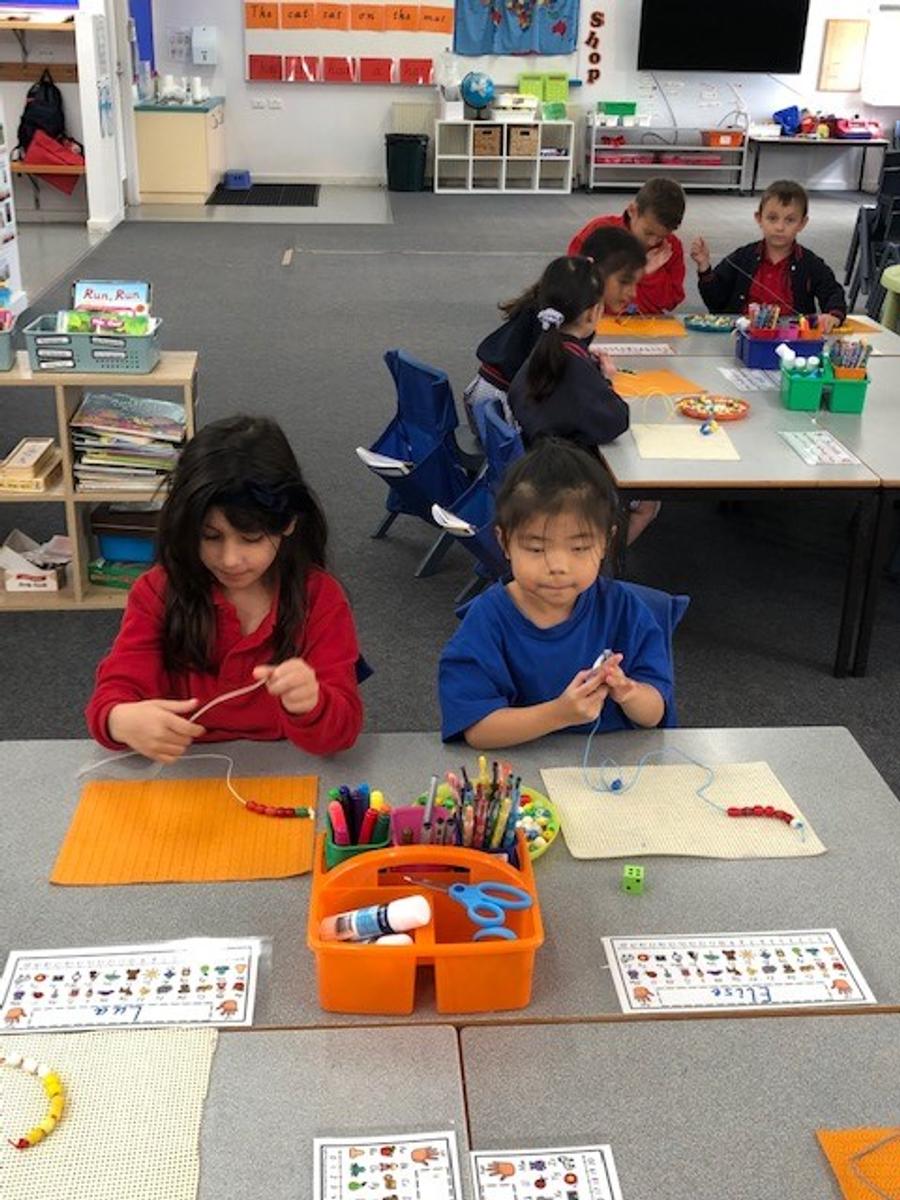
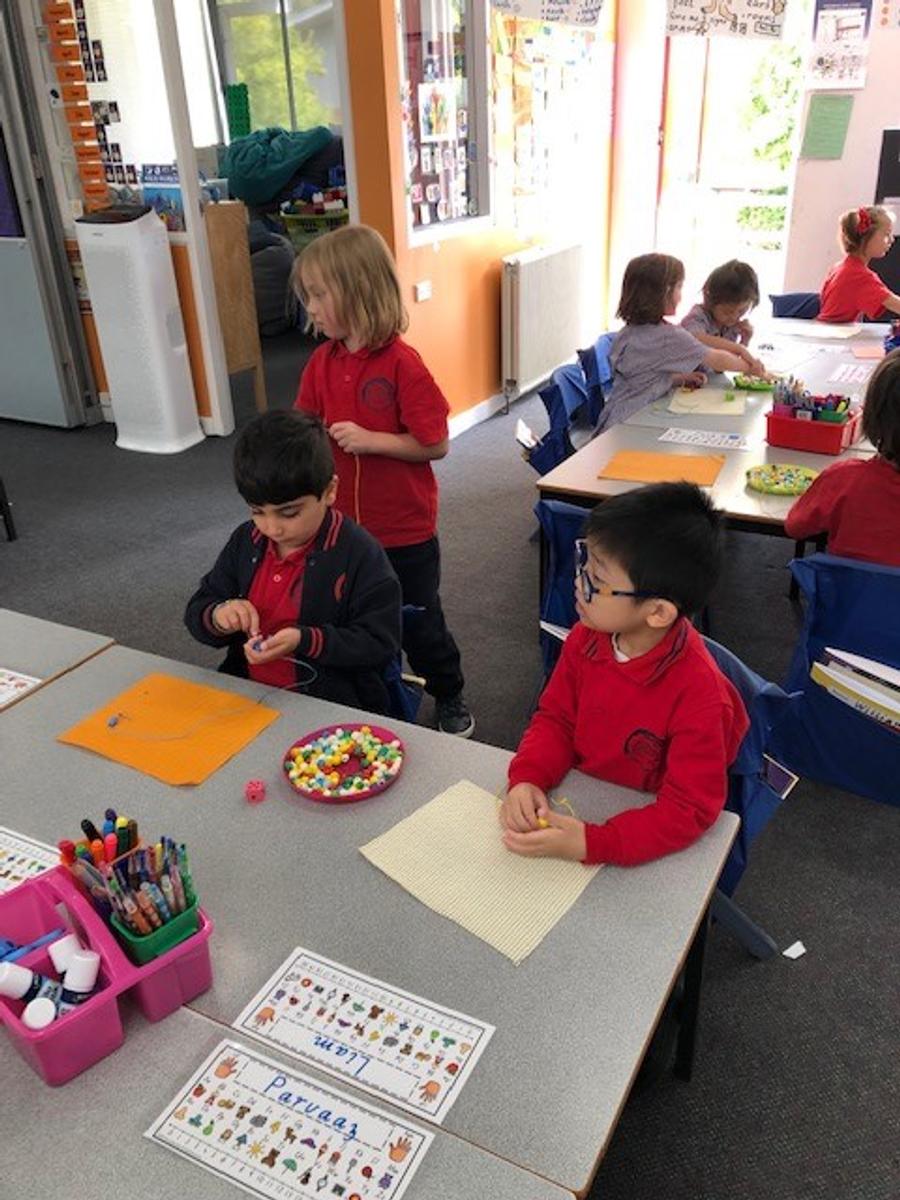
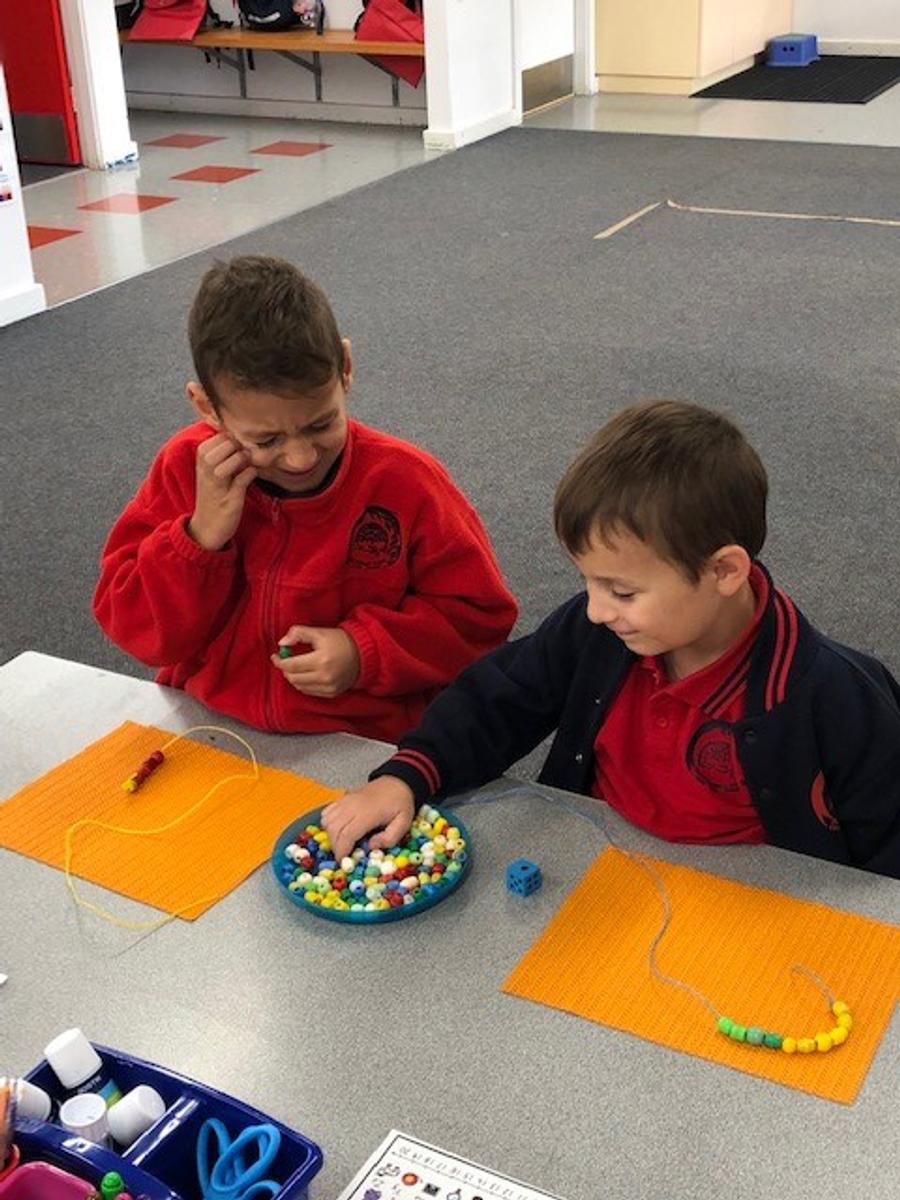
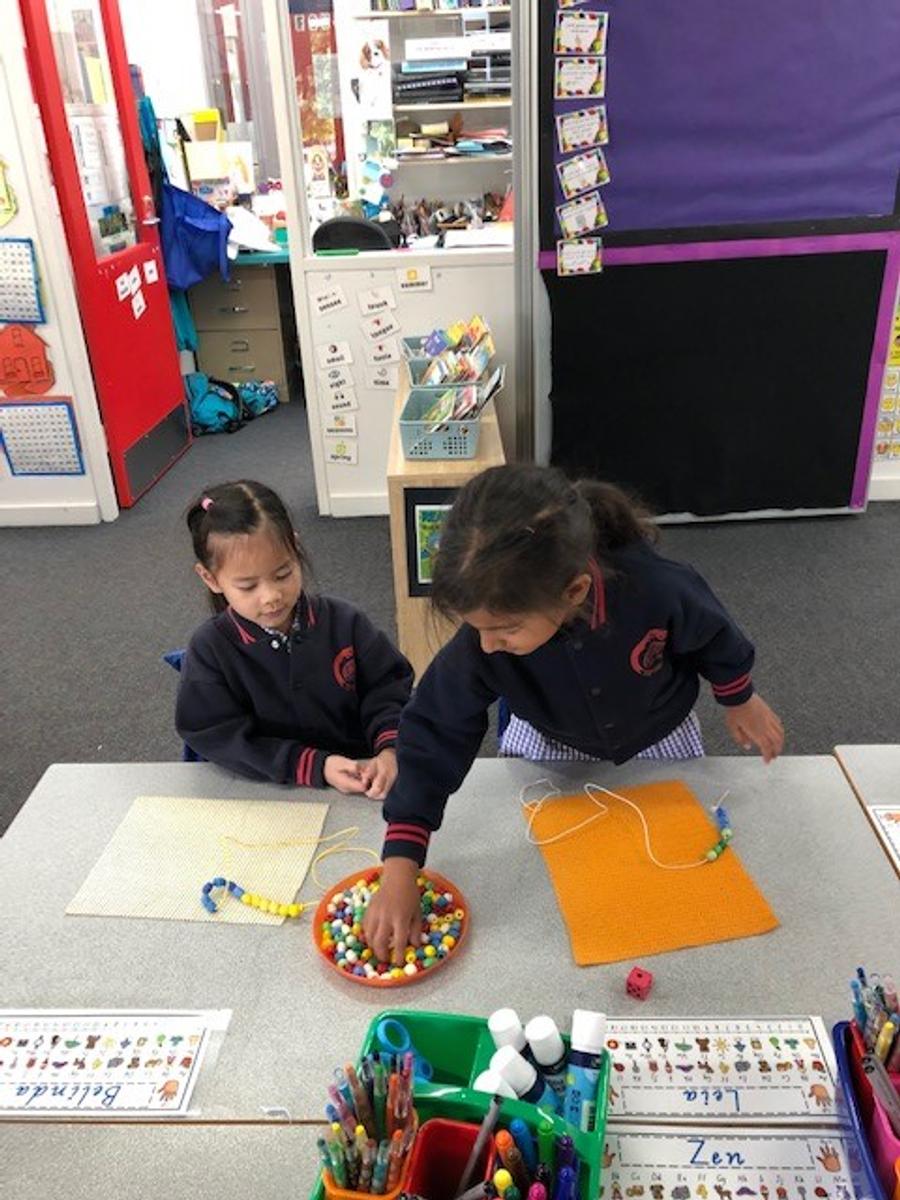
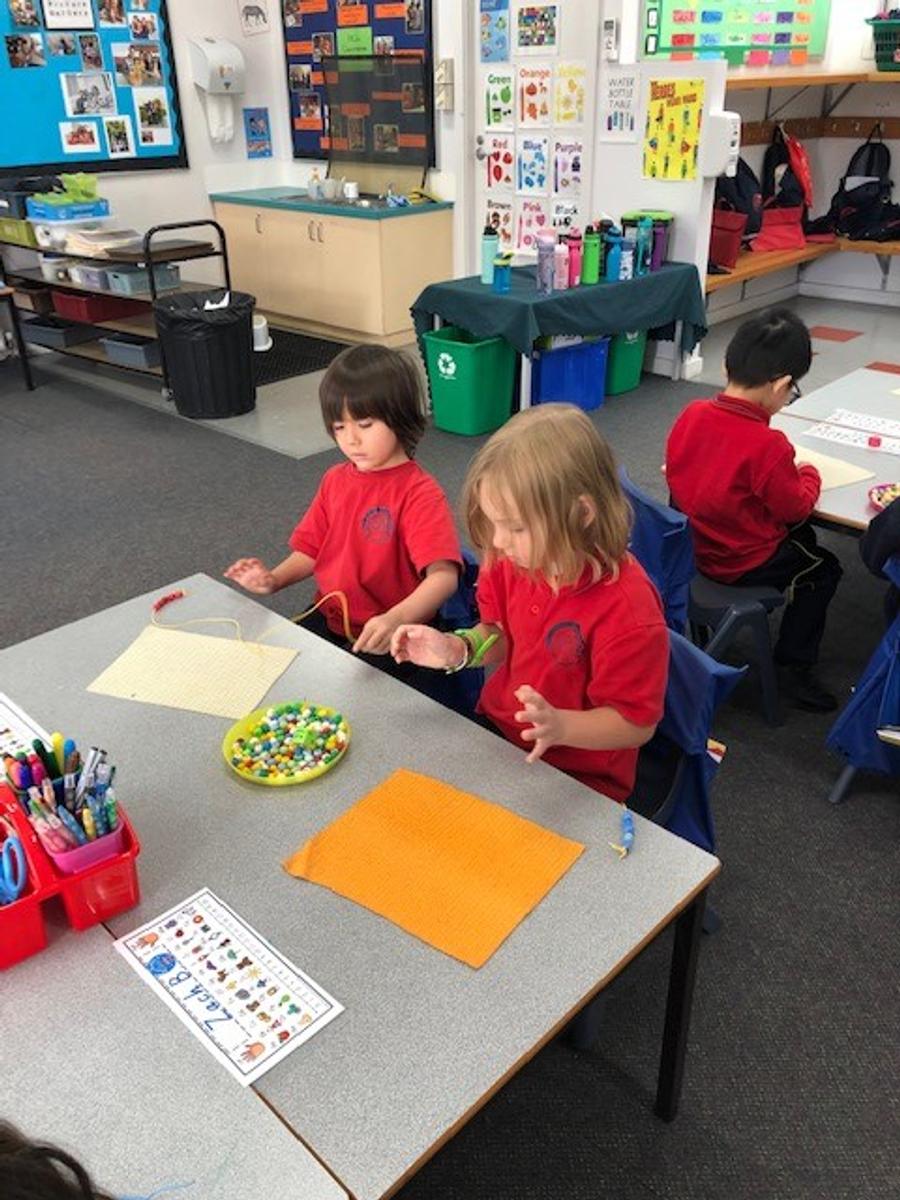
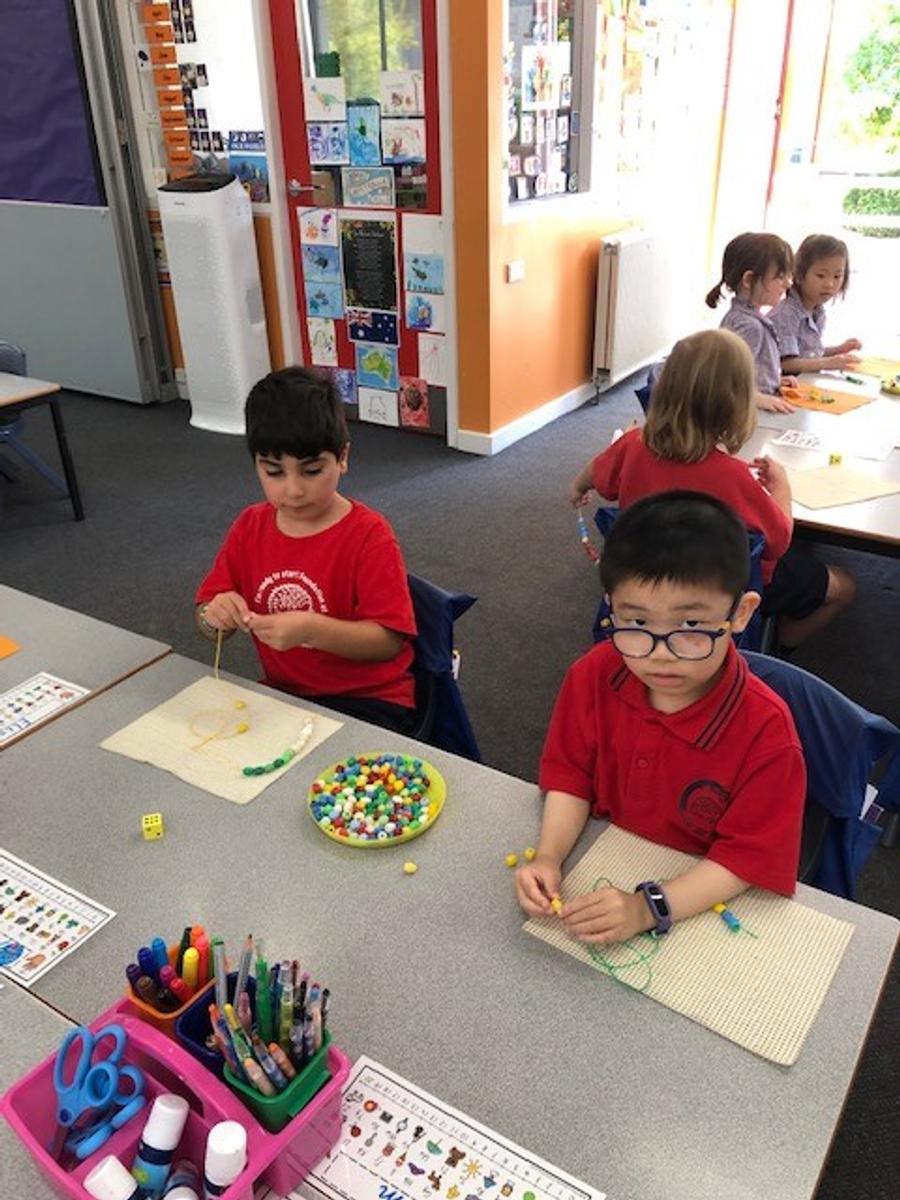
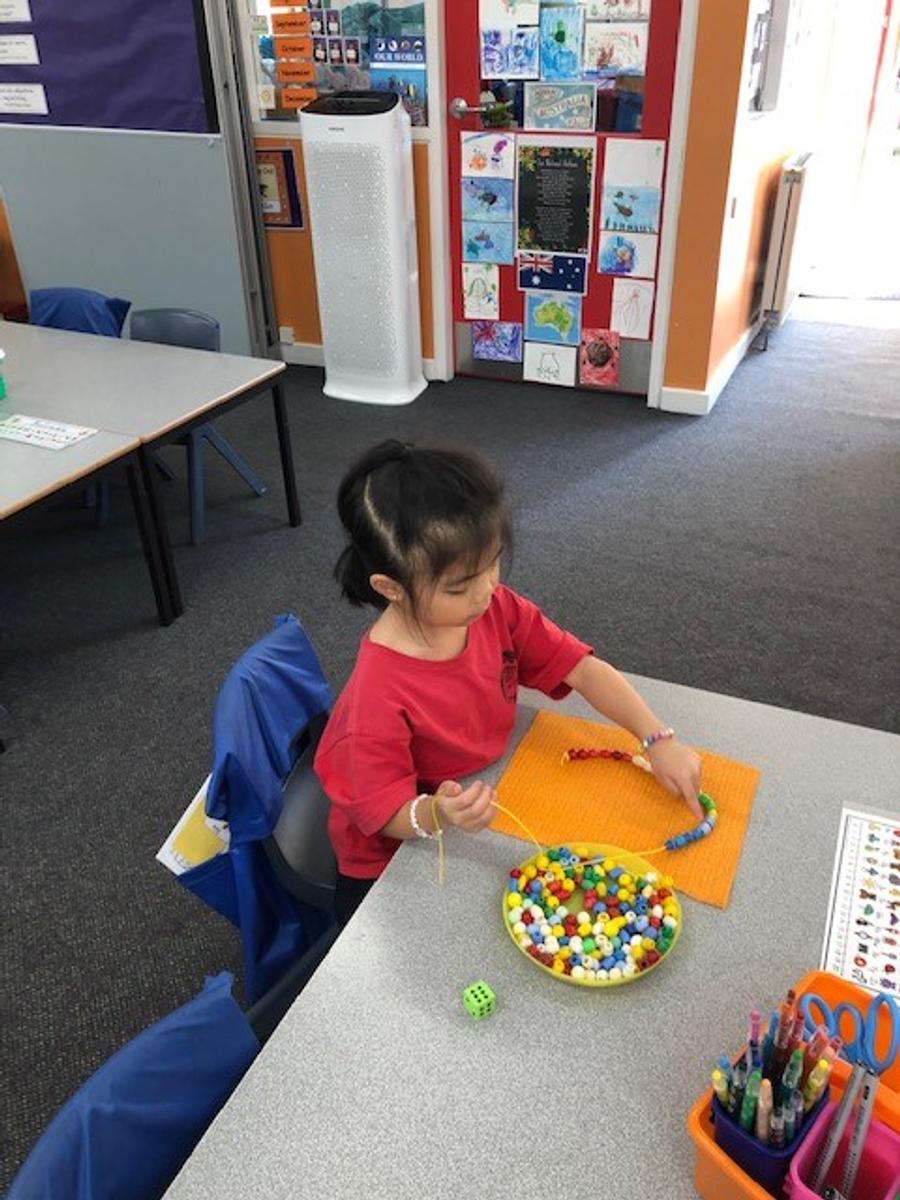
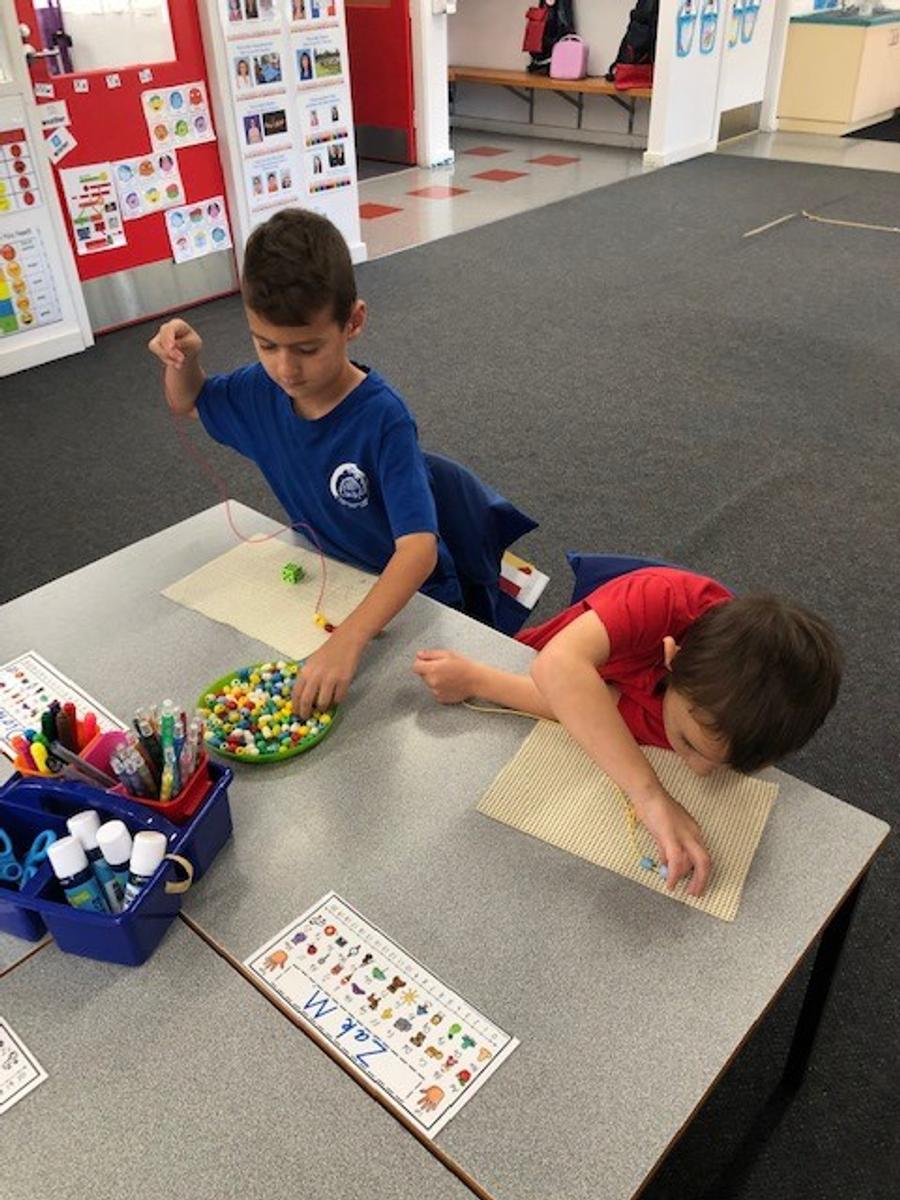
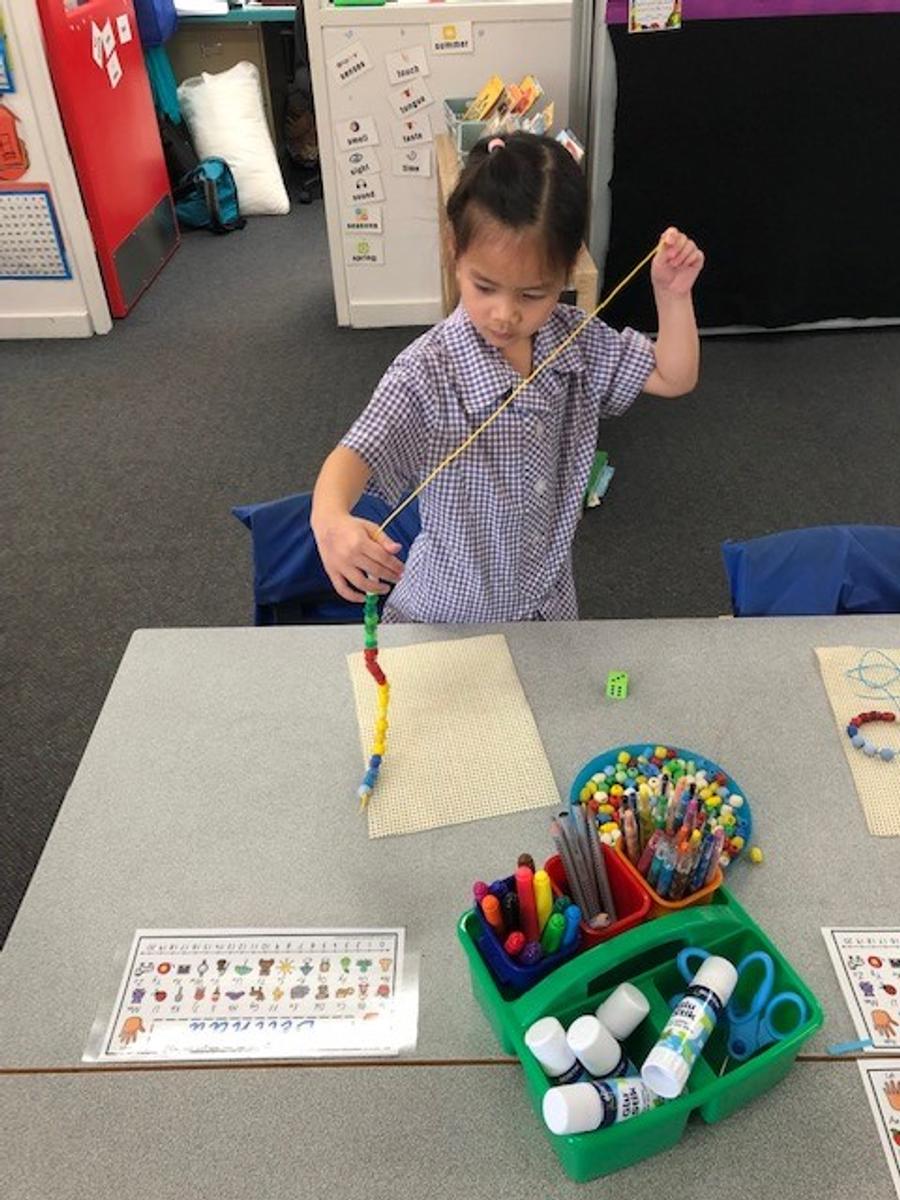
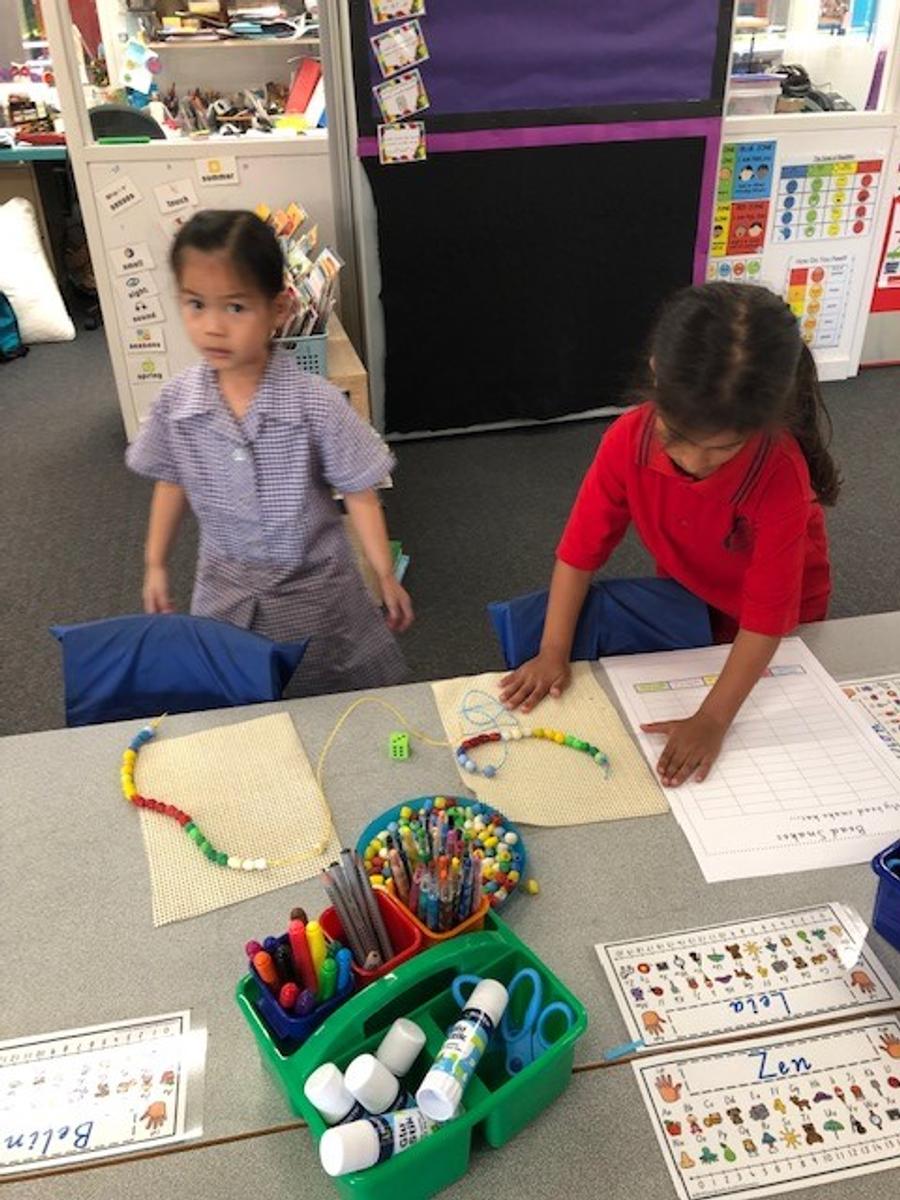
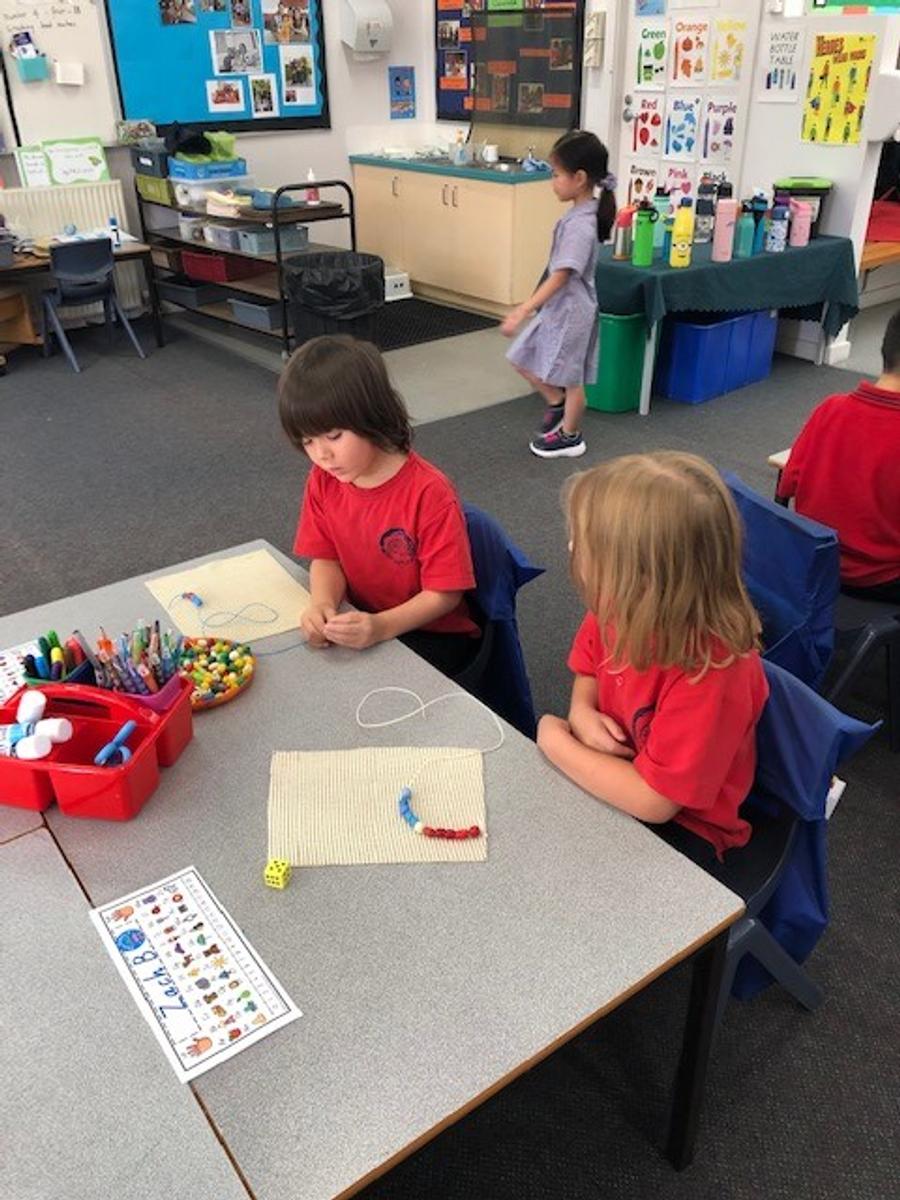
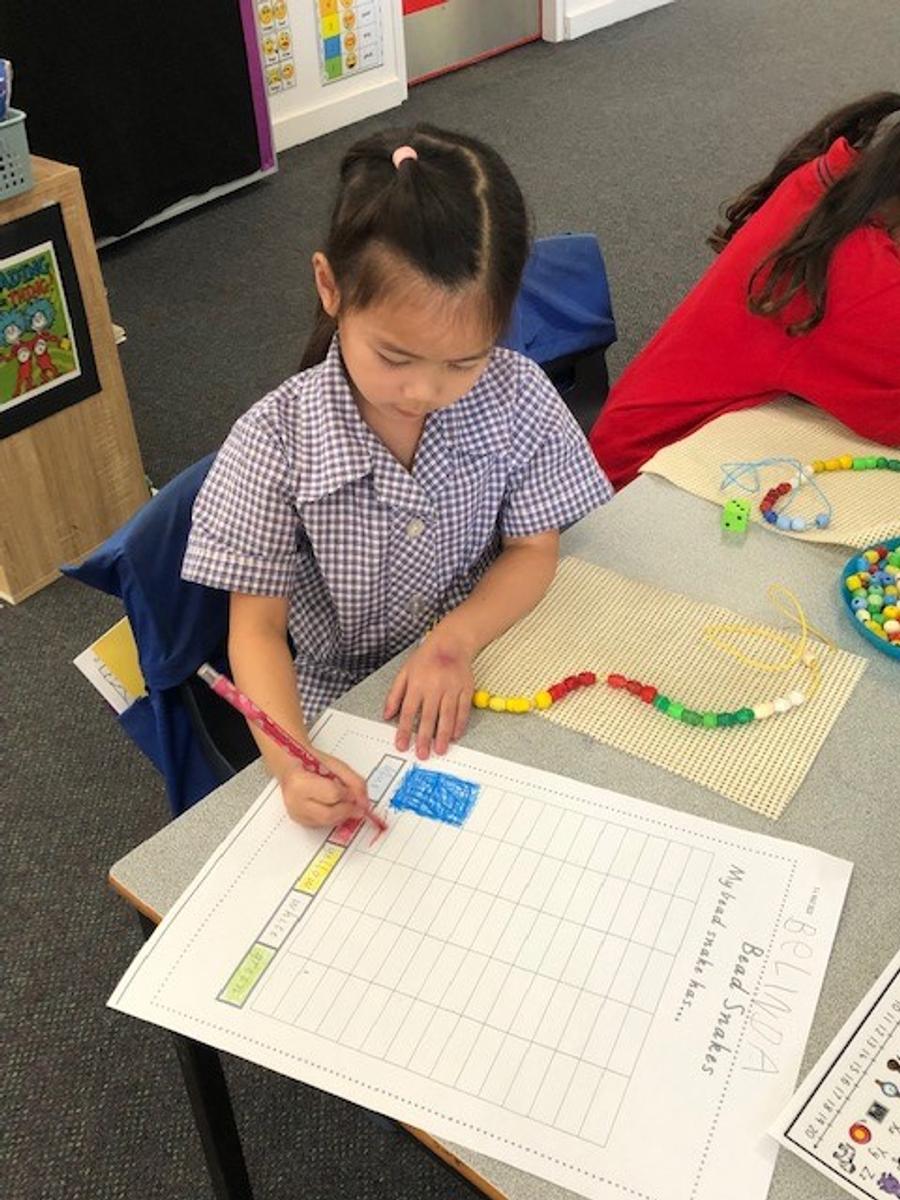
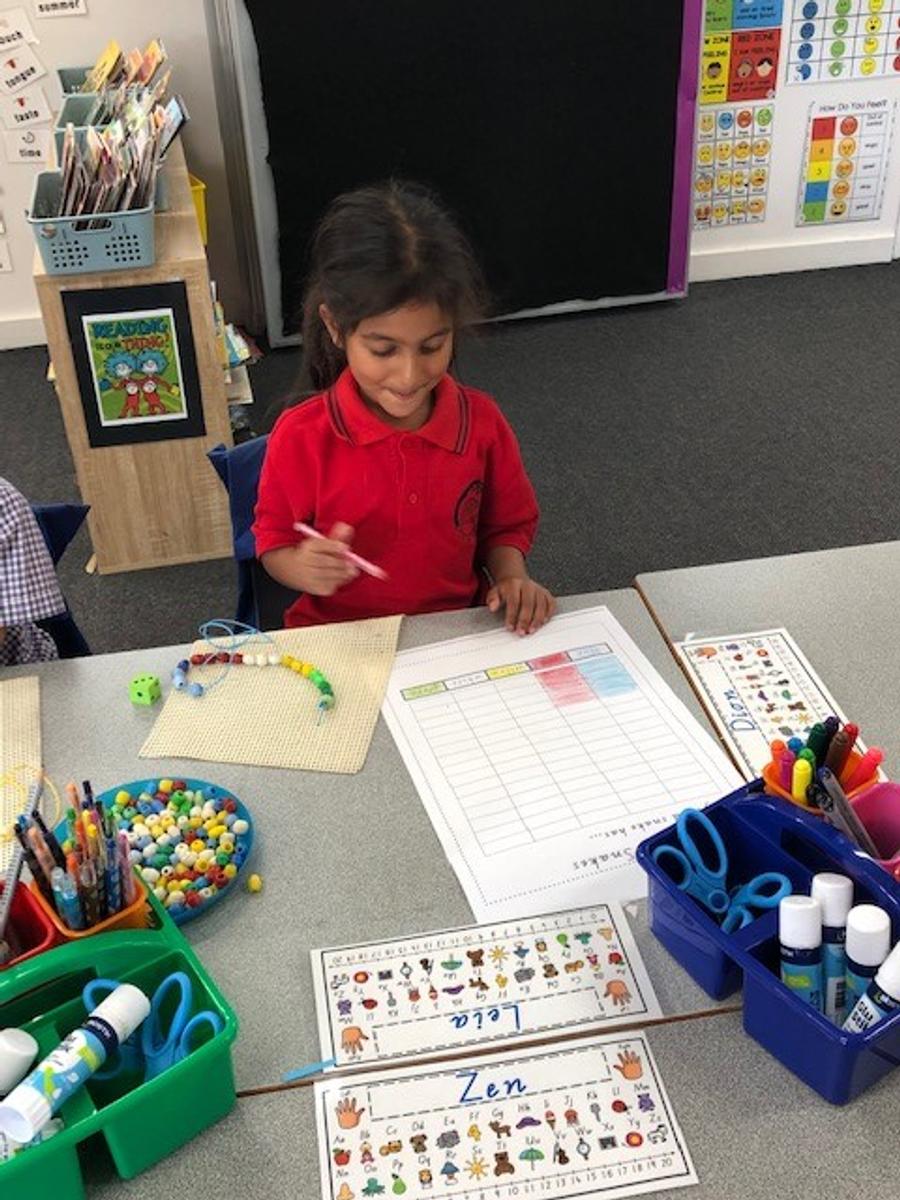
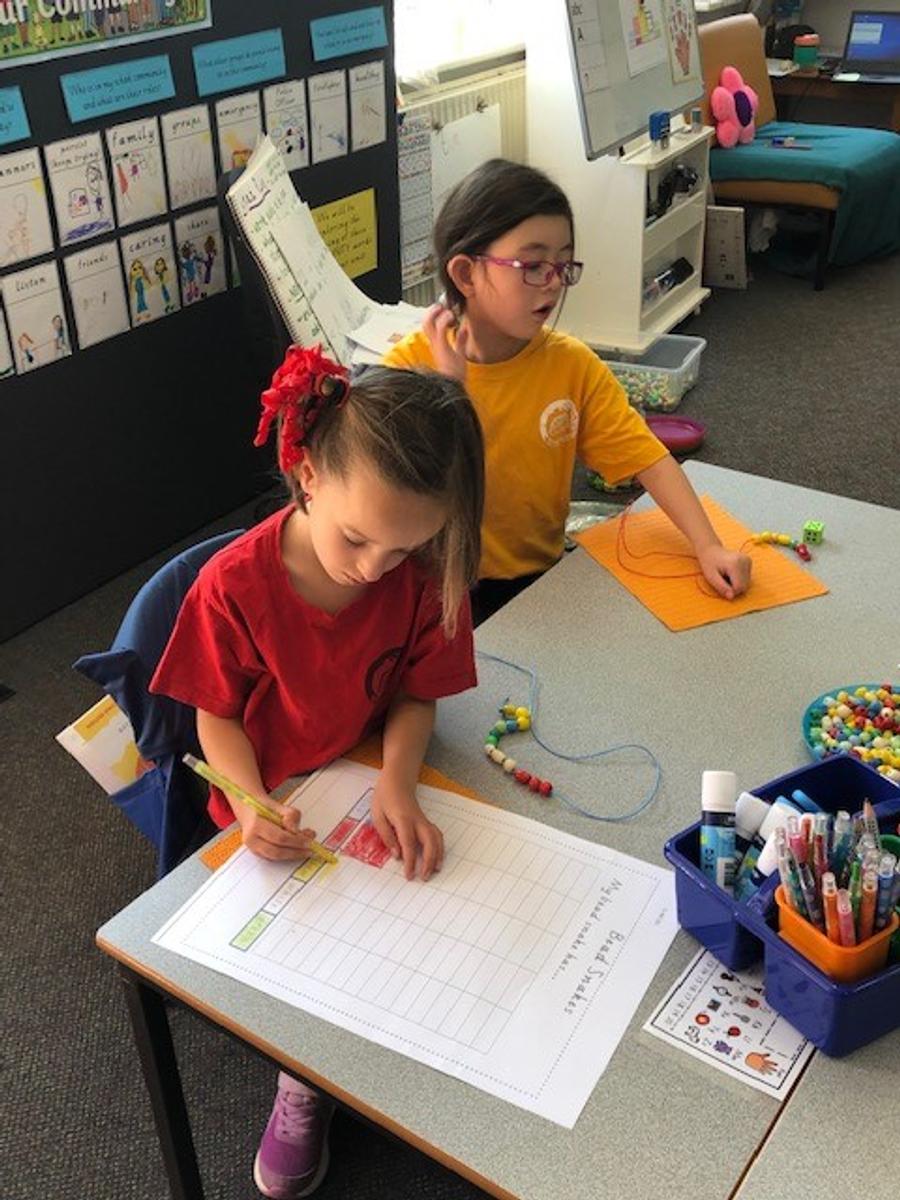
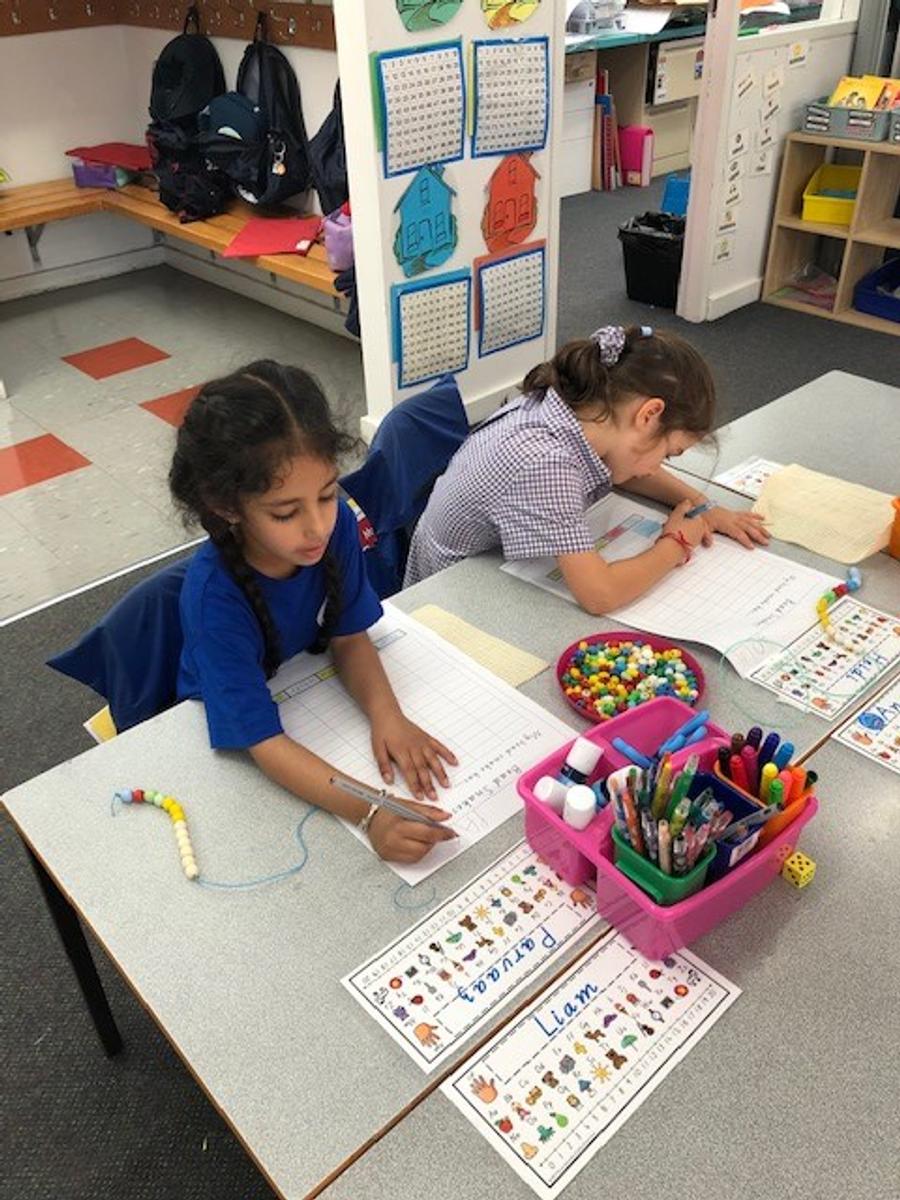
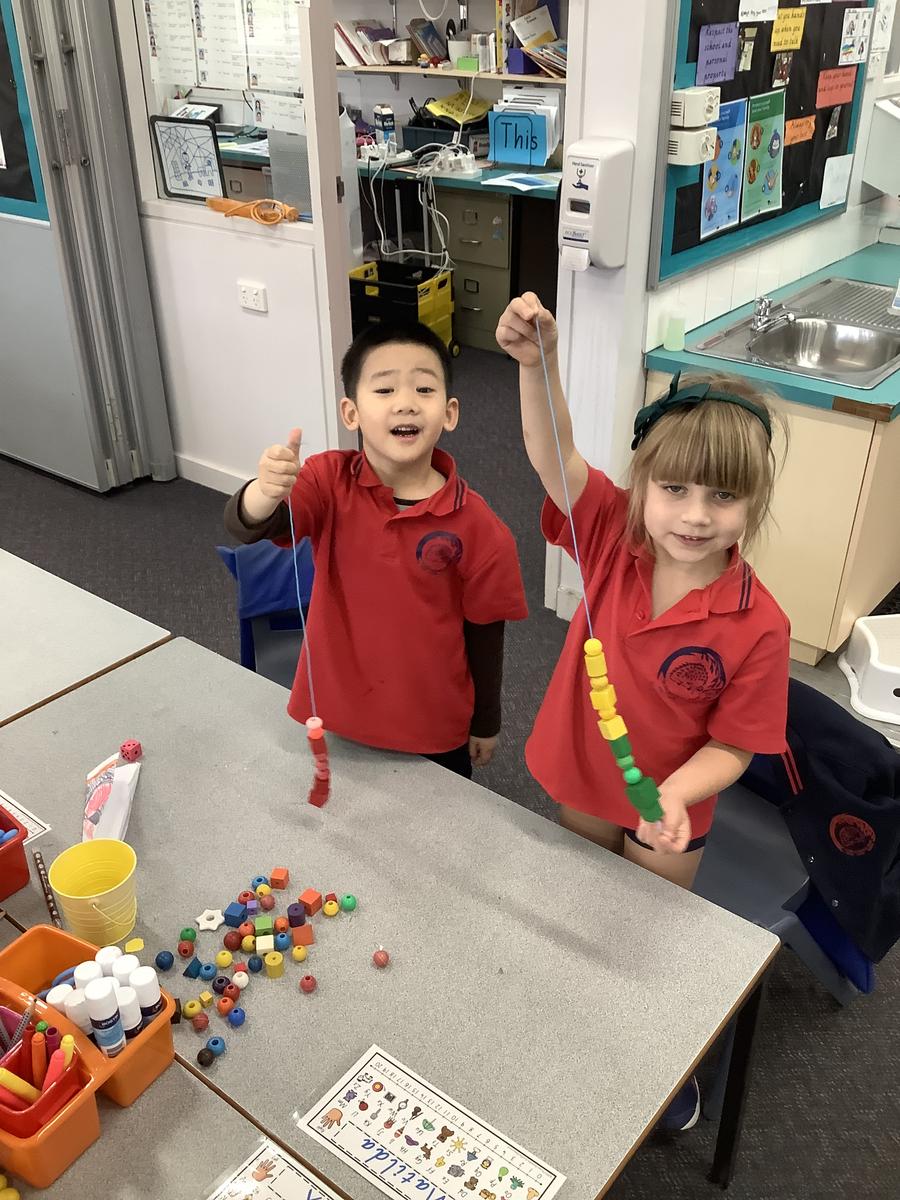
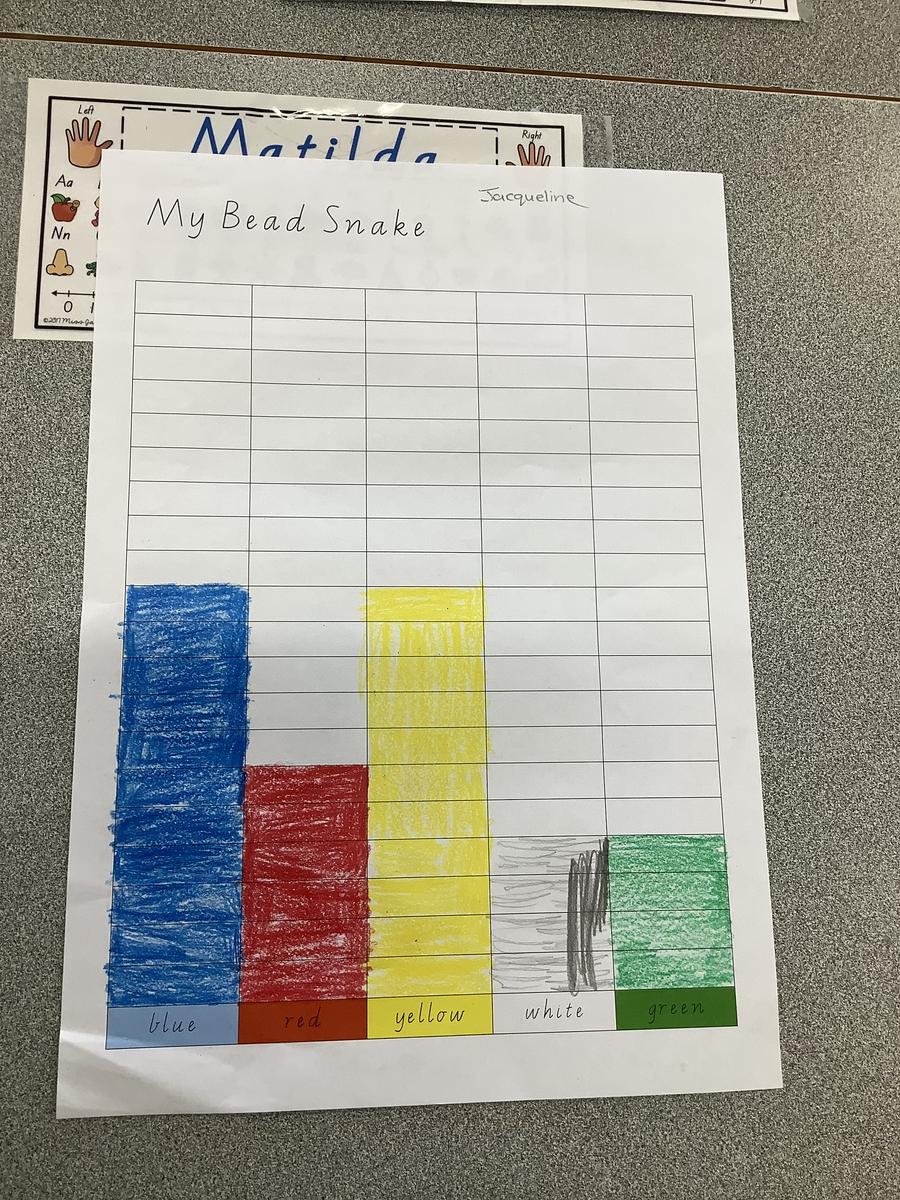
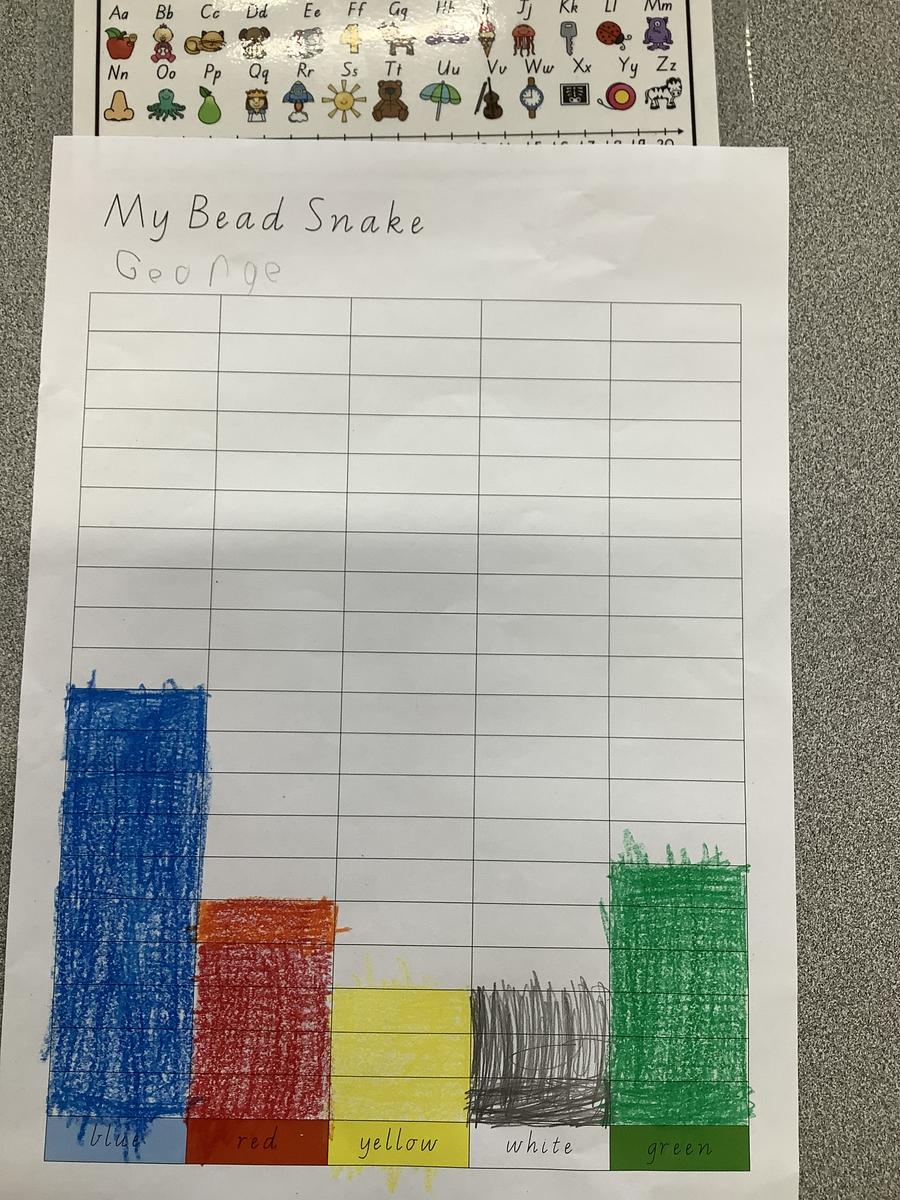
Students then lay their snake out in front of them on the table and then coloured in their own bead snake graph. Students analysed the data on the graphs and compared their snakes with other students in their class.
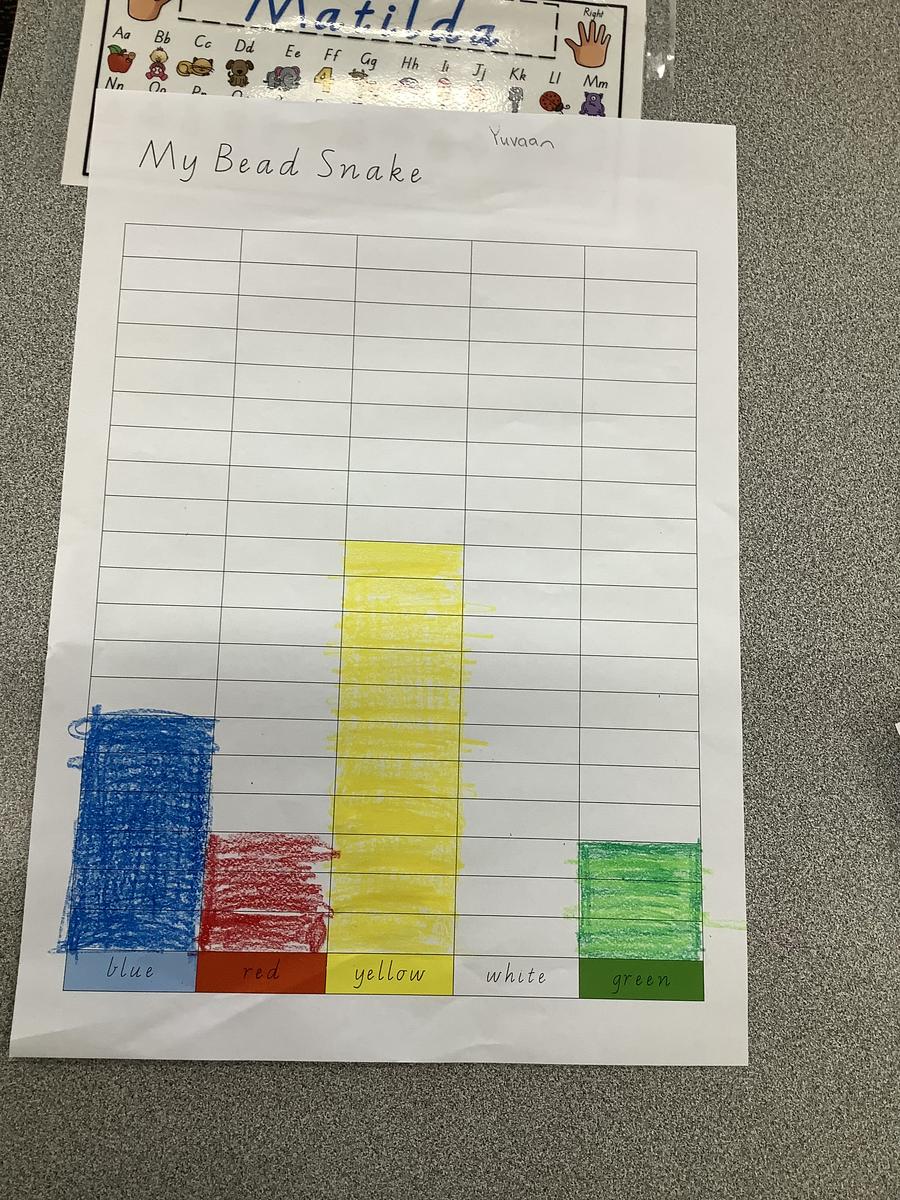
In FSR, we noticed that it was uncommon for white beads to be chosen. As you can see in Yuvaan's graph, they did not have one single white bead in their entire beaded snake. In our class discussion, we compared each other's graphs and discussed why this may be. Some of the students realised that there were not as many white beads to choose from in the beginning.
Great to see our budding statisticians tackling the activities with such enthusiasm!