Year 2

Cosmodome Incursion
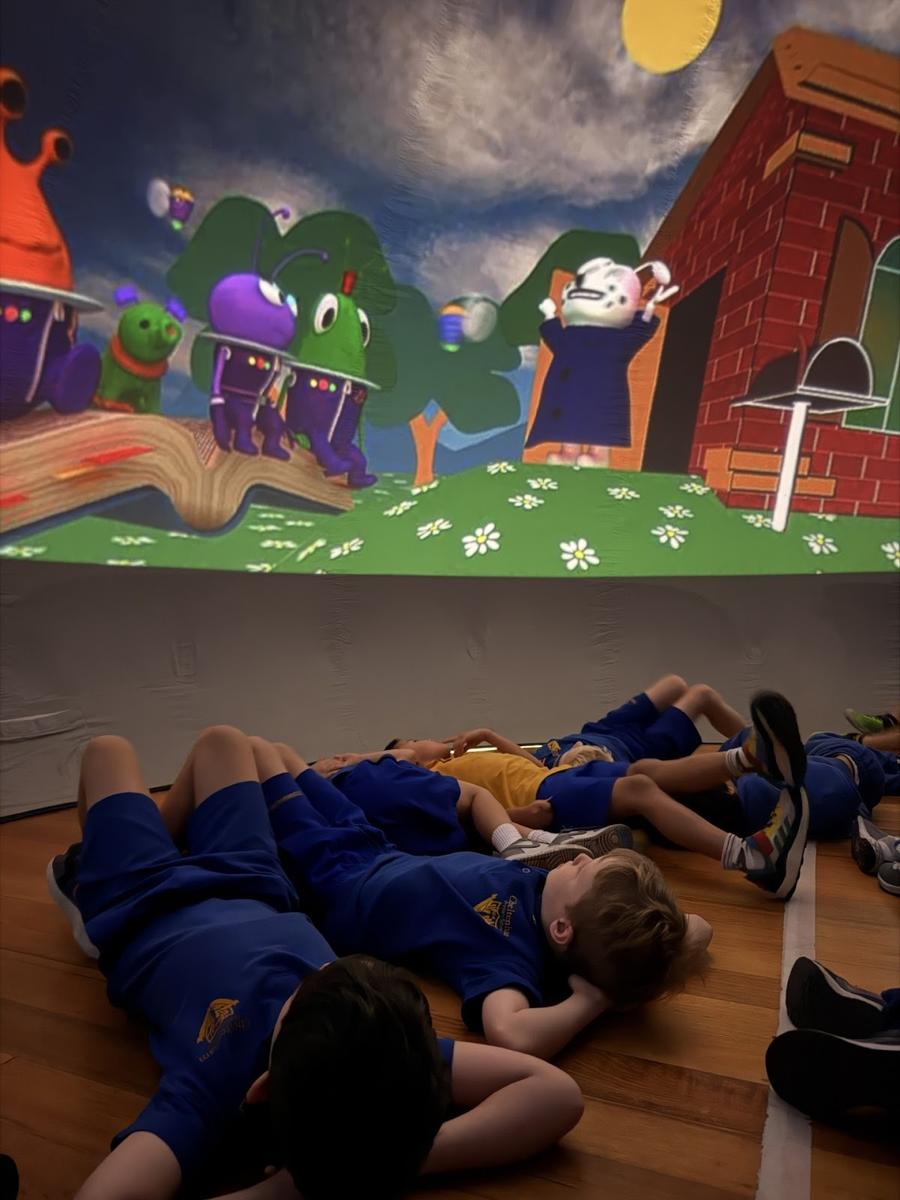
On the 4th of March, our Year 2 students explored space during the 'Cosmodome' incursion, with a special dome set up in the school hall. Inside the dome, they learned about planets and their orbits around the Sun, how the Earth’s rotation causes day and night, and how the tilt of the Earth’s axis leads to the changing seasons. The hands-on activities and simulations helped students engage with these scientific concepts in an interactive and exciting way.
Harmony Day
During Harmony Week (16th–22nd March), our Year 2 students explored the idea that people across Australia can look up and see the same stars in the sky, helping us understand how we are all connected. As part of our Space Inquiry unit, students learned about star constellations, including the Southern Cross, a group of bright stars visible in the Southern Hemisphere. They even created their own made up constellation, using star stickers and black paper for the night sky.
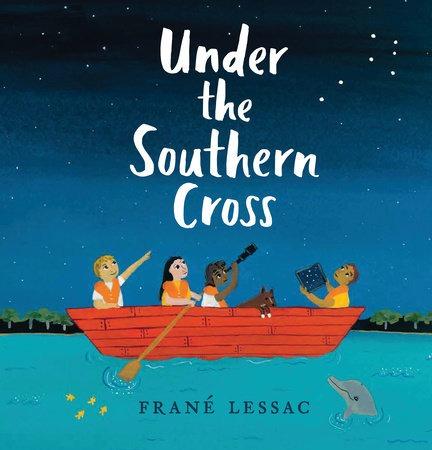
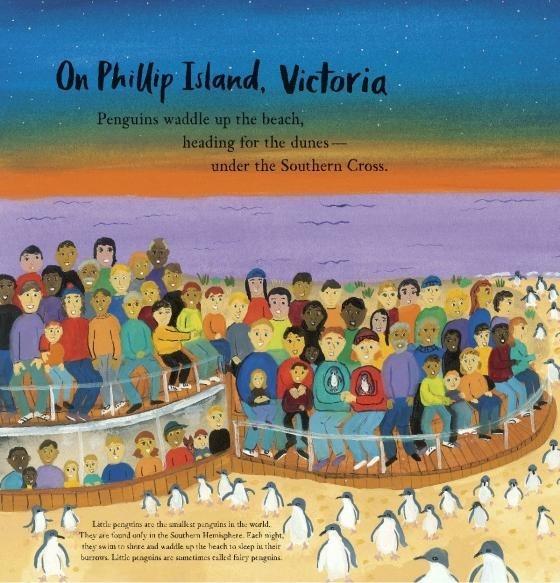
In Reading, we explored the mentor text Under the Southern Cross by Frane Lessac, which highlights how people in different places across Australia share the same night sky. In the story, families from all walks of life are shown enjoying different experiences, such as watching penguins waddle up the beach on Phillip Island, viewing movies at the Deckchair Cinema in Darwin, and seeing the Staircase to the Moon in Broome, all under the same stars.
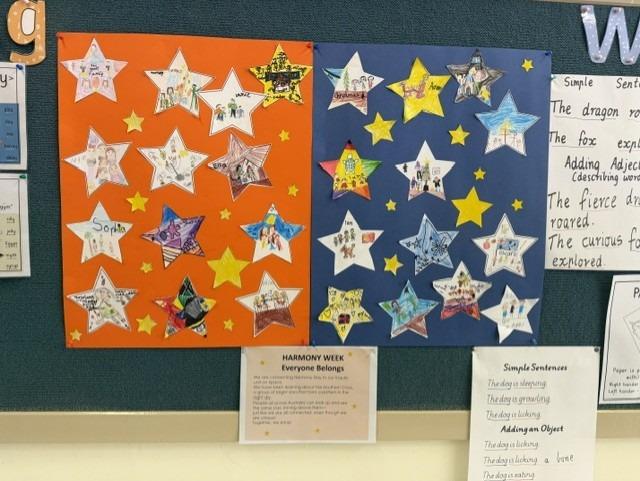
Students then created their own stars, drawing beautiful pictures of their families and sharing aspects of their culture, including traditional clothing, flags, foods, celebrations and special traditions. On Monday 30th March, students also wore orange to celebrate Harmony Day.
Maths
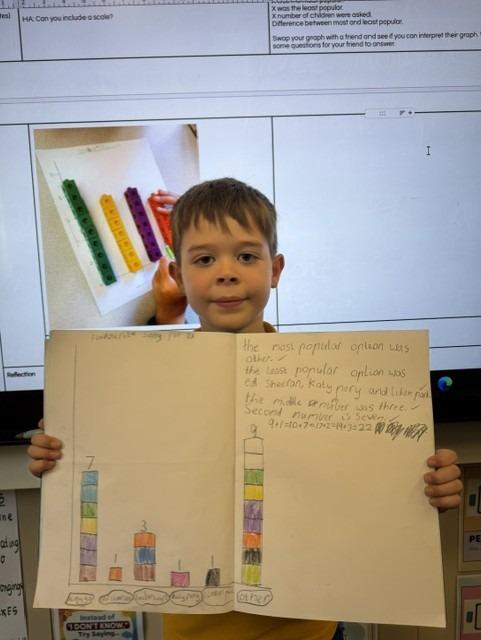
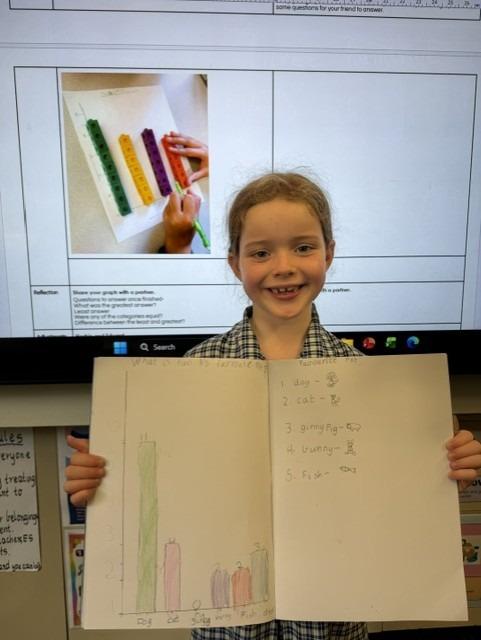
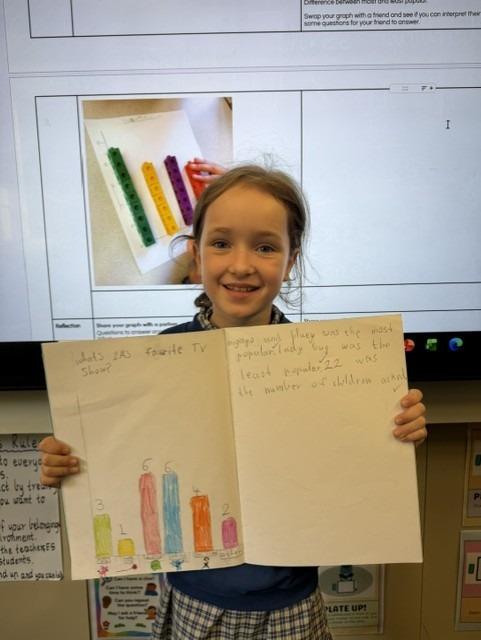
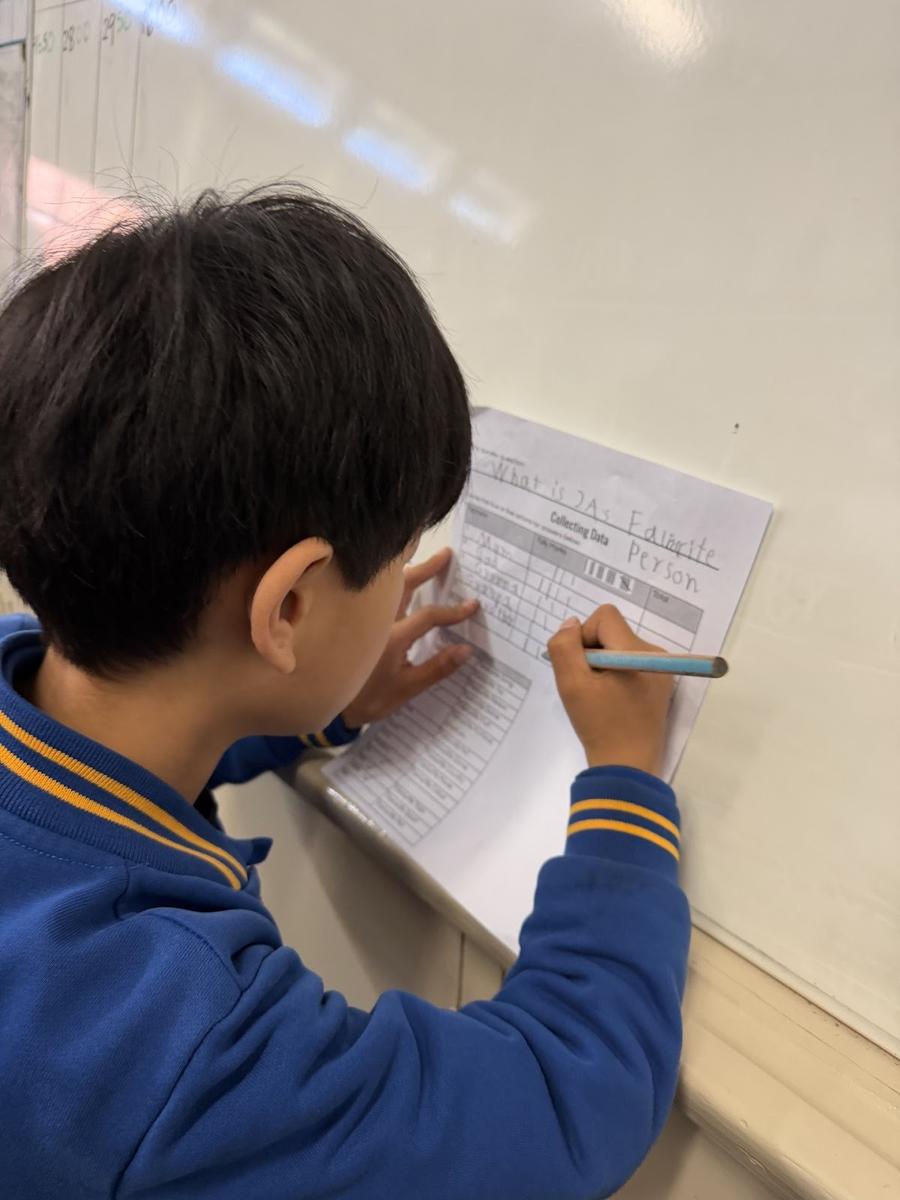
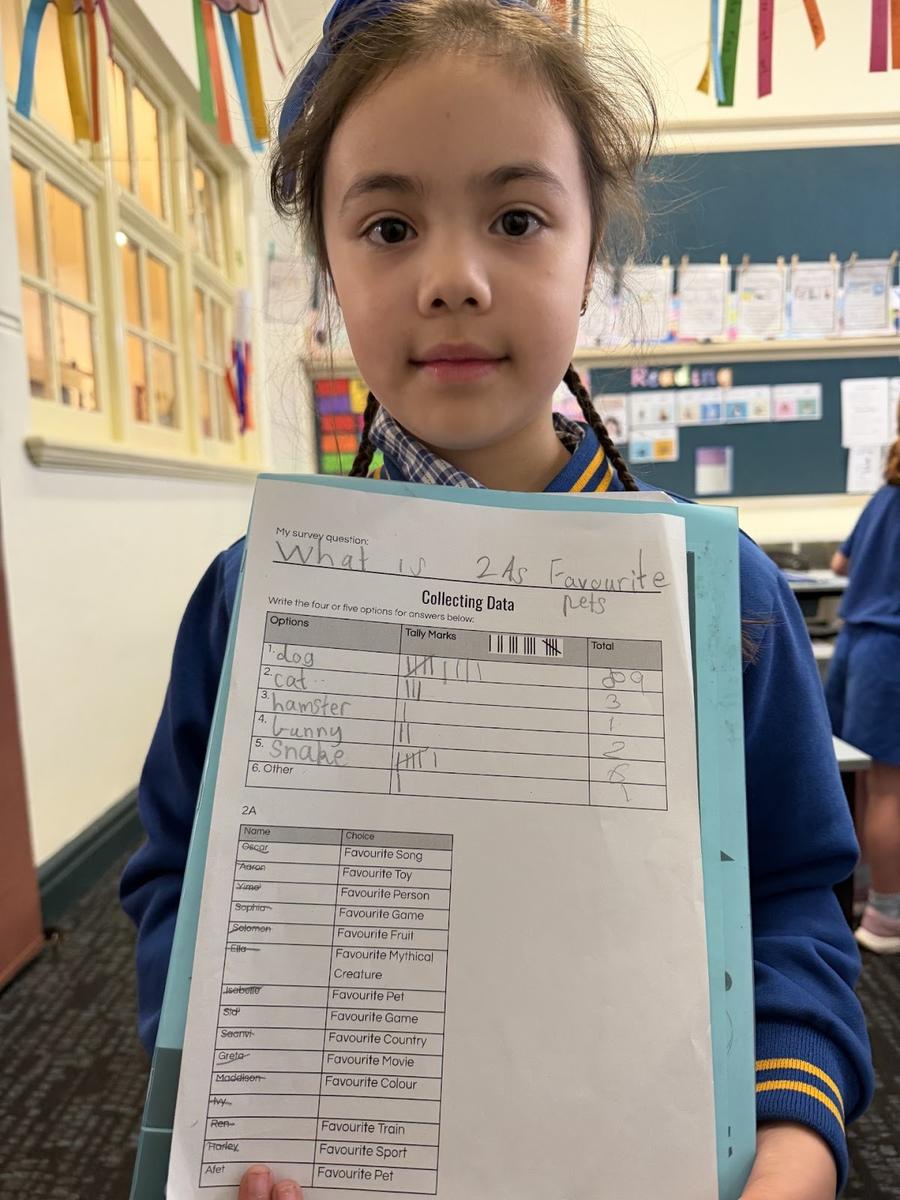
Our Year 2 students have been busy learning how to collect and analyse data! They created their own survey questions about topics they were curious about, such as favourite pets, mythical creatures, toys, or sports. Students developed five response options, asked their classmates, and recorded answers using tally marks. They then represented their findings in simple bar graphs using unifix cubes and discussed and wrote statements about their data, identifying the most popular option, the least popular option, and the total responses.