A Look at Learning
From the LOP

A Look at Learning
From the LOP
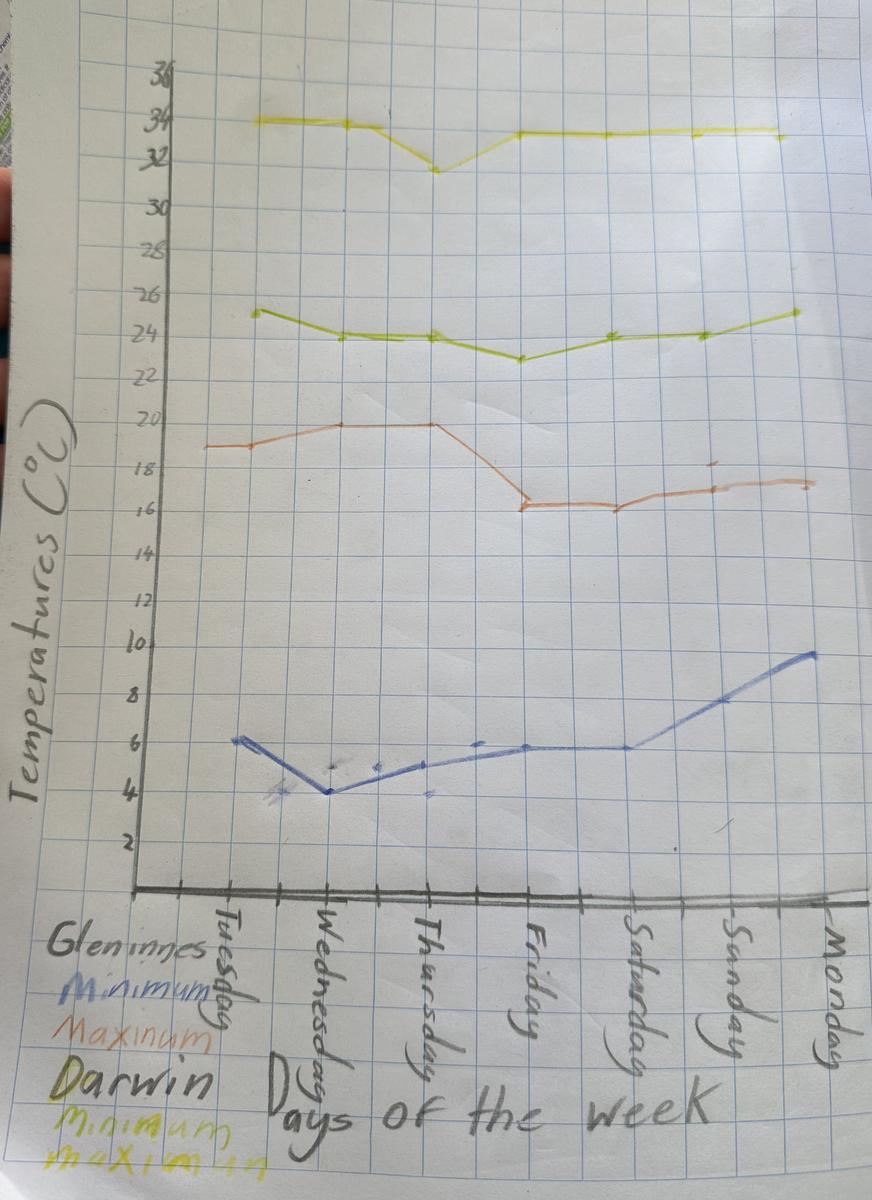
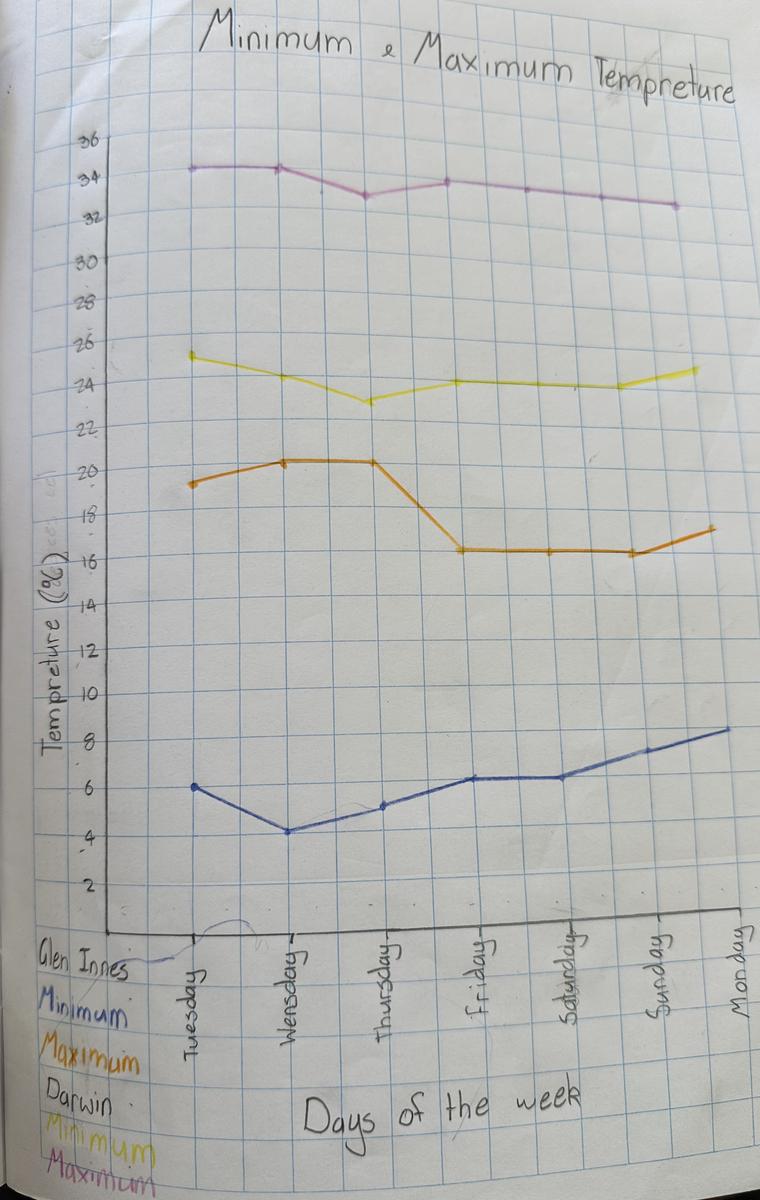
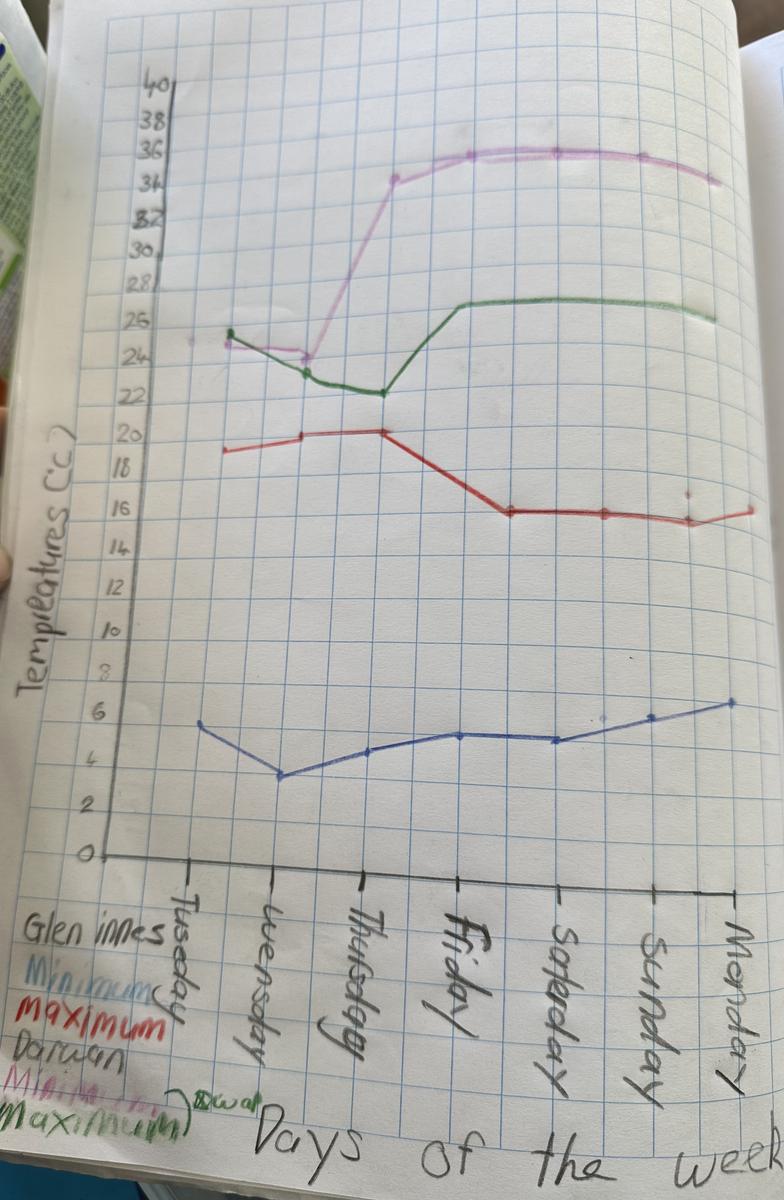
In Stage 3, students have been learning about Data, specifically, they have been learning to construct graphs using many-to-one scales and interpret data displays including timelines and line graphs.
Below are examples of Stage 3 students Will Grimmond, Charlotte Neville and Isabelle Key's line graphs where they had to determine a suitable scale to compare the minimum and maximum temperatures of Glen Innes and Darwin. No surprise that Darwin was a lot hotter! Their minimum temperatures soared above our maximum temperatures for the week.
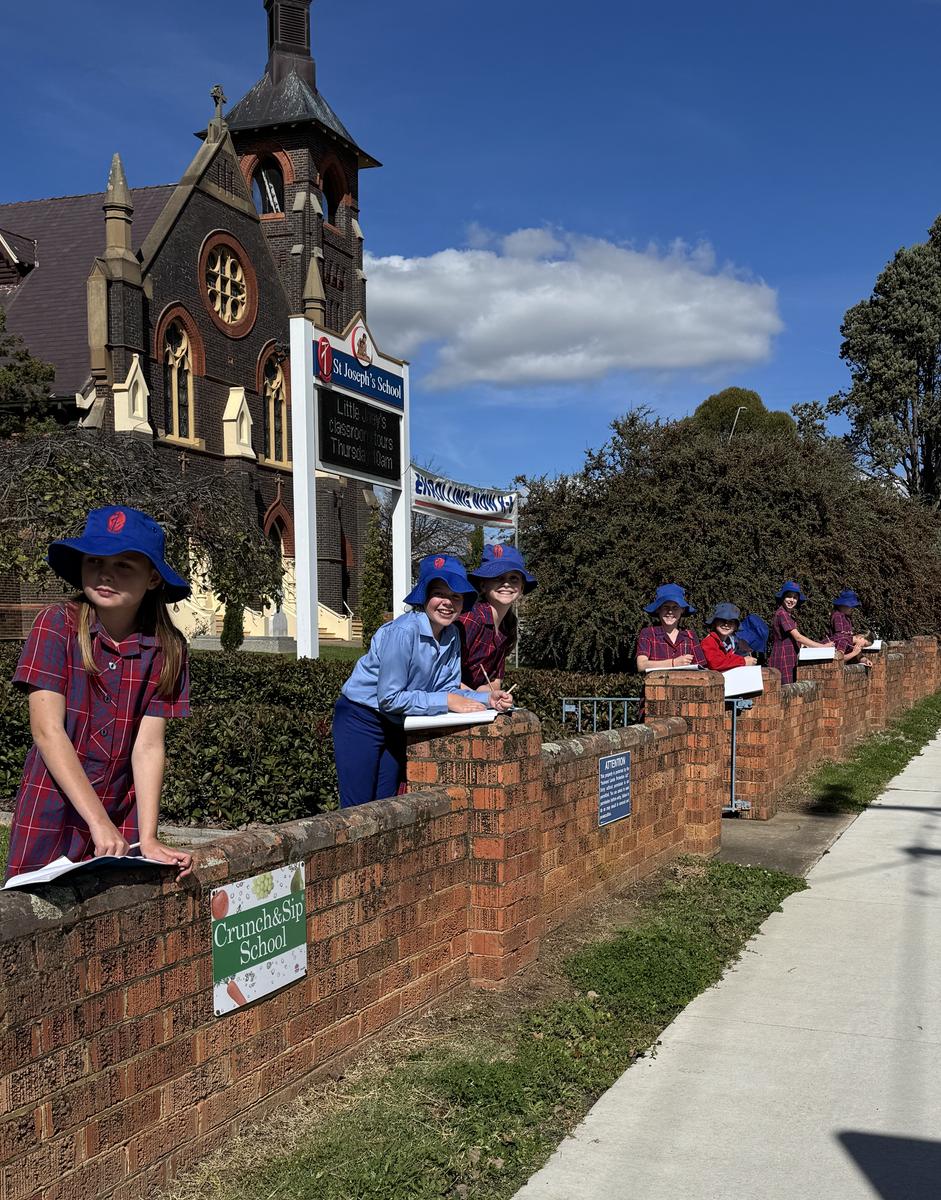
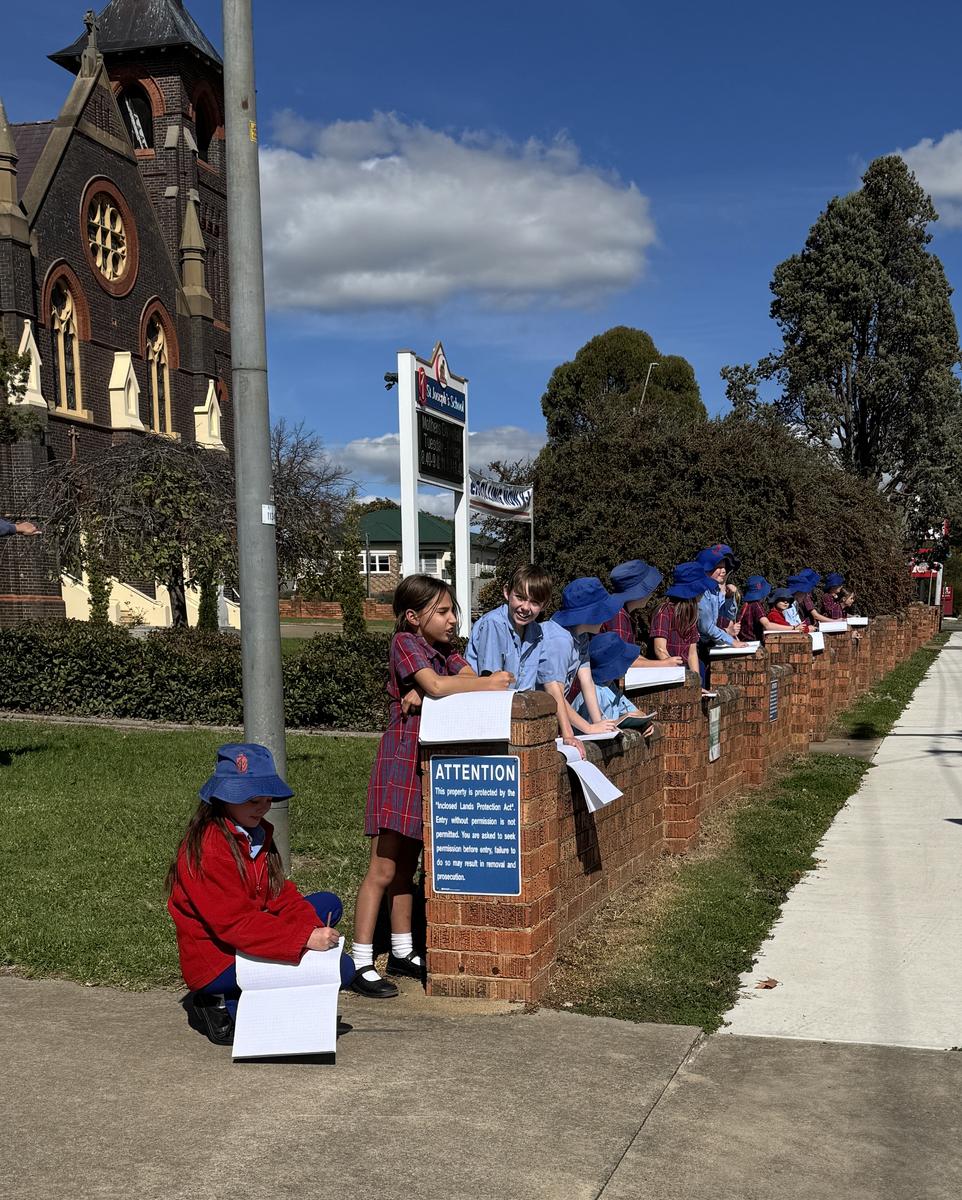
On Wednesday, Stage 3 students went to the front of the school to tally data to complete line graphs. For each consecutive minute that passed, students had to tally how many vehicles passed the front of the school. A lot of fun was had by all!
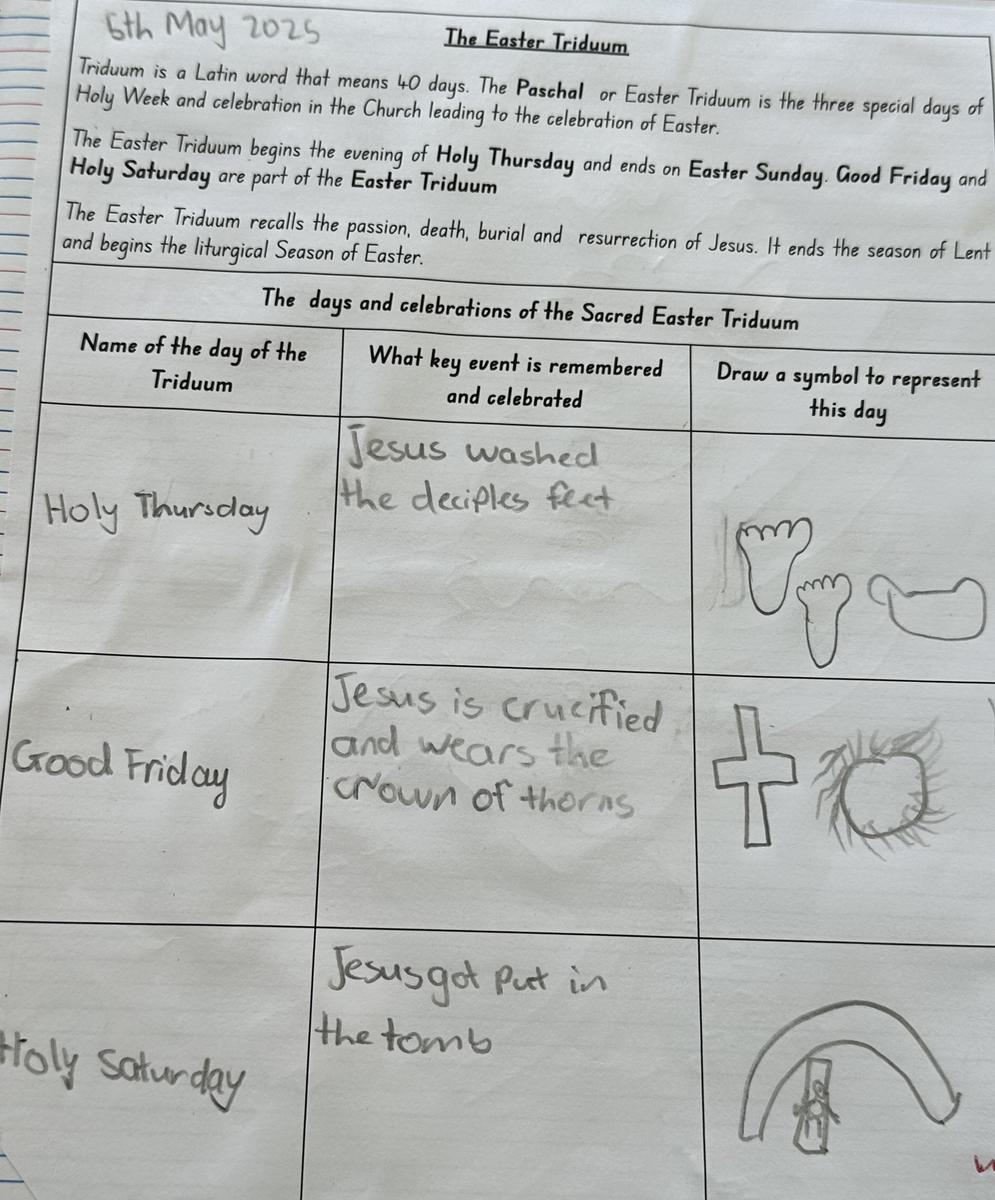
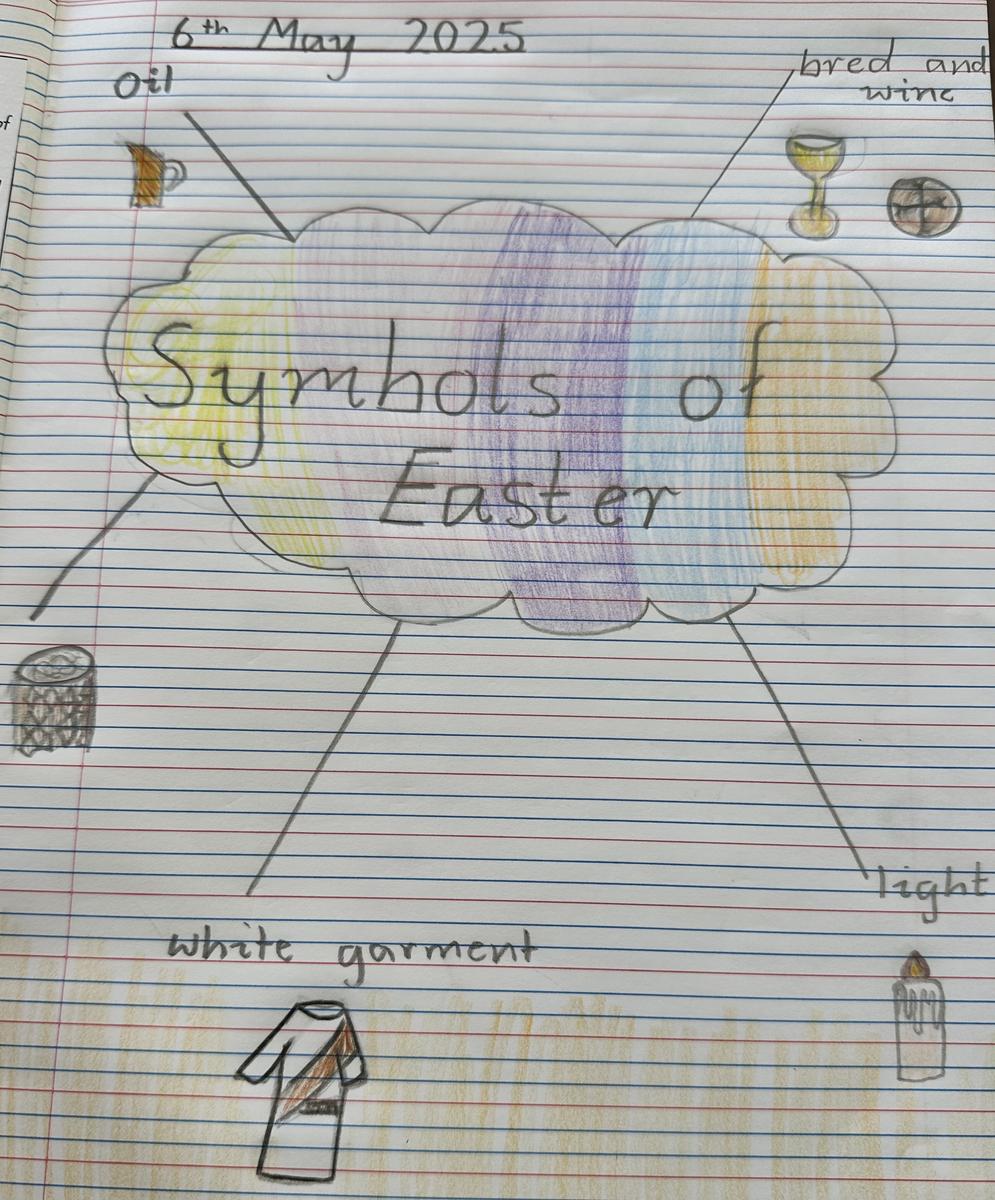
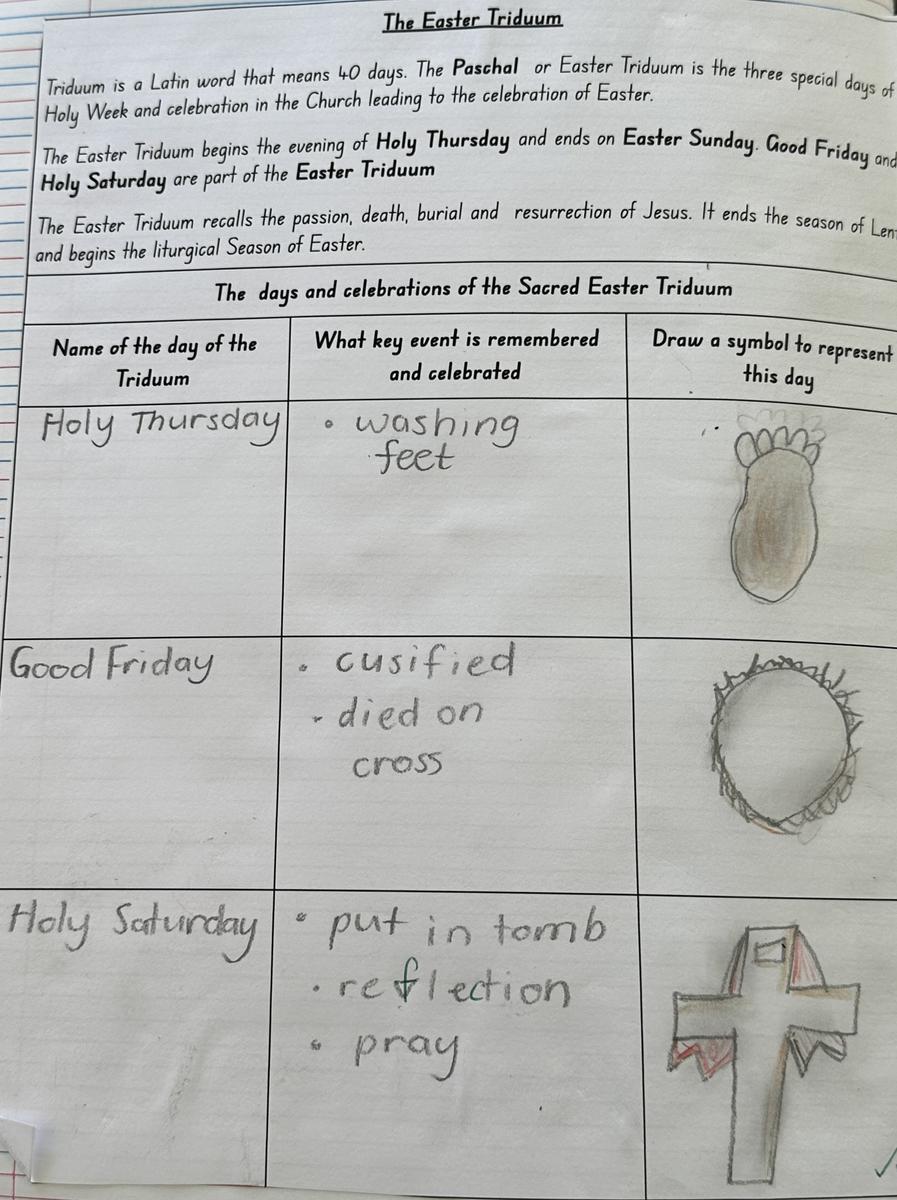
In Stage 2, students have been exploring Easter, understanding that Easter is the most important liturgical season of the Church. In learning about this they have been exploring key events and symbols related to the season of Easter. Below are work samples from Caitlin Kneipp, Ivy Watson and Eva Poschelk.