
Focus on Learning
Stage 3

Focus on Learning
Stage 3
Maths in the 3/4 Room
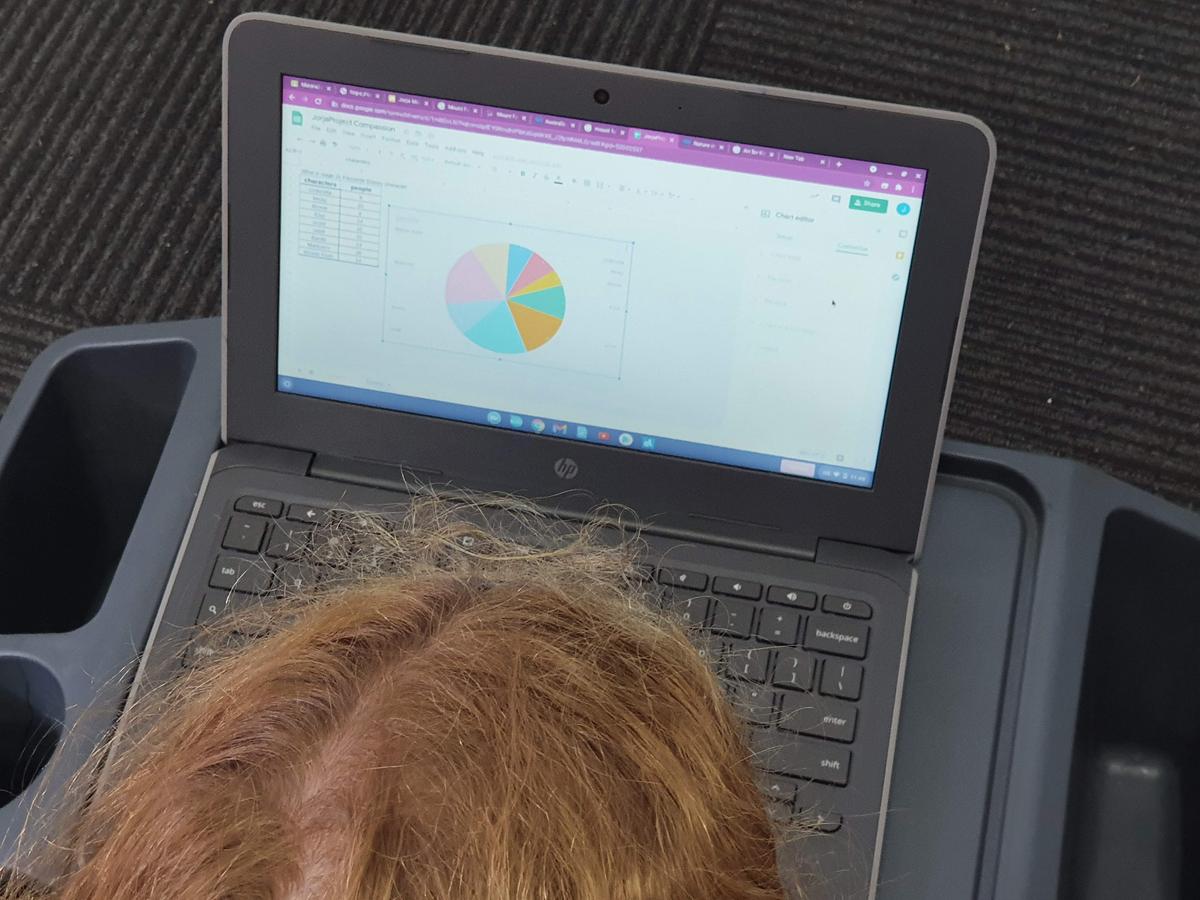
This Year Mrs Wilson and the Stage 2 children are part of the CSO Mathematics Improvement Initiative and over the last three weeks we have been learning about collecting data and presenting the data in graphs and tables. As an assessment the children were given a problem involving fundraising for Project Compassion.

The children came up with a question to ask the school so that they could collect data to make an informed decision. The question developed by the children was “What fundraiser would you like St Josephs to do to raise money for Project Compassion?” As a class we then came up with some possible suggestions and ideas.
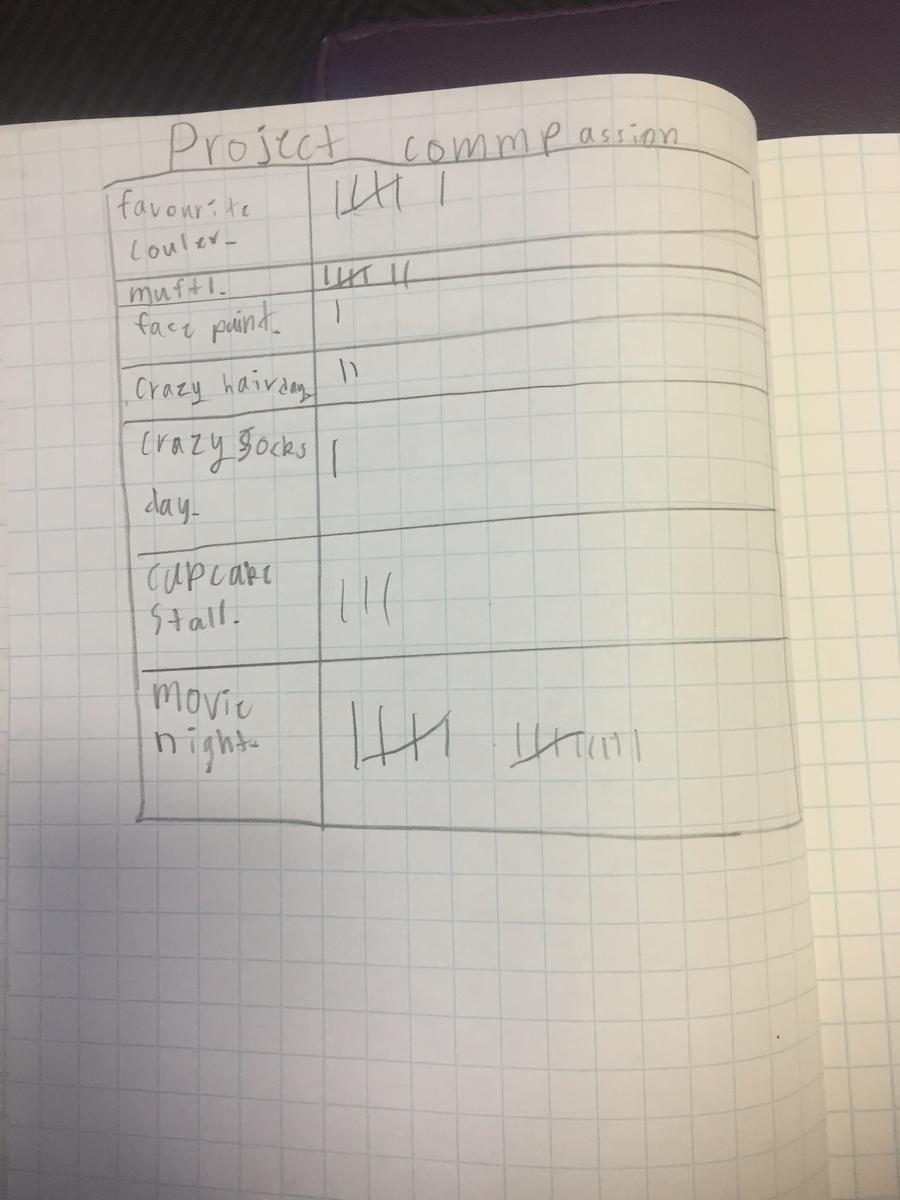
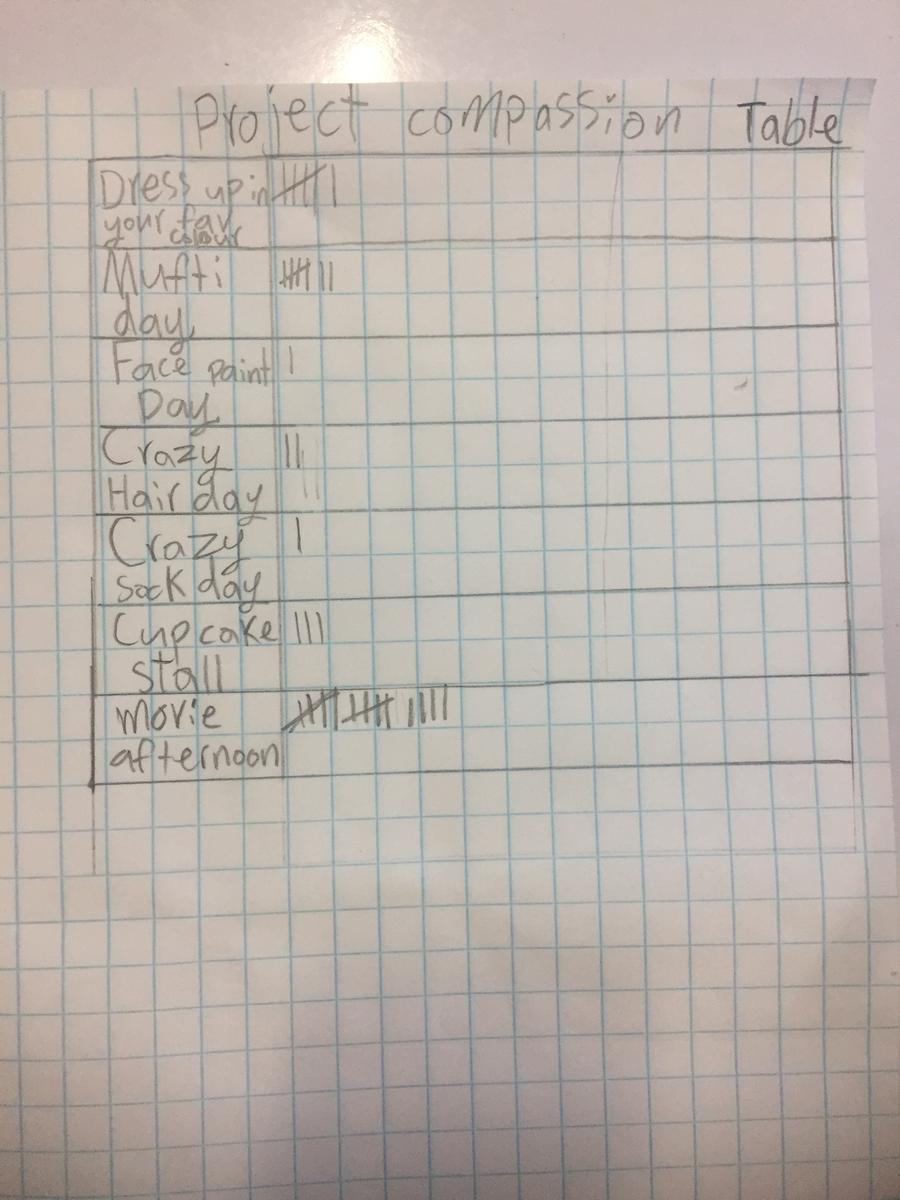
Next we had to collect the data with as little interruption to the school as possible. In Infants we made some signs with the suggestions on them and had the children stand behind a suggested fundraising idea and the 3-4 students counted the students. Olive collated the data onto a table.
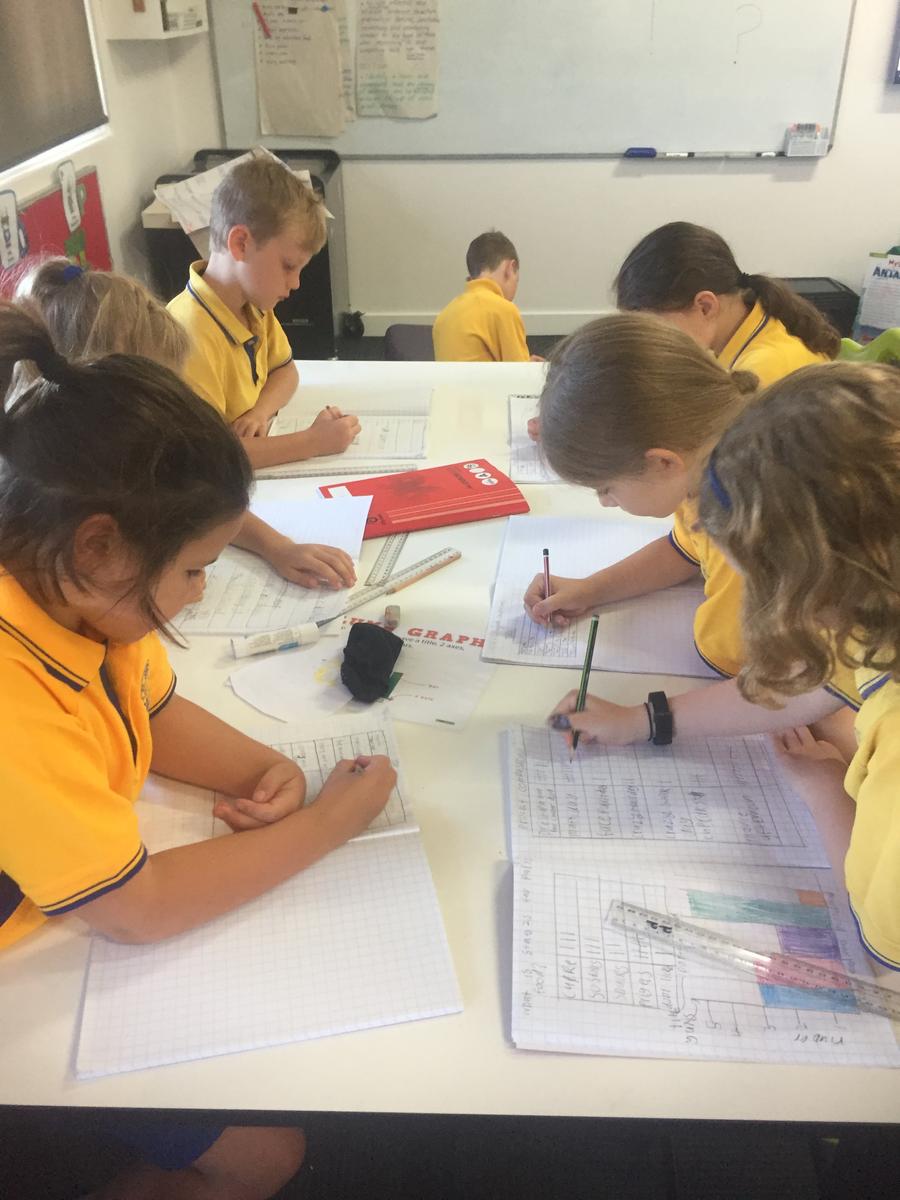
In our room we underwent the same process. Next we went into the Staff Hub to collect the teachers preferences.
For 5-6 we came up with a Google Form which we emailed to Mrs Meade and she emailed the survey to all the students. This meant the students were not interrupted during their learning and allowed the 3-4 class to come up with another way to collect data. Together as a class we collated the information.

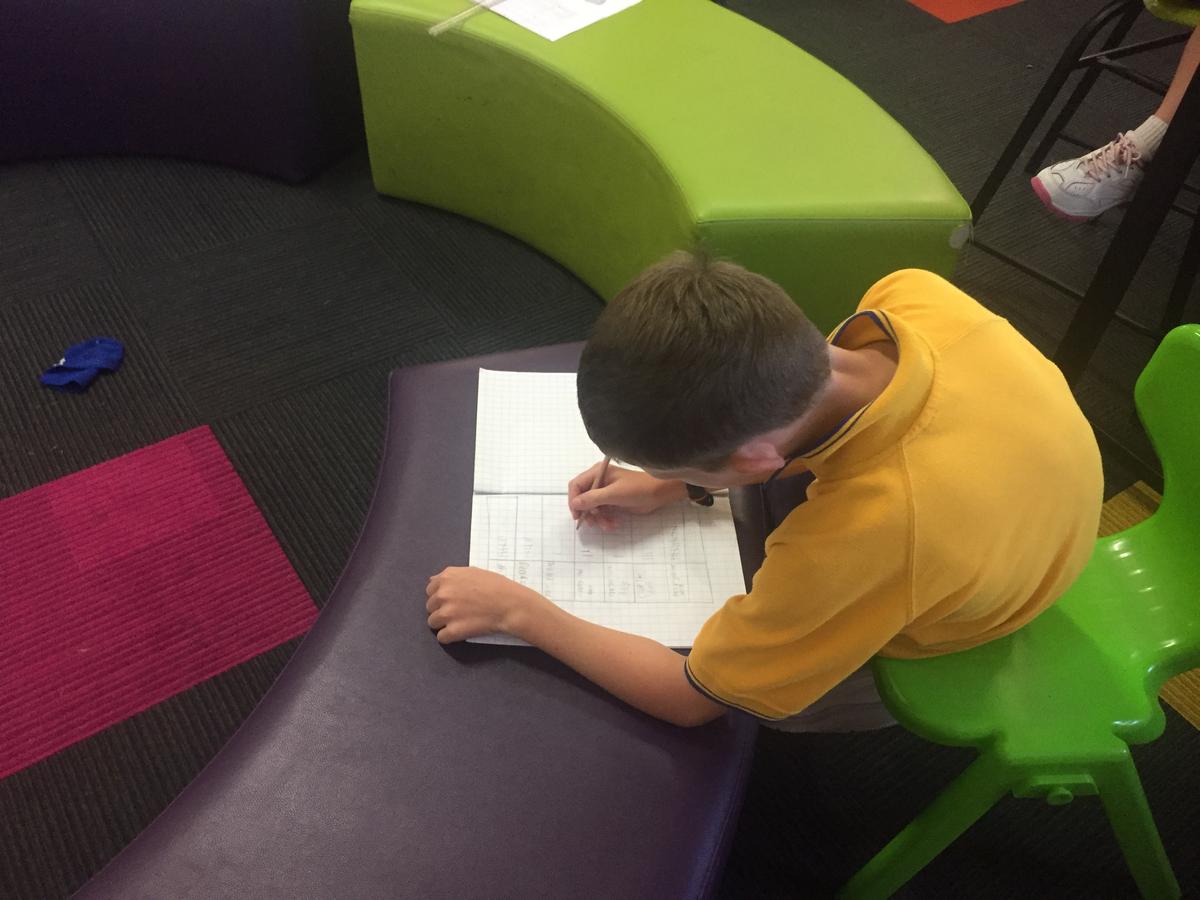
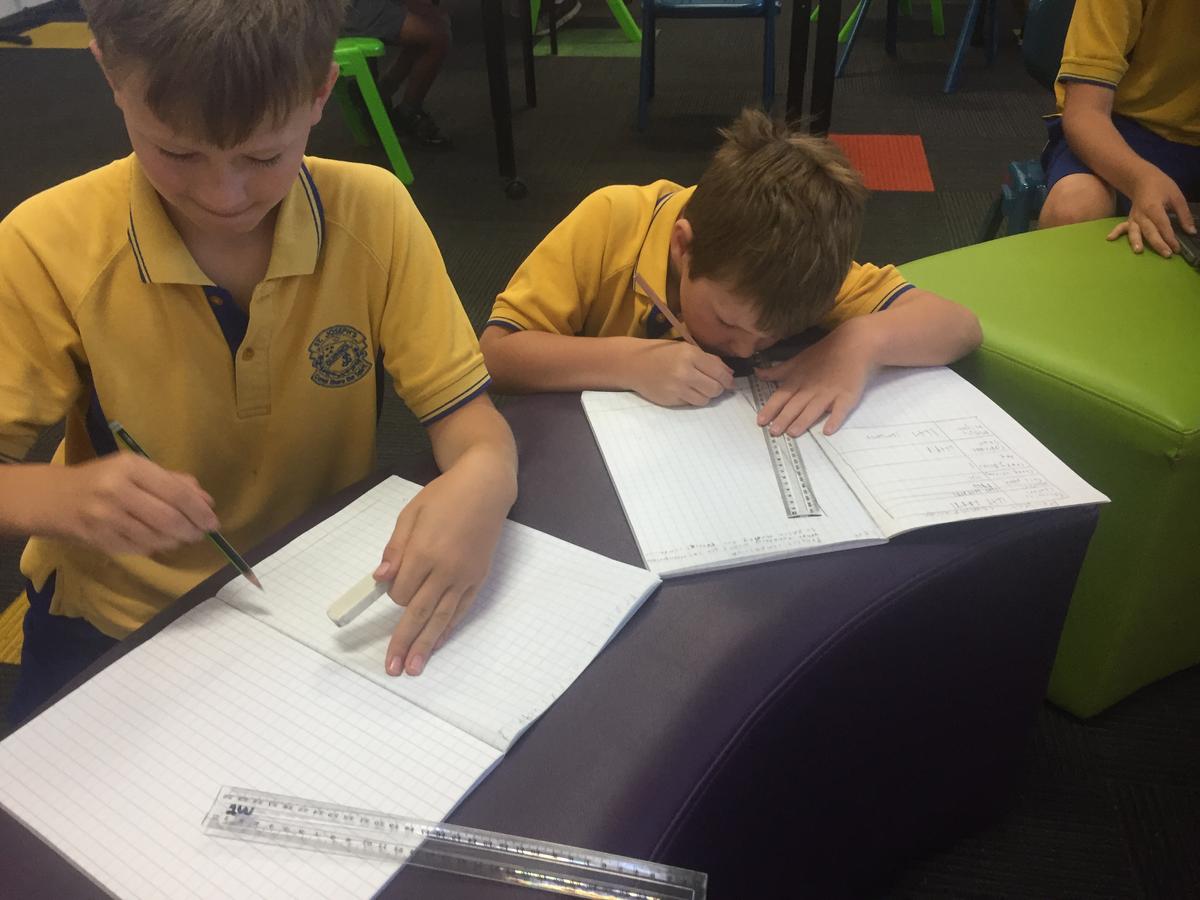
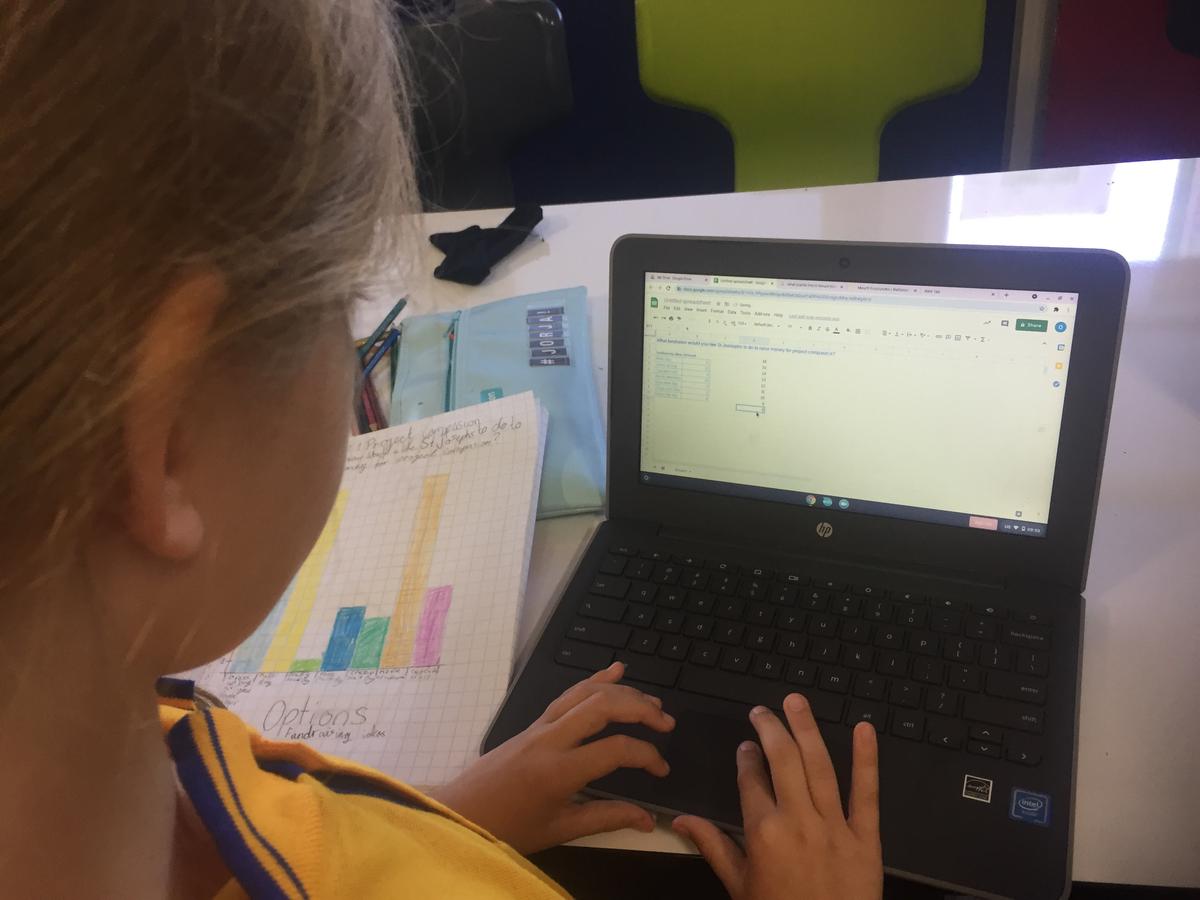
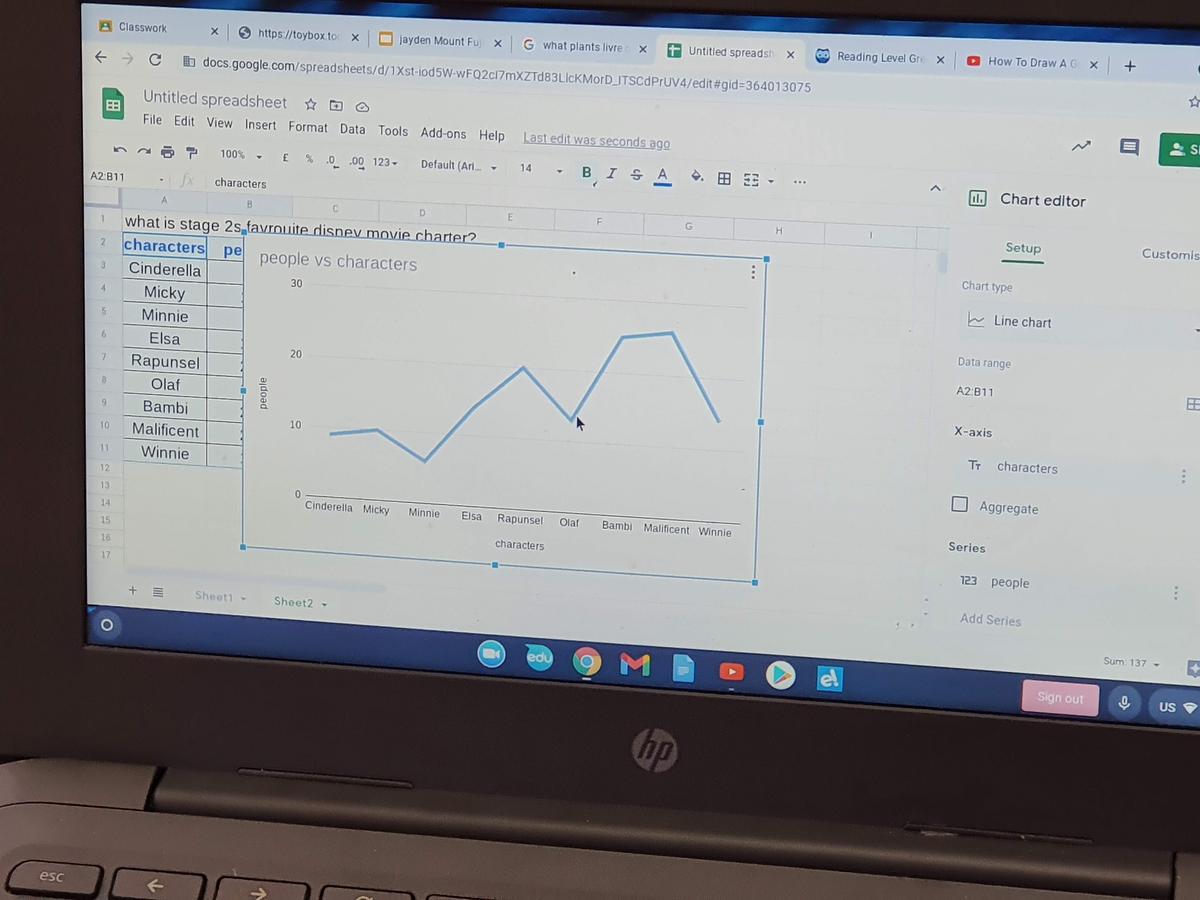
The last part of the assessment involved the students putting the data that we had collected into graphs and present our findings to Mrs Long. We used bar, column and picture graphs (these were drawn in our books as well as put onto spreadsheets).
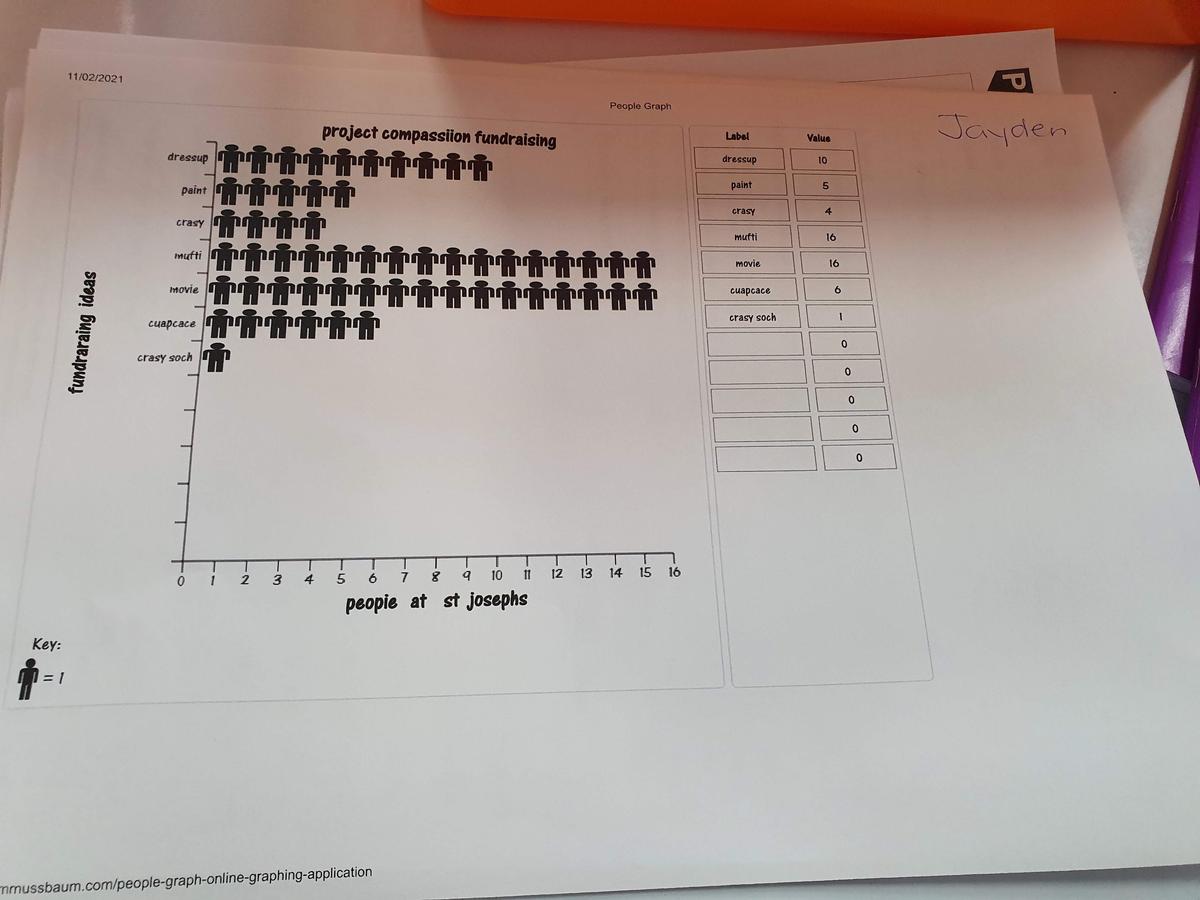
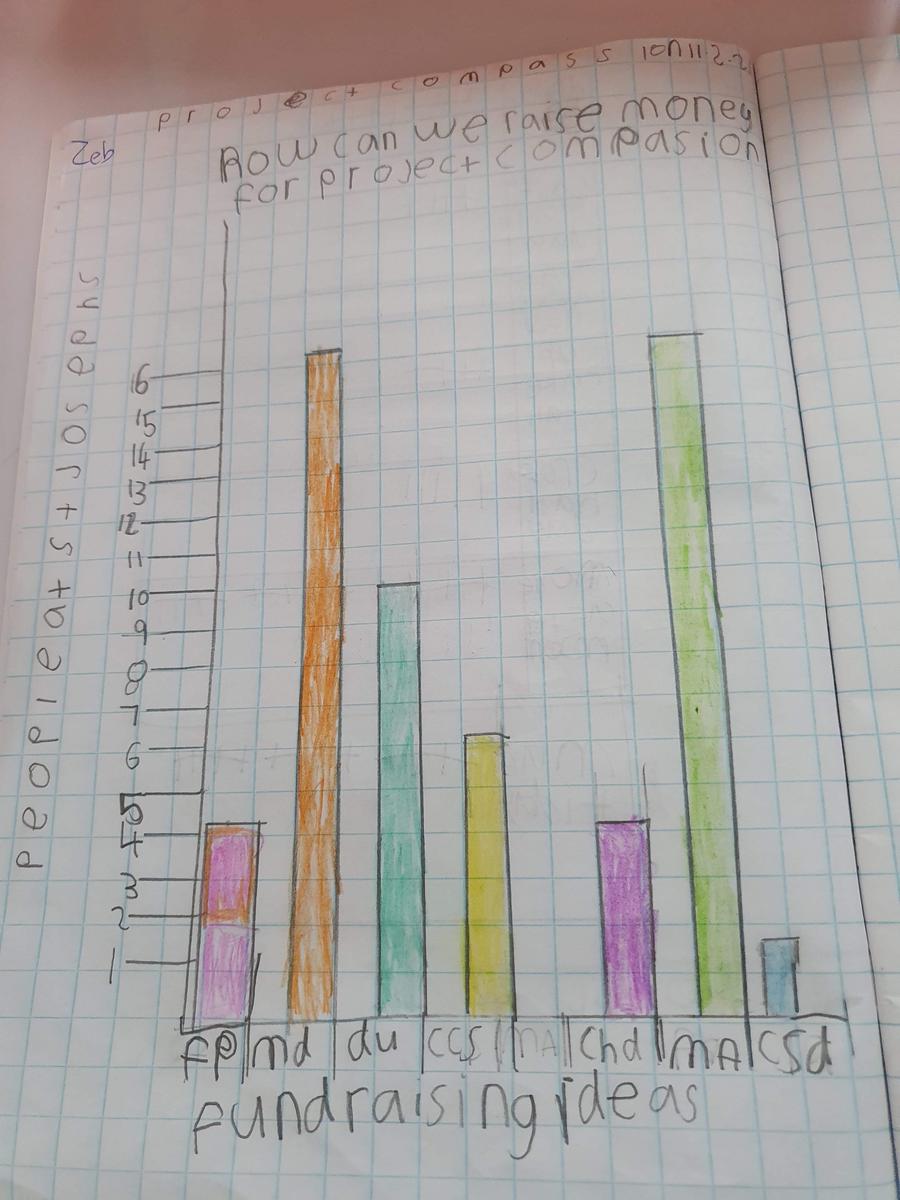


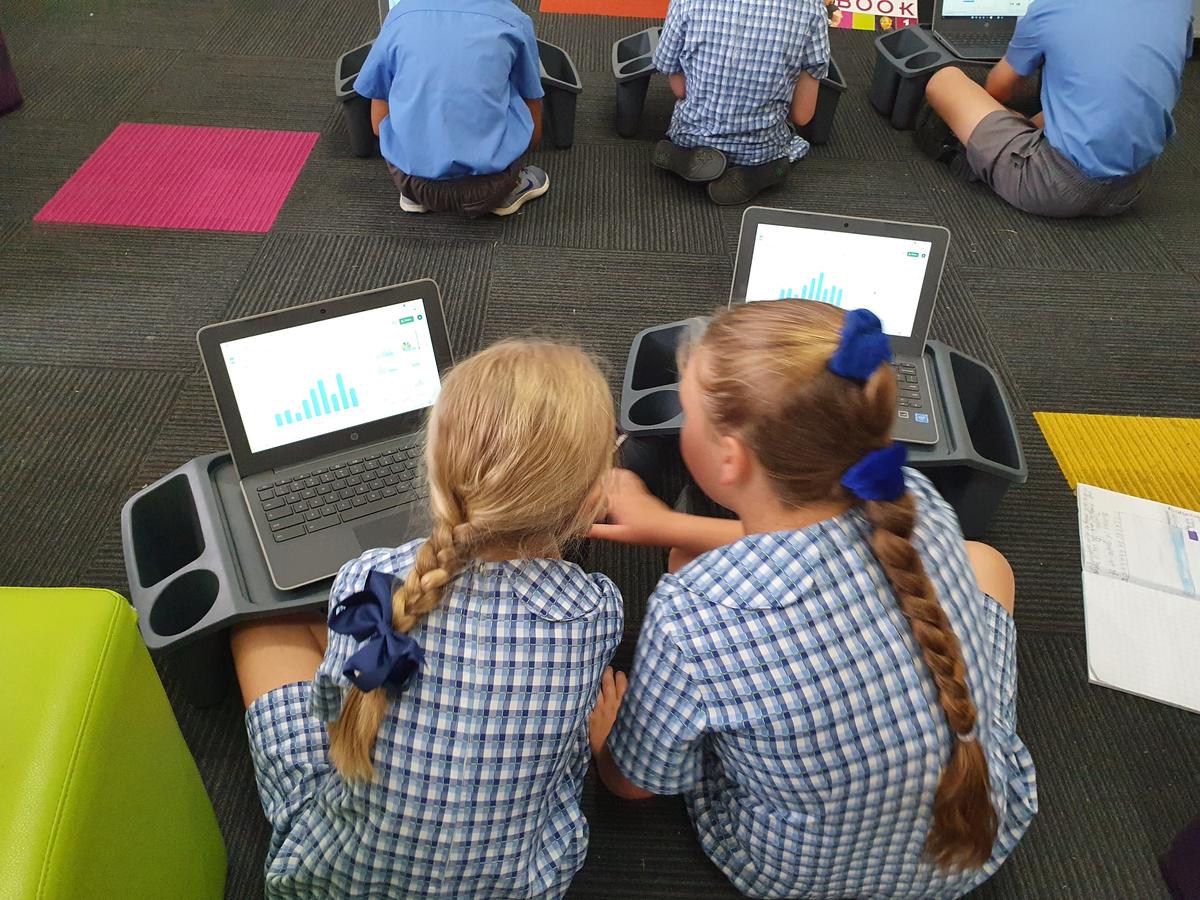
The children loved this activity and as a result we will be holding a mufti day and movie afternoon sometime this term for the 3-4 class to raise money for Project Compassion.