
Science News
Year 11 Chemistry teams up with the University of Melbourne
It’s no secret that Echuca’s water supply has been lower in quality over the past month. First there was the ‘boil water’ notification due to contamination of the water supply with storm water. Then recently, a number of people’s water went yellow. Coliban water advised customers this was due to contamination with Manganese. Apparently though, the levels were still low enough that it was safe for human consumption.
Mr Leslie’s chemistry class was fascinated by this information and had many questions about it such as:
- Where did the Manganese come from?
- What is the concentration of Manganese?
- Is the concentration the same everywhere or is it just certain parts of Echuca?
- Is there usually Manganese in drinking water?
- What is the maximum safe level for drinking?
- What are the health implications if the level is too high?
- Is the issue with added levels of Manganese due to flooding, or reduced capacity to filter the water?
Some of these questions could be answered with some googling and speculation. Others required chemical analysis. Unfortunately, as the concentration of Manganese was suspected to be really small (0.1mg/L or 1 part per 10 million), none of the analytical techniques available at St Joseph’s College would be sensitive enough for the analysis.
So, Mr Leslie contacted a colleague at The University of Melbourne. He agreed to use their latest piece of analytical equipment, an MP-AES (Microwave plasma – atomic emission spectrometer), for the analysis. This machine is capable of accurately analysing the concentration of metals in water down to a concentration of less than 1 part per billion (0.001 mg/L). Mr Leslie and Mr Williams provided samples of water from their homes, a sample of the school's water was also provided for analysis. For comparison, Mr Leslie’s class made a series of solutions with known concentrations of Manganese in them. The results came back four days later and after a few quick calculations, the class made the following discoveries:
- At the time of sampling, all three water samples had Manganese in them
- The concentration of Manganese did vary by location, ranging from 0.002mg/L (St Joseph’s) to 0.113mg/L (Mr Leslie’s house).
- The Australian Drinking Water Guidelines state that desirable level is <0.05mg/L and levels above 0.1mg/L will cause the water to taste different and produce stains. The water tested was only slightly above the recommended level.
- It was hypothesised that the Manganese levels have increased due to the floods bringing poorly oxygenated water into treatment plant.
Students realised that the findings of this experiment were limited and ultimately unreliable for a number of reasons:
- Only a small sample size was tested (5 samples from three locations).
- The sample dates were limited.
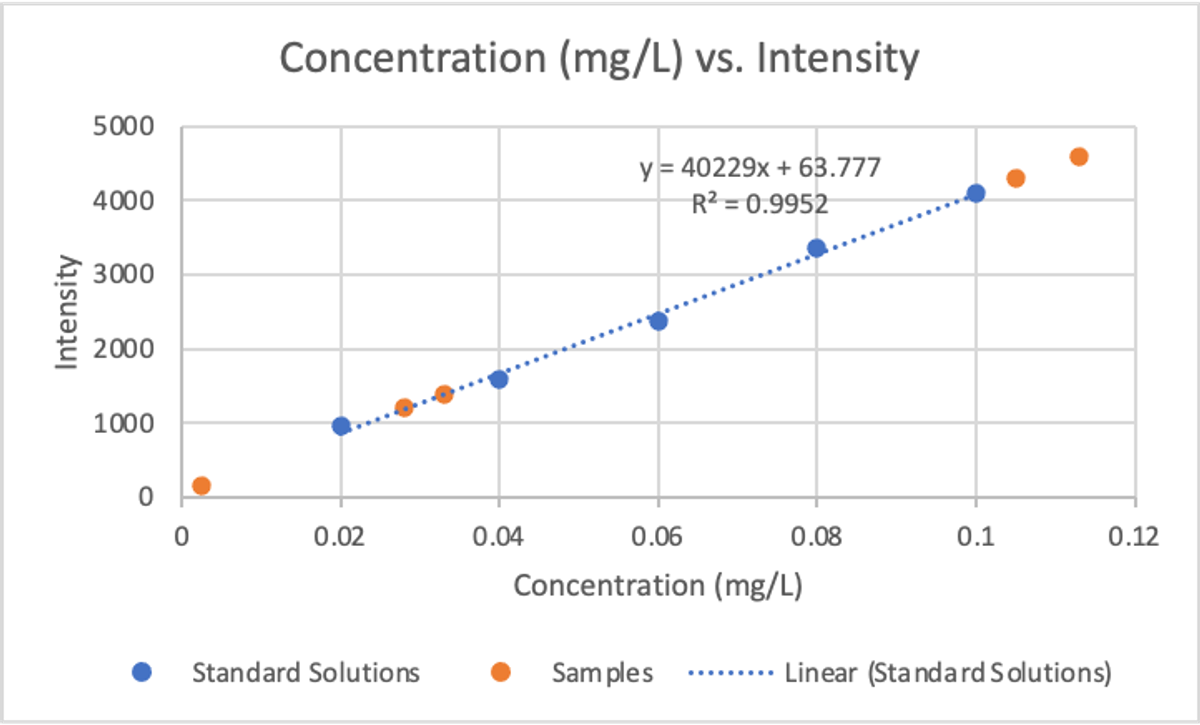
- The estimated concentration of three of the samples was unreliable as their concentration fell outside the range of the calibration curve (see below).
- There was no control group (before floods).
- The whole technique relies on really accurate comparison solutions (standard solutions), any issues with these will skew the results.
Students enjoyed the opportunity to apply their chemistry knowledge to a local situation and also to collaborate with The University of Melbourne. Mr Leslie would like to thank the analytical chemists at the university who generously donated their time.
See below for an example calibration curve produced by Jack Paterson.
Rhys Leslie
Learning Leader