Assistant Principal / Leader of Pedagogy
Mr Stephen Chapman

Assistant Principal / Leader of Pedagogy
Mr Stephen Chapman
What is a Data Wall?
Well, before I go on to “What is a Data Wall?”, I’d better explain what Data is. Data is INFORMATION. This information can be Quantitative (numbers) or Qualitative (Categories or words). These are also called Numerical Data and Categorical Data. As teachers, we use data in many different ways each day. When data is displayed on a wall, it’s called a Data Wall. Typically, the Data Wall is made of small photos of the students. Teachers can stand at the data wall and discuss students. Students can be moved along the data wall to show growth. There are rules for making an effective data wall.
A data wall should:
We have some Data Walls at school. Here are two examples:

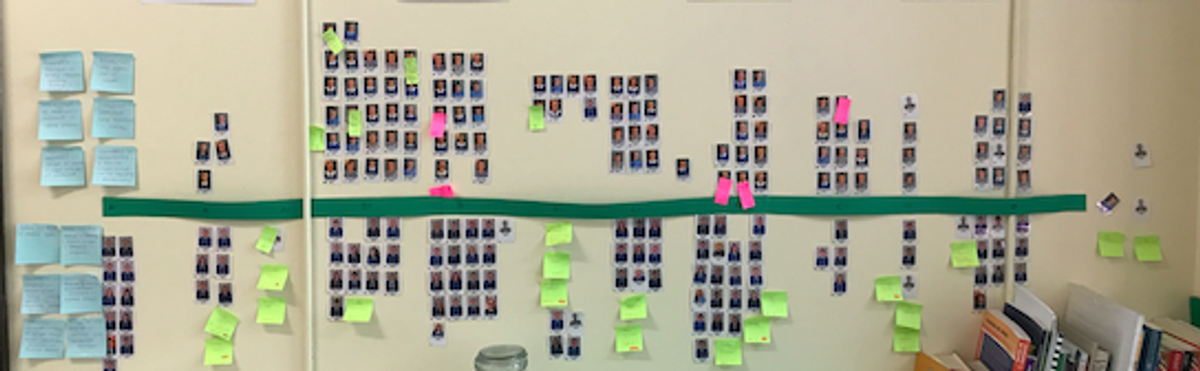
(Note, the quality of the above images has been reduced to maintain the privacy of the students)
Today (Friday), when the students were in a study period before break A, the staff of O’Connor met in Year Teams. These Professional Learning Teams (PLTs) discussed how they can collect, analyse and display data about their year group. Year 7, Year 8, Year 10, Year 11 and Year 12 all met and discussed student data. The Year 9 team supervised the students and will meet next time. Each of these six teams are being lead by the Leader of Learning for that year group. I’d like to thank Natalie Mellowship-Brown (Yr 7), Kath Czinner (Year 8), James Russell (Year 9), Amanda Bell and Frank Patricks (Year 10), Vicki Channon (Year 11) and Mark Fulloon (Year 12) for their leadership and facilitation throughout this semester. As teams, we are Putting Faces on the Data. The one of our whole-school goals is to use student data to improve our practice. A key aspect of this is owning the data and seeing it every day. That’s why data walls are so important.
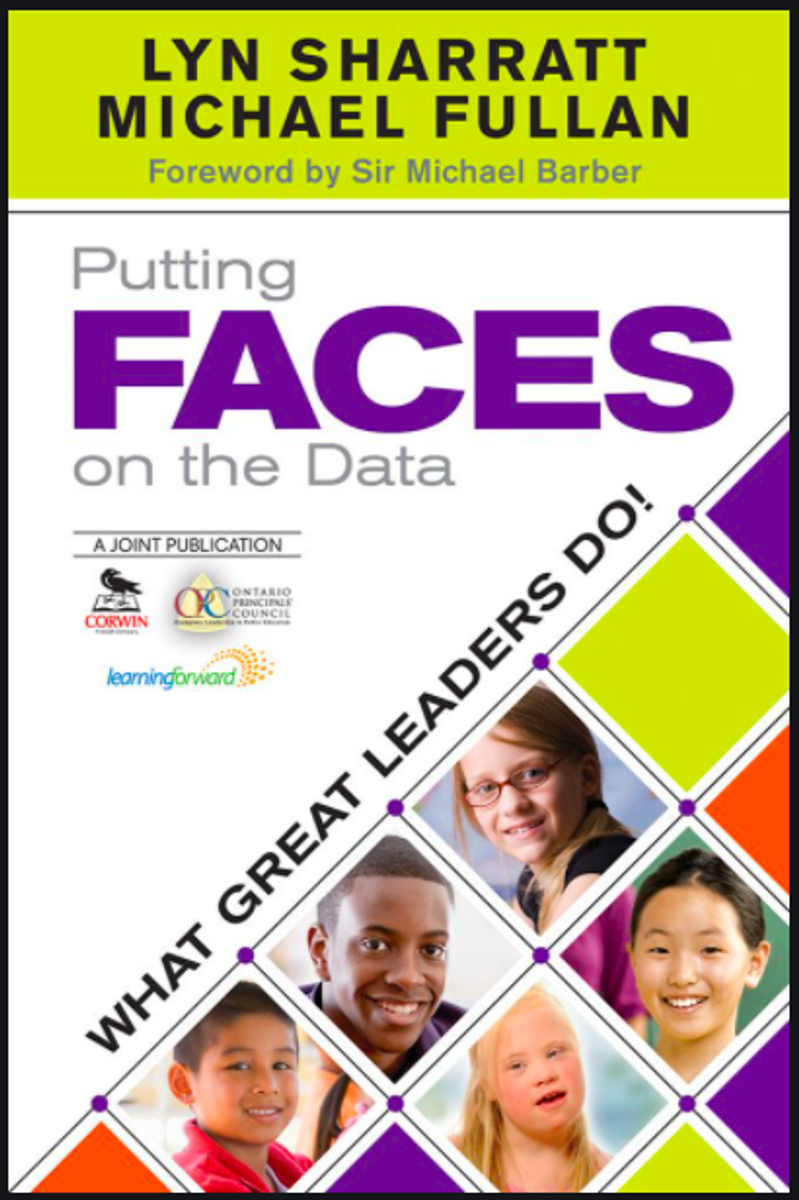
This is not just a gut feeling approach from us. We have, as a system of schools, being working with Dr Lyn Sharratt for a number of years to help us improve our practice. She, along with many other colleagues, knows that one of the key ways to improve learning outcomes in a school is to know your studetns. This information is data.
“Data today is instruction tomorrow” - Dr Lyn Sharratt
We have used Lyn’s books Putting Faces on the Data and Clarity to assist and guide our professional reading as staff at O’Connor. Both of these books talk about the powers of Data Walls to improve teaching in schools.

In the Year Meetings today, many of our staff looked at this infographic poster that visually lists some ways to use data to inform practice.
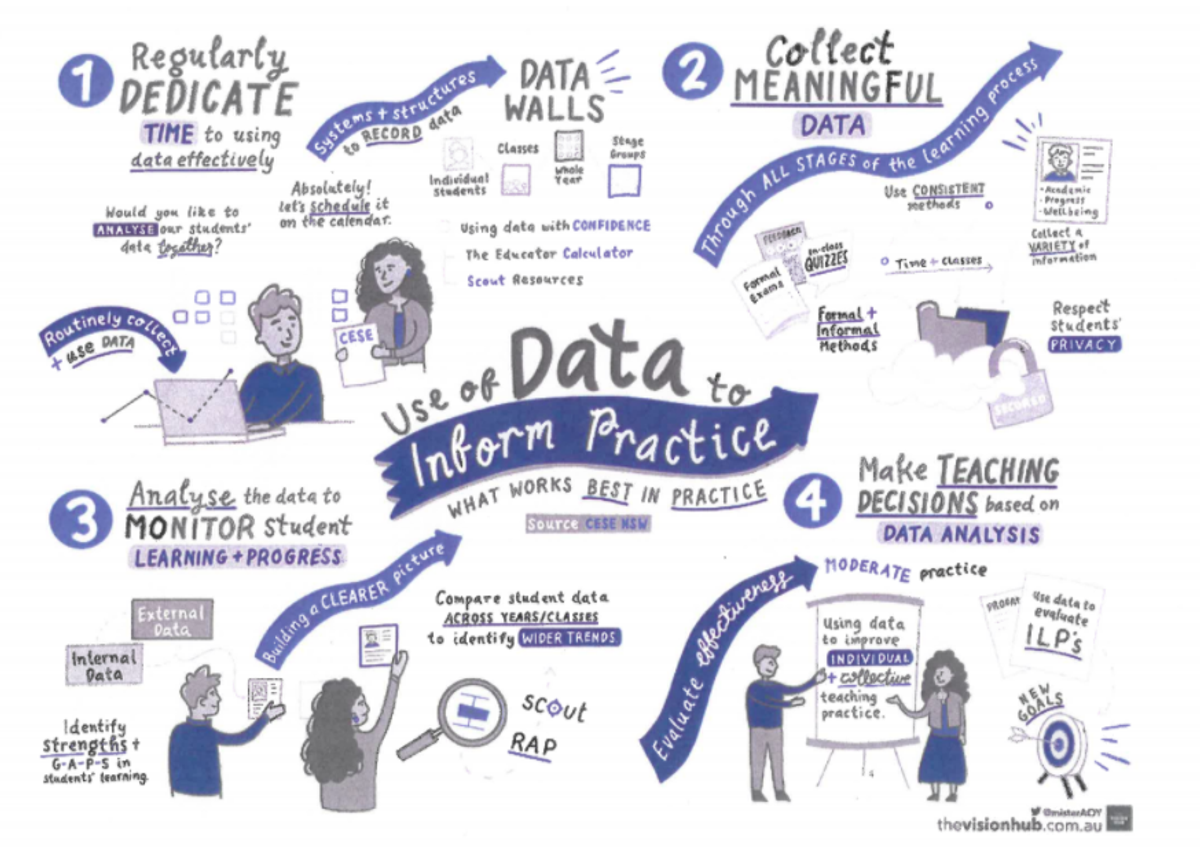
Here is a link to the above image.
So, back to the heading of this article: What is a Data Wall? It’s a wall where photos of students are put up to display data. In the privacy of the staffroom at O’Connor, we are about to see at least six more data walls thanks to the Year Teams working together. As a whole staff, we will be putting a face to every student in the school with a link to data. This is not just for display, but to help the teachers of each student to know them better and adjust their teaching accordingly.
At O’Connor, we really are putting Faces on the Data!
Mr Stephen Chapman
Assistant Principal - Leader of Pedagogy
Never stop learning; for when we stop learning, we stop growing - Jack Lewman